Original Article
Long-term skeletal and dental effects and treatment timing for functional
appliances in Class II malocclusion
Lorenzo Franchi
a; Chiara Pavoni
b; Kurt Faltin Jr
c; James A. McNamara Jr
d; Paola Cozza
eABSTRACT
Objective: To analyze the long-term skeletal and dentoalveolar effects and to evaluate treatment timing of Class II treatment with functional appliances followed by fixed appliances.
Materials and Methods: A group of 40 patients (22 females and 18 males) with Class II malocclusion consecutively treated either with a Bionator or an Activator followed by fixed appliances was compared with a control group of 20 subjects (9 females and 11 males) with untreated Class II malocclusion. Lateral cephalograms were available at the start of treatment (mean age 10 years), end of treatment with functional appliances (mean age 12 years), and long-term observation (mean age 18.6 years). The treated sample also was divided into two groups according to skeletal maturity. The early-treatment group was composed of 20 subjects (12 females and 8 males) treated before puberty, while the late-treatment group included 20 subjects (10 females and 10 males) treated at puberty. Statistical comparisons were performed with analysis of variance followed by Tukey’s post hoc tests.
Results: Significant long-term mandibular changes (Co-Gn) in the treated group (3.6 mm over the controls) were associated with improvements in the skeletal sagittal intermaxillary relationship, overjet, and molar relationship (,3.0–3.5 mm). Treatment during the pubertal peak was able to produce significantly greater increases in total mandibular length (4.3 mm) and mandibular ramus height (3.1 mm) associated with a significant advancement of the bony chin (3.9 mm) when compared with treatment before puberty.
Conclusion: Treatment of Class II malocclusion with functional appliances appears to be more effective at puberty. (Angle Orthod. 2013;83:334–340.)
KEY WORDS: Functional jaw orthopedics; Class II malocclusion; Cervical vertebral maturation; Cephalometrics; Puberty
INTRODUCTION
Functional jaw orthopedics (FJO) is a specific type of treatment for Class II dentoskeletal disharmonies associated with mandibular retrusion. Despite contro-versies on the effectiveness of FJO, it has been shown that in the short term, FJO produces different dentoskeletal results based on timing of treatment.1–9
A significant supplementary elongation of the mandible can be achieved only when FJO is performed at pubertal or immediately postpubertal periods of skel-etal development.2–6
Recently, it has been suggested that FJO at the pubertal spurt followed by fixed appliances is a viable therapeutic option in patients with unfavorable Class II malocclusions.10
As for the long-term outcomes of FJO, data available in the literature are much more scarce.4,6,11–15 While
Freeman et al.14 and Malta et al.15 have described a
long-term statistically significant increase in mandibular length in patients treated with FJO over untreated Class
aAssistant Professor, Department of Orthodontics, The
University of Florence, Florence, Italy; Thomas M. Graber Visiting Scholar, Department of Orthodontics and Pediatric Dentistry, School of Dentistry, The University of Michigan, Ann Arbor, Mich.
bPrivate practice, Rome, Italy.
cChair, Department of Orthodontics, School of Dentistry,
University Paulista, Sao Paulo, Brazil.
dThomas M. and Doris Graber Endowed Professor of
Dentistry, Department of Orthodontics and Pediatric Dentistry, School of Dentistry; and Research Professor, Center for Human Growth and Development, The University of Michigan, Ann Arbor, Mich.
eProfessor and Head, Department of Orthodontics, The
University of Rome ‘‘Tor Vergata,’’Rome, Italy.
Corresponding author: Dr Lorenzo Franchi, Dipartimento di Odontostomatologia, Universita` degli Studi di Firenze, Via del Ponte di Mezzo, 46-48, 50127, Firenze, Italy
(e-mail: [email protected]).
Accepted: July 2012. Submitted: May 2012. Published Online: August 29, 2012
G2013 by The EH Angle Education and Research Foundation,
II controls of about 3 to 3.5 mm, DeVincenzo11 and
Hansen and Pancherz12 have reported a lack of
significant changes for the mandible of treated Class II subjects in the long term. However, in both latter studies, the nature of the controls was problematic, with DeVincenzo11using a mixed group of Class II and Class
I subjects (some of whom had been treated before or were still in treatment), while Hansen and Pancherz12
used values derived from the ‘‘Bolton Standards,’’ a group of subjects highly selected on the basis of ideal occlusions and well-balanced faces.16 Few studies4,6
have described the long-term effects of FJO at different stages of dentoskeletal development.
The aim of the present study was to analyze the long-term dentoskeletal effects of Class II treatment with functional appliances (Bionator or Activator) followed by fixed appliances and to compare the dentoskeletal changes induced by the treatment at two different stages of skeletal maturation (prepubertal vs pubertal).
MATERIALS AND METHODS
The cephalometric records of 40 patients (22 females and 18 males) with Class II division 1 malocclusion (overjet greater than 5 mm, full Class II, or end-to-end molar relationships, maxillomandibular differential smaller than 23 mm17) treated
consecutive-ly either with the Bionator (21 subjects) or Activator (19 subjects) were reviewed. The subjects were collected from an orthodontic practice (Bionator) and from the records of patients treated in the Department of Orthodontics of the University of Rome Tor Vergata (Activator). The study project was approved by the Ethical Committee at the University of Rome Tor Vergata, and informed consent was obtained from the subjects’ parents.
The nonextraction treatment protocols consisted either of a Bionator constructed without coverage of the lower incisors6,15or of an acrylic monobloc attached
to the upper arch by Adams clasps and with capping of the upper and lower incisors.18 Treatment with
func-tional appliances finished with the achievement of
Class I molar relationship and was followed by fixed appliance therapy in the permanent dentition. To be included in the study, the patients had to present with lateral cephalograms available at three time periods: T1, at the start of treatment; T2, at the end of FJO; and T3, at long-term observation after completion of growth,19 including the phase with fixed appliances.
The T3 observations were collected and analyzed regardless of the treatment outcomes in terms of correction of Class II malocclusion in the individual patients. This approach assisted in further reducing potential selection bias of the study. The lateral cephalograms of a matched control group of 20 white subjects (9 females and 11 males) with untreated Class II division 1 malocclusion were obtained from the University of Michigan Growth Study and the Denver Child Growth Study. The demographic data of the treated and control samples are reported in Table 1.
The treated sample was divided into two groups according to skeletal maturity at the start of treatment evaluated by means of the cervical vertebral matura-tion (CVM) method.19The early-treatment group (ETG;
Table 1) was composed of 20 subjects (12 females and 8 males) presenting with CS1 at T1. CVM stages at T2 were either CS1 or CS2. Therefore, the peak in growth velocity was not included in the period of treatment with functional appliances for any of the subjects in ETG. At T3, all subjects of the ETG presented with CS6. The late-treatment group (LTG; Table 1) included 20 subjects (10 females and 10 males) presenting with CS3 at T1. Stages in CVM at T2 were either CS4 or CS5. Therefore, the peak in growth velocity was included in the period of treatment with functional appliances for all of the subjects in LTG. Stage in CVM at T3 was CS6 for all the subjects of the LTG. The demographic data of ETG and LTF are reported in Table 1.
The practitioners who performed the treatment were blind to the fact that the patients would be part of a clinical study on the differential effects of the treatment timing (ETG vs LTG) with functional appliances in Class II malocclusion. Similarly, the examiners who analyzed lateral cephalograms of treated patients
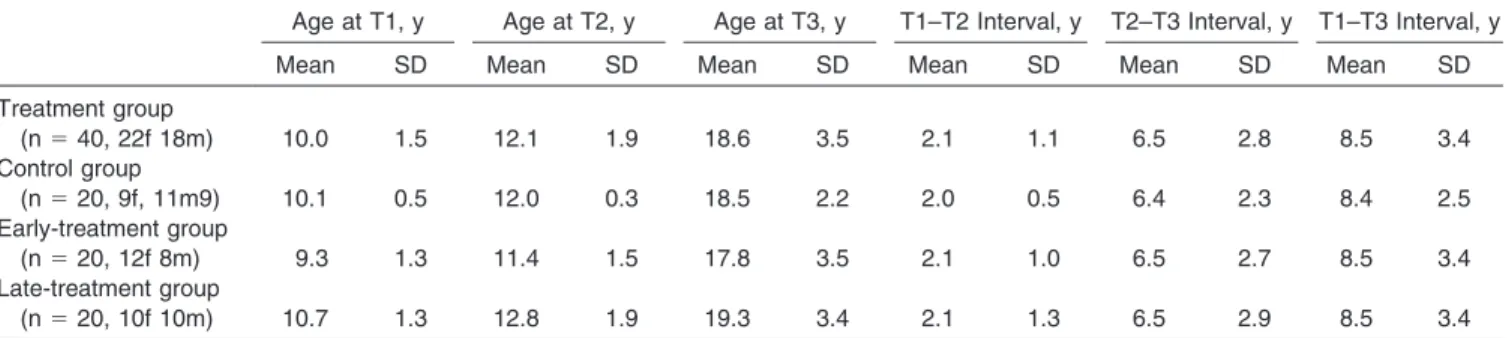
Table 1. Demographics for the Treatment and Control Groups
Age at T1, y Age at T2, y Age at T3, y T1–T2 Interval, y T2–T3 Interval, y T1–T3 Interval, y
Mean SD Mean SD Mean SD Mean SD Mean SD Mean SD
Treatment group (n 5 40, 22f 18m) 10.0 1.5 12.1 1.9 18.6 3.5 2.1 1.1 6.5 2.8 8.5 3.4 Control group (n 5 20, 9f, 11m9) 10.1 0.5 12.0 0.3 18.5 2.2 2.0 0.5 6.4 2.3 8.4 2.5 Early-treatment group (n 5 20, 12f 8m) 9.3 1.3 11.4 1.5 17.8 3.5 2.1 1.0 6.5 2.7 8.5 3.4 Late-treatment group (n 5 20, 10f 10m) 10.7 1.3 12.8 1.9 19.3 3.4 2.1 1.3 6.5 2.9 8.5 3.4
before and after treatment were blind as to the origin of the films and to the group to which individual patients belonged (double-blind design of the study).
Cephalometric Analysis
All lateral cephalograms of each patient were hand traced at a single sitting. Cephalograms were traced by one investigator. Landmark location and the accuracy of the anatomical outlines were verified by a second. Any discrepancies as to landmark placement were resolved by mutual agreement. A customized digitiza-tion regimen (Viewbox, version 3.0, dHAL Software, Kifissia, Greece) was created and used for the cephalometric evaluation.
Lateral cephalograms for each patient at T1, T2, and T3 were digitized, and a custom cephalometric analysis was used. Twenty variables (13 linear and 7 angular) were generated for each tracing. Lateral cephalograms of treated and control groups at T1, T2, and T3 were standardized as to magnification factor (8%).
Method Error and Sample Size Calculation
Eleven subjects from the final samples (33 cephalo-grams) were selected at random. All films were retraced
and redigitized. Intraclass correlation coefficients were calculated to compare within-subjects variability to between-subjects variability. Correlation coefficients for the dentoskeletal measures were greater than .95.
The sample size for the treated and control groups was calculated considering a clinically significant difference of 3.0 mm in the maxillo-mandibular differential with a standard deviation of 2.9 mm (as derived from a previous study15), a power of .80, and
alpha of .05. The calculated sample size for the analysis of variance (ANOVA) test was 19 subjects in each group (SigmaStat 3.5, Systat Software, Point Richmond, Calif).
Statistical Analysis
The Mann-Whitney U-test was applied to the comparisons between craniofacial starting forms in the treated group vs control group and ETG vs LTG. ANOVA followed by Tukey’s post hoc tests were performed to compare T1–T2, T2–T3, and T1–T3 changes in the treated sample vs control group and in ETG vs LTG. All statistical computations were calcu-lated with a statistical software package (Statistical Package for the Social Sciences, SPSS, version 16.0.1, Chicago, Ill).
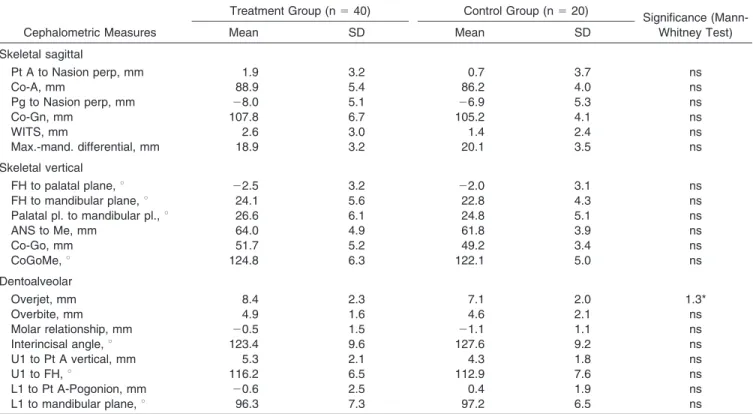
Table 2. Starting Forms for the Treatment Group vs Control Groupa
Cephalometric Measures
Treatment Group (n 5 40) Control Group (n 5 20)
Significance (Mann-Whitney Test) Mean SD Mean SD Skeletal sagittal Pt A to Nasion perp, mm 1.9 3.2 0.7 3.7 ns Co-A, mm 88.9 5.4 86.2 4.0 ns Pg to Nasion perp, mm 28.0 5.1 26.9 5.3 ns Co-Gn, mm 107.8 6.7 105.2 4.1 ns WITS, mm 2.6 3.0 1.4 2.4 ns Max.-mand. differential, mm 18.9 3.2 20.1 3.5 ns Skeletal vertical FH to palatal plane,u 22.5 3.2 22.0 3.1 ns FH to mandibular plane,u 24.1 5.6 22.8 4.3 ns Palatal pl. to mandibular pl.,u 26.6 6.1 24.8 5.1 ns ANS to Me, mm 64.0 4.9 61.8 3.9 ns Co-Go, mm 51.7 5.2 49.2 3.4 ns CoGoMe,u 124.8 6.3 122.1 5.0 ns Dentoalveolar Overjet, mm 8.4 2.3 7.1 2.0 1.3* Overbite, mm 4.9 1.6 4.6 2.1 ns Molar relationship, mm 20.5 1.5 21.1 1.1 ns Interincisal angle,u 123.4 9.6 127.6 9.2 ns U1 to Pt A vertical, mm 5.3 2.1 4.3 1.8 ns U1 to FH,u 116.2 6.5 112.9 7.6 ns L1 to Pt A-Pogonion, mm 20.6 2.5 0.4 1.9 ns L1 to mandibular plane,u 96.3 7.3 97.2 6.5 ns
ans indicates not significant; Max-mand differential, maxillo-mandibular differential was calculated as the difference between Co-Gn and Co-A.
The molar relationship was measured as the distance between mesial contact heights of contour on the maxillary and mandibular first molars along the functional occlusal plane.
RESULTS
Descriptive data and statistical comparisons be-tween treated and control groups for starting forms and cephalometric changes from T1 to T2, T2 to T3, and T1 to T3 are given in Tables 2 and 3, respectively.
There were no significant differences between the treated group and the control group in starting forms except for overjet, which was significantly greater by 1.3 mm in the treated group (Table 2).
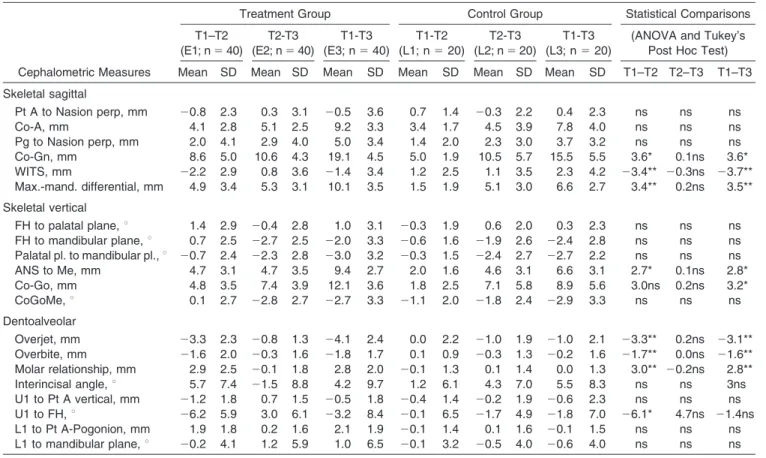
When compared with the controls, the treated group presented with a significant increase of 3.6 mm in mandibular length (Co-Gn) both in the short term (T1– T2 interval) and in the long term (T1–T3 interval; Table 3). There were no significant between-group differences for skeletal sagittal maxillary measures. The treated group showed a significant decrease in the Wits appraisal and a significant increase in the maxillo-mandibular differential with respect to the control sample both in the T1–T2 (23.4 mm and 3.4 mm, respectively) and in the T1–T3 intervals (23.7 mm and 3.5 mm, respectively). Lower anterior facial height (ANS-Me) was increased significantly in the treated group both in the short term (2.7 mm) and in the long term (2.8 mm), while the mandibular ramus (Co-Go)
was significantly increased in the treated group in the T1–T3 interval (3.2 mm). Both overjet and overbite exhibited significant decreases both during the T1–T2 interval (23.3 mm and 21.7 mm, respectively) and during the T1–T3 interval (23.1 mm and 21.6 mm, respectively). The sagittal relationship of the maxillary and mandibular molars improved significantly in the treatment group both in the short-term interval (3.0 mm) and in the long-term interval (2.8 mm). The treated group exhibited also a significant retroclination of upper incisors in the T1–T2 interval (U1 to FH, 26.1u).
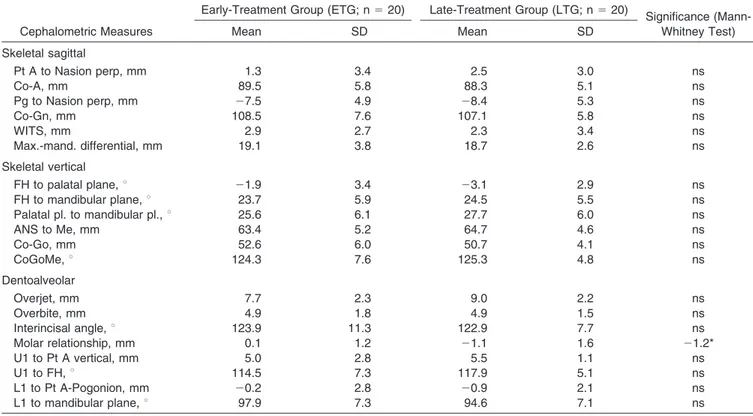
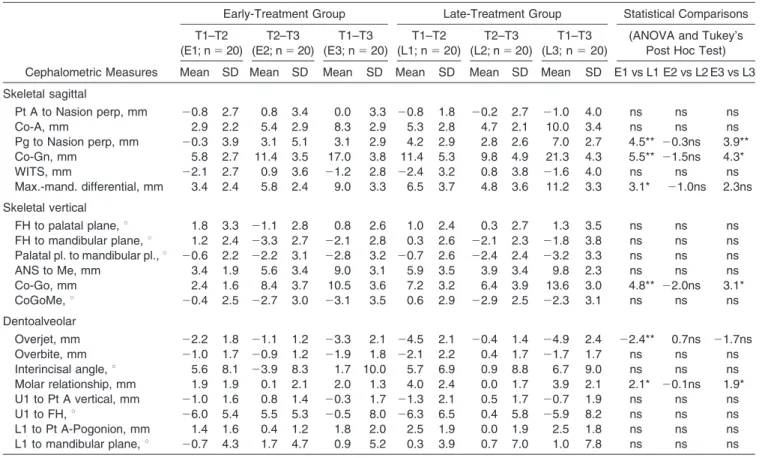
There were no significant differences between the ETG and the LTG in starting forms except for molar relationship, which was significantly more distal by 1.2 mm in the LTG (Table 4).
The comparisons between the ETG and the LTG (Table 5) revealed that the chin was significantly more protruded in LTG both in the T1–T2 and in the T1–T3 intervals (Pg to Nasion perpendicular 4.5 mm and 3.9 mm, respectively). Total mandibular length showed significantly greater increases in the LTG vs ETG both in the short-term interval (5.5 mm) and long-term interval (4.3 mm). The LTG showed a significant increase in the maxillo-mandibular differential during
Table 3. Descriptive Statistics and Statistical Comparisons for the Treatment Group vs Control Group at the Three Observation Intervalsa
Cephalometric Measures
Treatment Group Control Group Statistical Comparisons
T1–T2 (E1; n 5 40) T2-T3 (E2; n 5 40) T1-T3 (E3; n 5 40) T1-T2 (L1; n 5 20) T2-T3 (L2; n 5 20) T1-T3 (L3; n 5 20)
(ANOVA and Tukey’s Post Hoc Test) Mean SD Mean SD Mean SD Mean SD Mean SD Mean SD T1–T2 T2–T3 T1–T3 Skeletal sagittal Pt A to Nasion perp, mm 20.8 2.3 0.3 3.1 20.5 3.6 0.7 1.4 20.3 2.2 0.4 2.3 ns ns ns Co-A, mm 4.1 2.8 5.1 2.5 9.2 3.3 3.4 1.7 4.5 3.9 7.8 4.0 ns ns ns Pg to Nasion perp, mm 2.0 4.1 2.9 4.0 5.0 3.4 1.4 2.0 2.3 3.0 3.7 3.2 ns ns ns Co-Gn, mm 8.6 5.0 10.6 4.3 19.1 4.5 5.0 1.9 10.5 5.7 15.5 5.5 3.6* 0.1ns 3.6* WITS, mm 22.2 2.9 0.8 3.6 21.4 3.4 1.2 2.5 1.1 3.5 2.3 4.2 23.4** 20.3ns 23.7** Max.-mand. differential, mm 4.9 3.4 5.3 3.1 10.1 3.5 1.5 1.9 5.1 3.0 6.6 2.7 3.4** 0.2ns 3.5** Skeletal vertical FH to palatal plane,u 1.4 2.9 20.4 2.8 1.0 3.1 20.3 1.9 0.6 2.0 0.3 2.3 ns ns ns FH to mandibular plane,u 0.7 2.5 22.7 2.5 22.0 3.3 20.6 1.6 21.9 2.6 22.4 2.8 ns ns ns Palatal pl. to mandibular pl.,u 20.7 2.4 22.3 2.8 23.0 3.2 20.3 1.5 22.4 2.7 22.7 2.2 ns ns ns ANS to Me, mm 4.7 3.1 4.7 3.5 9.4 2.7 2.0 1.6 4.6 3.1 6.6 3.1 2.7* 0.1ns 2.8* Co-Go, mm 4.8 3.5 7.4 3.9 12.1 3.6 1.8 2.5 7.1 5.8 8.9 5.6 3.0ns 0.2ns 3.2* CoGoMe,u 0.1 2.7 22.8 2.7 22.7 3.3 21.1 2.0 21.8 2.4 22.9 3.3 ns ns ns Dentoalveolar Overjet, mm 23.3 2.3 20.8 1.3 24.1 2.4 0.0 2.2 21.0 1.9 21.0 2.1 23.3** 0.2ns 23.1** Overbite, mm 21.6 2.0 20.3 1.6 21.8 1.7 0.1 0.9 20.3 1.3 20.2 1.6 21.7** 0.0ns 21.6** Molar relationship, mm 2.9 2.5 20.1 1.8 2.8 2.0 20.1 1.3 0.1 1.4 0.0 1.3 3.0** 20.2ns 2.8** Interincisal angle,u 5.7 7.4 21.5 8.8 4.2 9.7 1.2 6.1 4.3 7.0 5.5 8.3 ns ns 3ns U1 to Pt A vertical, mm 21.2 1.8 0.7 1.5 20.5 1.8 20.4 1.4 20.2 1.9 20.6 2.3 ns ns ns U1 to FH,u 26.2 5.9 3.0 6.1 23.2 8.4 20.1 6.5 21.7 4.9 21.8 7.0 26.1* 4.7ns 21.4ns L1 to Pt A-Pogonion, mm 1.9 1.8 0.2 1.6 2.1 1.9 20.1 1.4 0.1 1.6 20.1 1.5 ns ns ns L1 to mandibular plane,u 20.2 4.1 1.2 5.9 1.0 6.5 20.1 3.2 20.5 4.0 20.6 4.0 ns ns ns
ans indicates not significant.
the T1–T2 interval (3.1 mm). The mandibular ramus (Co-Go) was significantly increased in the LTG both in the T1–T2 and in the T1–T3 intervals (4.8 mm and 3.1 mm, respectively). Overjet exhibited significant decreases in LTG vs ETG during the T1–T2 interval (22.4 mm). The distal molar relationship was signifi-cantly improved in the LTG both in the short term (2.1 mm) and in the long term (1.9 mm).
DISCUSSION
No short- or long-term maxillary effects were assessed as a consequence of FJO in Class II patients. This result confirms observations of a previous controlled long-term study on the effects of the Bionator.15
The functional appliances induced a significant elongation of the mandible over the controls (3.6 mm) that was maintained in the long term. The significant elongation in the mandible was not associ-ated with a significant advancement of the chin (Pg to Nasion perpendicular) both in the short term and in the long term. This observation is in agreement with a previous study on the long-term effects of the Bionator.15 The functional appliances, however, were
effective in improving the skeletal sagittal intermaxil-lary relationship with a reduction of approximately 3.5 mm both in the Wits appraisal and in the maxillo-mandibular differential that occurred both in the short
term and in the long term. This result differs from what reported in the study by Malta et al.,15
who did not find any significant skeletal intermaxillary change.
As for the vertical skeletal effects, functional appliance treatment did not induce any significant change either in the inclination of the palatal plane to the Frankfort horizontal or in the inclination of the mandibular plane to the Frankfort horizontal and to the palatal plane. A significant increase in lower anterior facial height in the treated group was associated with a significant increase in the height of the mandibular ramus in the long term. Adequate control of vertical skeletal relationships in the long term was achieved through a good balance between posterior and anterior facial height increases. Similar findings were also reported by Malta et al.,15
who found a significant increase in the vertical dimensions of the face as a result of Bionator therapy.
In the current study, functional appliances were effective in reducing both the overjet and the overbite (by approximately 3.0 mm and 1.5 mm, respectively) and in improving the sagittal molar relationship (by approximately 3.0 mm) both in the short term and in the long term. A contribution to overjet correction was provided by a retroclination of the upper incisors in the short term. There were no statistically significant changes in the inclination of the lower incisors either
Table 4. Starting Forms for the Early-Treatment Group vs Late-Treatment Groupa
Cephalometric Measures
Early-Treatment Group (ETG; n 5 20) Late-Treatment Group (LTG; n 5 20)
Significance (Mann-Whitney Test) Mean SD Mean SD Skeletal sagittal Pt A to Nasion perp, mm 1.3 3.4 2.5 3.0 ns Co-A, mm 89.5 5.8 88.3 5.1 ns Pg to Nasion perp, mm 27.5 4.9 28.4 5.3 ns Co-Gn, mm 108.5 7.6 107.1 5.8 ns WITS, mm 2.9 2.7 2.3 3.4 ns Max.-mand. differential, mm 19.1 3.8 18.7 2.6 ns Skeletal vertical FH to palatal plane,u 21.9 3.4 23.1 2.9 ns FH to mandibular plane,u 23.7 5.9 24.5 5.5 ns Palatal pl. to mandibular pl.,u 25.6 6.1 27.7 6.0 ns ANS to Me, mm 63.4 5.2 64.7 4.6 ns Co-Go, mm 52.6 6.0 50.7 4.1 ns CoGoMe,u 124.3 7.6 125.3 4.8 ns Dentoalveolar Overjet, mm 7.7 2.3 9.0 2.2 ns Overbite, mm 4.9 1.8 4.9 1.5 ns Interincisal angle,u 123.9 11.3 122.9 7.7 ns Molar relationship, mm 0.1 1.2 21.1 1.6 21.2* U1 to Pt A vertical, mm 5.0 2.8 5.5 1.1 ns U1 to FH,u 114.5 7.3 117.9 5.1 ns L1 to Pt A-Pogonion, mm 20.2 2.8 20.9 2.1 ns L1 to mandibular plane,u 97.9 7.3 94.6 7.1 ns
ans indicates not significant.
in the short or in the long term in the treatment group vs the control group. This finding suggests that there was no dentoalveolar compensation in the skeletal correction of Class II malocclusion. The dentoalveolar changes found in the present study are very similar to those reported by Malta et al.15
As an additional result (not shown in the tables), no significant changes in the inclination of the lower incisors were recorded either in the short or in the long term when analyzing the subjects treated with the Bionator vs those treated with Activator. Consequently, the presence of absence of the coverage of the lower incisors did not affect significantly their inclination.
The second part of this study analyzed the long-term effects of functional appliances as a function of treatment timing. A previous study by Faltin et al.6
evaluated differences in the dentoskeletal response of patients treated before or during the peak in mandibular growth with the Bionator appliance followed by fixed appliances. The major limitation of the study by Faltin et al.6
was the small number of subjects who were included either in the ETG (13 subjects) or in the LTG (10 subjects). Hansen et al.4
compared the long-term dentoskeletal changes induced by the Herbst appliance
before, at, and just after the peak height velocity. The limitations of the study by Hansen et al.4
were that the authors analyzed the specific effects of Herbst treat-ment without an appraisal of comprehensive treattreat-ment of the malocclusion with fixed appliances; moreover, treatment duration with the Herbst appliance was too short (7 months of active treatment on average) to allow for the newly formed bone in the condyle and in the glenoid fossa to mature into more stable bone.20
Treatment of Class II malocclusion with functional appliances during the pubertal peak is able to produce significantly greater increases in total mandibular length and mandibular ramus height associated with a significant advancement of the bony chin when compared with treatment before puberty. These favorable mandibular changes reached both a statis-tically significant and clinically significant level in both the short term and the long term (about 3 to 5 mm). Treatment at puberty also is characterized by a greater correction of overjet and sagittal molar relationship with respect to treatment before puberty, in both the short term and the long term (about 2–2.5 mm).
The results of the current study confirmed that treatment with a functional appliance that includes the
Table 5. Descriptive Statistics and Statistical Comparisons for the Early- vs Late-Treatment Groups at the Three Observation Intervalsa
Cephalometric Measures
Early-Treatment Group Late-Treatment Group Statistical Comparisons T1–T2 (E1; n 5 20) T2–T3 (E2; n 5 20) T1–T3 (E3; n 5 20) T1–T2 (L1; n 5 20) T2–T3 (L2; n 5 20) T1–T3 (L3; n 5 20)
(ANOVA and Tukey’s Post Hoc Test) Mean SD Mean SD Mean SD Mean SD Mean SD Mean SD E1 vs L1 E2 vs L2 E3 vs L3 Skeletal sagittal Pt A to Nasion perp, mm 20.8 2.7 0.8 3.4 0.0 3.3 20.8 1.8 20.2 2.7 21.0 4.0 ns ns ns Co-A, mm 2.9 2.2 5.4 2.9 8.3 2.9 5.3 2.8 4.7 2.1 10.0 3.4 ns ns ns Pg to Nasion perp, mm 20.3 3.9 3.1 5.1 3.1 2.9 4.2 2.9 2.8 2.6 7.0 2.7 4.5** 20.3ns 3.9** Co-Gn, mm 5.8 2.7 11.4 3.5 17.0 3.8 11.4 5.3 9.8 4.9 21.3 4.3 5.5** 21.5ns 4.3* WITS, mm 22.1 2.7 0.9 3.6 21.2 2.8 22.4 3.2 0.8 3.8 21.6 4.0 ns ns ns Max.-mand. differential, mm 3.4 2.4 5.8 2.4 9.0 3.3 6.5 3.7 4.8 3.6 11.2 3.3 3.1* 21.0ns 2.3ns Skeletal vertical FH to palatal plane,u 1.8 3.3 21.1 2.8 0.8 2.6 1.0 2.4 0.3 2.7 1.3 3.5 ns ns ns FH to mandibular plane,u 1.2 2.4 23.3 2.7 22.1 2.8 0.3 2.6 22.1 2.3 21.8 3.8 ns ns ns Palatal pl. to mandibular pl.,u 20.6 2.2 22.2 3.1 22.8 3.2 20.7 2.6 22.4 2.4 23.2 3.3 ns ns ns ANS to Me, mm 3.4 1.9 5.6 3.4 9.0 3.1 5.9 3.5 3.9 3.4 9.8 2.3 ns ns ns Co-Go, mm 2.4 1.6 8.4 3.7 10.5 3.6 7.2 3.2 6.4 3.9 13.6 3.0 4.8** 22.0ns 3.1* CoGoMe,u 20.4 2.5 22.7 3.0 23.1 3.5 0.6 2.9 22.9 2.5 22.3 3.1 ns ns ns Dentoalveolar Overjet, mm 22.2 1.8 21.1 1.2 23.3 2.1 24.5 2.1 20.4 1.4 24.9 2.4 22.4** 0.7ns 21.7ns Overbite, mm 21.0 1.7 20.9 1.2 21.9 1.8 22.1 2.2 0.4 1.7 21.7 1.7 ns ns ns Interincisal angle,u 5.6 8.1 23.9 8.3 1.7 10.0 5.7 6.9 0.9 8.8 6.7 9.0 ns ns ns Molar relationship, mm 1.9 1.9 0.1 2.1 2.0 1.3 4.0 2.4 0.0 1.7 3.9 2.1 2.1* 20.1ns 1.9* U1 to Pt A vertical, mm 21.0 1.6 0.8 1.4 20.3 1.7 21.3 2.1 0.5 1.7 20.7 1.9 ns ns ns U1 to FH,u 26.0 5.4 5.5 5.3 20.5 8.0 26.3 6.5 0.4 5.8 25.9 8.2 ns ns ns L1 to Pt A-Pogonion, mm 1.4 1.6 0.4 1.2 1.8 2.0 2.5 1.9 0.0 1.9 2.5 1.8 ns ns ns L1 to mandibular plane,u 20.7 4.3 1.7 4.7 0.9 5.2 0.3 3.9 0.7 7.0 1.0 7.8 ns ns ns
ans indicates not significant.
peak in mandibular growth appears to be more effective than treatment performed before the peak, as it induces more favorable mandibular skeletal modifications.2–6 The present investigation showed
that the favorable mandibular modifications induced by pubertal vs prepubertal treatment are stable in the long term.
CONCLUSIONS
Treatment of Class II malocclusion with functional appliances followed by fixed appliances produced the following:
N A significant long-term elongation of the mandible over the controls associated with improvements in the skeletal sagittal intermaxillary relationship, the overjet, and sagittal molar relationship.
N A significant reduction of the overbite associated with an increase in lower anterior facial height and mandibular ramus height.
N Significantly greater increases during the pubertal peak in total mandibular length and mandibular ramus height associated with a significant advance-ment of the bony chin when compared with treatadvance-ment before puberty.
REFERENCES
1. McNamara JA Jr, Bookstein FL, Shaughnessy TG. Skeletal and dental changes following functional regulator therapy on Class II patients.Am J Orthod. 1985;88:91–110.
2. Ha¨gg U, Pancherz H. Dentofacial orthopaedics in relation to chronological age, growth period and skeletal development: an analysis of 72 male patients with Class II, division 1 malocclusion treated with the Herbst appliance.Eur J Orthod. 1988;10:169–176.
3. Petrovic A, Stutzmann J, Lavergne J. Mechanism of craniofacial growth and modus operandi of functional appliances: a cell-level and cybernetic approach to ortho-dontic decision making. In: Carlson DS, ed. Craniofacial Growth Theory and Orthodontic Treatment. Ann Arbor, Mich: Center for Human Growth and Development, The University of Michigan; 1990.
4. Hansen K, Pancherz H, Ha¨gg U. Long-term effects of the Herbst appliance in relation to the treatment growth period: a cephalometric study.Eur J Orthod. 1991;13:471–481.
5. Baccetti T, Franchi L, Toth LR, McNamara JA Jr. Treatment timing for twin block therapy. Am J Orthod Dentofacial Orthop. 2000;118:159–170.
6. Faltin K Jr, Faltin RM, Baccetti T, Franchi L, Ghiozzi B, McNamara JA Jr. Long-term effectiveness and treatment timing for Bionator therapy.Angle Orthod. 2003;73:221–230. 7. Tulloch JF, Phillips C, Koch G, Proffit WR. The effect of early intervention on skeletal pattern in Class II malocclusion: a randomized clinical trial.Am J Orthod Dentofacial Orthop. 1997;111:391–400.
8. O’Brien K, Wright J, Conboy F, et al. Effectiveness of early orthodontic treatment with the Twin-block appliance: a multicenter, randomized, controlled trial. Part 1: dental and skeletal effects.Am J Orthod Dentofacial Orthop. 2003;124: 234–243.
9. Marsico E, Gatto E, Burrascano M, Matarese G, Cordasco G. Effectiveness of orthodontic treatment with functional
appliances on mandibular growth in the short-term. Am
J Orthod Dentofacial Orthop. 2011;139:24–36.
10. Baccetti T, McNamara JA Jr. The impact of functional jaw orthopedics in subjects with unfavorable Class II skeletal patterns.Prog Orthod. 2010;11:118–126.
11. DeVincenzo JP. Changes in mandibular length before, during, and after successful orthopedic correction of Class II malocclusions, using a functional appliance.Am J Orthod Dentofacial Orthop. 1991;99:241–257.
12. Hansen K, Pancherz H. Long-term effects of Herbst treatment in relation to normal growth development: a cephalometric study.Eur J Orthod. 1992;14:285–295. 13. Rudzki-Janson I, Noachtar R. Functional appliance therapy
with the Bionator.Semin Orthod. 1998;4:33–45.
14. Freeman DC, McNamara JA Jr, Baccetti T, Franchi L, Fra¨ nkel C. Long-term treatment effects of the FR-2 appliance of Fra¨nkel.Am J Orthod Dentofacial Orthop. 2009;135:570.e1–6. 15. Malta LA, Baccetti T, Franchi L, Faltin K Jr, McNamara JA Jr. Long-term dentoskeletal effects and facial profile changes induced by Bionator therapy.Angle Orthod. 2010;80:10–17.
16. Broadbent BH Sr, Broadbent BH Jr, Golden WH. Bolton
Standards of Dentofacial Developmental Growth. St Louis, Mo: CV Mosby; 1975.
17. McNamara JA Jr, Brudon WL.Orthodontics and Dentofacial Orthopedics. Ann Arbor, Mich: Needham Press; 2001. 18. Cozza P, De Toffol L, Iacopini L. An analysis of the
corrective contribution in activator treatment.Angle Orthod. 2004;74:741–748.
19. Baccetti T, Franchi L, McNamara JA Jr. The cervical vertebral maturation (CVM) method for the assessment of optimal treatment timing in dentofacial orthopedics.Semin Orthod. 2005;11:119–129.
20. Chayanupatkul A, Rabie AB, Ha¨gg U. Temporomandibular response to early and late removal of bite-jumping devices. Eur J Orthod. 2003;25:465–470.