Alma Mater Studiorum – Università di Bologna
DOTTORATO DI RICERCA IN
Biologia cellulare e molecolare
Ciclo XXXI
Settore Concorsuale: 05/E2 – Biologia Molecolare
Settore Scientifico Disciplinare: BIO/11 – Biologia Molecolare
TITOLO TESI
Global analysis of immune evasion strategies in
Staphylococcus aureus clinical isolates
Presentata da: Tarcisio Brignoli
Coordinatore Dottorato
Supervisore
Chiar.mo Prof.
Chiar.mo Prof.
Giovanni Capranico
Vincenzo Scarlato
Co-Supervisore
Dott.ssa
Isabel Delany
3
Table of Contents
1 Transparency statements ... 6
2 Abstract ... 8
3 Introduction ... 10
3.1 Disease and pathology ... 10
3.2 Antibiotic resistance ... 12
3.3 Staphylococcus aureus virulence factors ... 14
3.3.1 Cell Wall Anchored proteins ... 15
3.3.2 Other surface exposed factors ... 18
3.3.3 Secreted factors ... 19
3.4 Regulation of S. aureus gene expression ... 20
3.4.1 Accessory gene regulator ... 21
3.4.2 Vancomycin resistance associated sensor-regulator ... 23
3.5 S. aureus vaccine development ... 24
4 Aims of the study ... 25
5 Results ... 26
5.1 Identification of a small subset of strains not expressing SpA ... 26
5.2 Comparative genomic analysis shows deletion in spA 5’UTR affects SpA expression in a subset of SPA- strains ... 28
5.3 Comparative transcript profiling of 84 virulence related genes in the subpanel of USA 100 strains 32 5.4 Capsule biosynthesis operon transcription is higher in SpA- strains ... 38
5.5 Absence of SpA does not influence directly cap operon transcription ... 44
5.6 Regulatory network analysis of genes with distinct transcription profiles in SpA+ and SpA -strains ……….45
5.7 Capsule gene transcription and capsule production is higher in SpA- isolates of geographically distinct origin ... 48
5.8 SpA- phenotype does not influence biofilm production ... 50
5.9 SpA- strains are susceptible to phagocytosis mediated by capsule-specific antibodies ... 51
6 Discussion ... 53
7 Materials and methods ... 58
4
7.2 Western blot analysis ... 58
7.3 Genomic DNA extraction, sequencing and assembly ... 58
7.4 spA promoter reporter system ... 59
7.5 RNA extraction and cDNA synthesis ... 60
7.6 Virulence factor transcription profile ... 60
7.7 qRT-PCR ... 61
7.8 Capsule immunoblot ... 61
7.9 Knock out strain generation ... 62
7.10 Biofilm formation test ... 63
7.11 Phagocytic uptake experiment ... 63
6
1 Transparency statements
This study was sponsored by GSK, which was involved in all stages of the study conduct and analysis. Tarcisio Brignoli is a PhD student of the University of Bologna and supervised by GSK.
We thank Isaac Thomsen and C. Buddy Creech from Vanderbilt University School of Medicine for providing the clinical isolates.
8
2 Abstract
Staphylococcus aureus is a major human pathogen, responsible for a wide range of diseases.
Its remarkable ability to develop resistance to antibiotics made S. aureus a worldwide issue in clinical medicine. One of the causes of its success as a pathogen is the peculiar array of immune evasion factors that enable the bacterium to avoid host defenses. Among these factors, the staphylococcal protein A (SpA), is thought to have a crucial role in staphylococcal immune evasion thanks to its IgG-binding activities. Indeed, SpA is able to bind the Fc region of IgG, hence preventing the recognition of the Fc by the host immune system and allowing escape from antibody-mediated neutrophil phagocytosis. Moreover SpA can also bind the VH3 domain of B cell receptors acting as a superantigen and thus leading to an impairment of the B cell response. With the intent of determining the prevalence of SpA expression in staphylococcus isolates, we screened a large panel of strains for SpA expression. Interestingly, in about 7% of the isolates, SpA was not detectable by Western blot despite the presence of the gene. Of note, the strains lacking SpA expression (SpA- strains) are mainly associated with the USA100/CC5 lineages, which are responsible for Hospital Acquired (HA) infections. The analysis of the genomes of the SpA- strains revealed that the loss of SpA expression may have more than one genetic basis, since only a subset of SpA- isolates carried a conserved mutation in the spA 5’UTR sequence. The analysis of transcript levels of more than 90 virulence factors showed a unique feature in SpA- strains, in that a higher capsule biosynthesis operon (cap operon) mRNA was identified along with lower spA transcripts. The negative correlation between spA and cap operon transcripts is shared by strains coming from distant geographic origins, thus indicating this as a common adaptation in SpA- strains. The analysis of the regulatory network controlling spA and cap operon transcription highlights how a number of factors contribute to the balance of these two virulence factors and their mutually exclusive expression. The difference in cap operon RNA levels was reflected in the amount of capsule produced, which is significantly higher in the SpA- strains. We then investigated the ability of anti-capsule antibodies to induce phagocytic uptake by neutrophils, which resulted in specific internalization only in the SpA negative background.
Capsule and SpA are both important immune evasion factors that prevent opsonophagocytosis. Given their inversely regulated expression, we hypothesize that while both implicated in protection from opsonophagocytosis, the relevance of balancing the roles
9
of SpA and capsule in immune evasion is of utmost importance in S. aureus isolates. Moreover, the expression profile of capsule and SpA among different S. aureus isolates makes them good therapies target if used in combination.
10
3 Introduction
3.1 Disease and pathology
Staphylococcus aureus (Fig.1) is a Gram-positive bacterium that colonizes the human nares
and skin [1, 2]. Despite the fact that about 30% of the population carries S. aureus asymptomatically [2], it is a frequent cause of opportunistic infections that lead to a huge variety of diseases, ranging from skin and soft tissue infection to infective endocarditis and bacteremia [3]. Of note, S. aureus is one of the leading causes of both hospital and community acquired infections [4-6]. The mortality rate of staphylococcal bacteremia in the US is approximately 2 to 10 deaths annually per 100,000 population and is higher than mortality rates of AIDS, tuberculosis and viral hepatitis, and comparable to that of breast and prostate cancer [7]. The elevated incidence of staphylococcal infections in hospital settings (above all, staphylococcal bacteremia) has been attributed to several factors, for example the breaching of the skin or the mucosa upon surgical intervention allows the pathogen to overcome the external body barrier, while its ability to form biofilm S. aureus particularly adept at infecting foreign bodies within the human host, such as vascular and urinary catheters, prosthetic cardiac valves or prosthetic joint devices [3]. The remarkable versatility of S. aureus renders it is also one of the major causes of community (CA) acquired infections, where it is able to infect otherwise healthy individuals not associated with any predisposing risk factor. CA infections are usually associated with strains with distinct genetic background from health care associated (HA) strains, and are characterized by enhanced virulence [8-10]. Besides the multiple pathology types and the different settings in which they are involved, staphylococcal infections are an increasing concern in human health because of antibiotic resistance. During the past decades indeed we witnessed the emergence of S. aureus strains resistant to vast classes of antibiotics, rendering staphylococcal infection increasingly harder to treat[11].
11
12
3.2 Antibiotic resistance
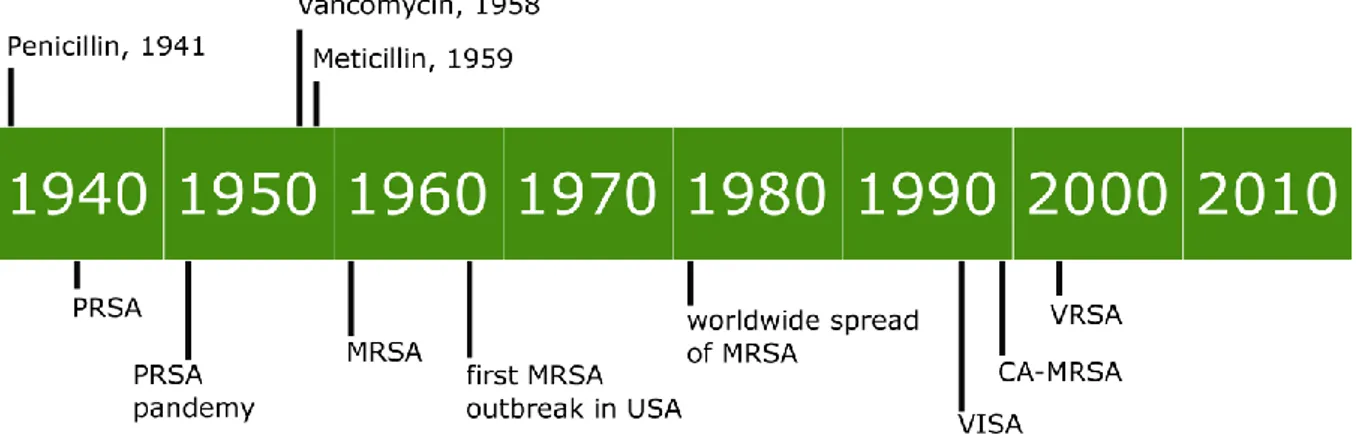
Since the introduction of penicillin in the 1940s, S. aureus has shown a remarkable ability to gain new antibiotic resistance. The emergence of new antibiotic resistant strains can be seen as series of waves (Fig.2), as result of the introduction of newly discovered antimicrobial compounds [11]. The first wave started in the mid-1940s, with the emergence of penicillin resistant S. aureus strains in USA hospitals. From the hospitals those strains rapidly spread causing community acquired infections, and by the end of 1950s they were pandemic. The mechanism of resistance was based on a plasmid encoded penicillase that lead to the inactivation of the antibiotic. The introduction of methicillin lead to the disappearance of the infections due to the most relevant penicillin resistant clone, but already in 1961 the first methicillin resistant S. aureus (MRSA) strains were identified. These first MRSA strains were limited to European hospitals with sporadic reports in USA, without spreading to the community or the rest of the world. The mechanism of this resistance was not associated with drug inactivation, but it conferred protection to a broad set of antibiotics: the entire class of β-lactam including penicillins, cephalosporins, and carbapenems. Later, the mechanism was associated with a specific gene mecA which encodes for the low affinity penicillin binding protein PBP2a. By the 1980s the infections determined by those archaic MRSA strains waned in Europe and from the late 1970s, outbreaks of MRSA strains were reported in the US and spread into the hospitals, a pandemic that continues to present times. Given the rising emergence of methicillin resistant clones, vancomycin was increasingly used as reliably antimicrobial in S. aureus infections. This selective pressure led to the emergence of two distinct mechanisms of resistance. In 1996 the first Vancomycin Intermediate Staphylococcus
aureus strain (VISA) was isolated in Japan [12]. This clone was characterized by a
vancomycin minimum inhibitory concentration of 4-8 µg ml-1 determined by an increased thickness of the cell wall able to block antibiotic molecules. The VISA strains are not associated to the acquisition of specific antibiotic resistance genes, but the phenotype is reached through a step wise process in which several mutations are accumulated in the genome, particularly in cell wall metabolism regulatory genes [13]. In 2002, shortly after the first VISA report, also vancomycin resistant strains (VRSA) emerged [14]. VRSA strains are associated to the acquisition of vanA gene, which confers resistance up to 32 µg ml-1 of
13
vancomycin. So far VISA strains are mostly associated with health care settings, while VRSA strains are extremely rare.
Almost in the same period of the emergence of VISA strains, increasing numbers of MRSA infections were reported to be community acquired (CA-MRSA) and not associated to nosocomial settings. Those strains show distinctive characteristics when compared to HA-MRSA, like a different pulsed field gel electrophoresis pattern and the susceptibility to most antibiotics other than β-lactams, indicating that their evolution occurred in a separate way. Moreover, while the HA-MRSA strains were unable to disseminate in the community setting, CA-MRSA strains disseminated also in the health care setting. The reasons for this difference reside in peculiar virulence ability and diverse pathogenesis, like the greater ability to spread by skin to skin contact [11, 15, 16]. The characterization by multilocus sequence type (MLST) and Pulsed field gel electrophoresis (PFGE) indicates that nowdays the most common lineage of HA MRSA in United states is Clonal complex 5 (ST5) and USA100 PFGE type, while the predominant CA MRSA clone belongs to Clonal complex 8 (ST8) and USA300 PFGE type.
Figure 2 Emergence of antibiotic resistance in time. The panel shows the timeline of the
introduction of new antibiotics in medical use, and the following emergence of antibiotic resistant strains. Figure adapted from Chambers et al.2009 and McGuinness et al. 2017 [11, 17]
14
3.3 Staphylococcus aureus virulence factors
The ability to act both as a commensal or a pathogen and the ability to cause different types of infection exemplifies the versatile nature of Staphylococcus aureus. One of the reasons for its success in its multi-faced physiology reside in its unique array of virulence and immune evasion factors that allows the bacterium to invade and escape host defenses (Fig.3). These include factors that help the bacterium in the different environments encountered during commensal colonization and the different stages of infection, like adhesion factors, factors able to block complement cascade, impair neutrophils chemotaxis, inhibit opsonophagocytosis and kill immune host cells [18-22]. In the complex scenario of a staphylococcal infection, it is not uncommon that the same factor is responsible for more than one function, or that the same functions are carried out by several proteins. Although the principal role of the various virulence factors may not be the same, it is interesting to note that
S. aureus employs multiple strategies to accomplish one single task. Considering this
redundancy it is likely that none of these factors is strictly necessary for virulence. In fact, infection-related clinical isolates may naturally be deficient in a range of these factors [23, 24]. Furthermore, animal model studies comparing virulence of isogenic single mutants show attenuated but not completely abolished ability to infect [25-27].
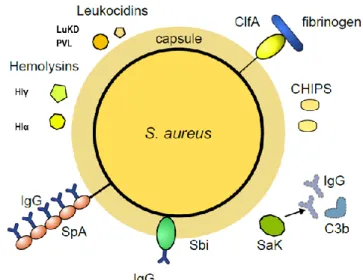
Figure 3 Schematic representation of major staphylococcal virulence factors. Staphylococcal
virulence determinants include secreted and surface attached factors, involved in adhesion, immune evasion and tissue damage. These factors often exert several functions, which are frequently redundant.
15 3.3.1 Cell Wall Anchored proteins
S. aureus can express up to 24 surface proteins covalently bound to the cell wall, known as
Cell Wall Anchored (CWA) proteins. Those proteins have secretory signals in the N terminus, which directs the precursor to the secretory system in the cell membrane, and a characteristic sorting signal containing the LPXTG motif in the C terminus, required for the anchorage to the cell wall. The CWA family can be divided in several major groups of proteins, based on structural and functional similarities [28]. The microbial surface component recognizing adhesive matrix molecules (MSCRAMM) is the most represented group of CWA.
Clumping factor A (ClfA) is the archetype of the MSCRAMM family, and is the major staphylococcal fibrinogen-binding protein. The ClfA N-terminus is able to bind the γ-chain located in the C-terminus of fibrinogen, which is formed of two specular tripeptide chains connected at the N-terminus [29-31]. The same fibrinogen molecule can be bound by two ClfA molecules coming from different bacterial cells, which determines cells clumping in
vitro [31]. In vivo bacterial cells are coated with fibrinogen molecules, which impair opsonin
deposition and phagocytosis [32]. Furthermore, ClfA can bind to complement factor I, which results in the cleavage of C3b to inactive iC3b [33, 34], impairing complement cascade and complement-mediated phagocytosis[35].
Another fibrinogen binding protein that belongs to the MSCRAMM family is Clumping factor B (ClfB) [36]. Differently to ClfA, it binds to α- and β- chains of fibrinogen [37], as well as cytokeratin 10 [38]. ClfB was shown to promote adherence to human keratinocyte [39], and it has a major role S. aureus nasal carriage [40, 41]. The different role of ClfA and ClfB is underlined by their reported different expression profile in in vitro growth: where clfB is mainly transcribed in the exponential phase of growth, clfA is upregulated during stationary phase [42].
A class of CWA proteins is characterized by the presence of the Near iron transporter (NEAT) motif, which can bind hemoglobin or haem [28]. The Iron surface determinants (Isd) A,B,H proteins can harbor from one to three NEAT motifs, and are involved in iron acquisition within the host, were it is limited [43]. Haem is bound on the cellular surface and then transported in to the cytoplasm, where iron is extracted. The CWA Isd proteins have several other functions: IsdA binds several host protein including cytokeratin 10, promoting nasal
16
colonization [44], IsdB was shown to contribute to adherence and internalization by non-phagocytic human cells [45], while IsdH enhances the inactivation of C3b [46].
3.3.1.1 Staphylococcal protein A
Staphylococcal protein A (SpA) is one of the major virulence factors of Staphylococcus
aureus. SpA is a 45-60 k Da protein that can be cell wall associated or secreted [47, 48]. It is
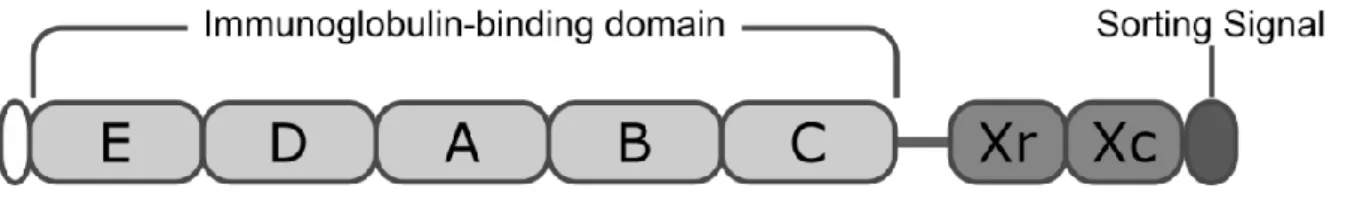
composed by three regions: the IgG binding domain in the N terminus, the X variable region and the peptidoglycan tail in the C terminus (Fig.4) [48-50]. The IgG binding region is composed normally by five homologous domains (called EABCD), each one folds into triple α helical bundles each responsible for two main binding activities, such as the Fcγ portion of human IgM, IgD and class I, II and IV IgGs[51-53], the VH3 portion of human B cell receptor [52, 54, 55], tumor necrosis factor 1[56], epithelial growth factor receptor [57] and Von Willebrand Factor [58, 59]. The X region divides the IgG binding domains from the cell surface and it is composed by an Xr variable region and the constant region Xc. The Xr region is formed by highly variable numbers of octapeptide repeats, and its sequencing can be used as typing method for staphylococcal strains [60]. The constant Xc region contains the LPXGT motif sorting signal, that is needed for cell-wall anchoring [61]. When the protein is released from cell surface it presents an attached peptidoglycan tail of variable length, which has been shown to be relevant in the immunological functions of the protein [62].
Figure 4 Schematic representation of staphylococcal protein A. In white, at the N-terminus the
signal sequence, followed by five IgG binding domains, then the repetitive Xr region and the X constant region. At the C-terminus the sorting signal.
17
SpA plays a central role in the multilayered phenomenon which is staphylococcal immune evasion, exerting several functions. The Fc binding activity allows SpA to sequester the antibodies and to display them with the wrong orientation, determining a reduced antibody dependent phagocytosis [63, 64]. The combination of Fc binding activity and the Fab binding of VH3, is thought to determine immune complexes that affect Neutrophil recruitment and complement activation [65].
Through VH3 Fab binding SpA can act also as a B cell superantigen[66], activating B cells in a non-specific manner [67]. The results of this B cell activation are not clear yet. Initial studies suggested a role in B cell apoptosis [68], while further studies showed that SpA leads to B cell expansion and antibody expression [62].
The inhibition of opsonophagocytosis and the superantigen activity of SpA are thought to be the main reasons for the poor efficacy of adaptive immune response against Staphylococcus
18 3.3.2 Other surface exposed factors
3.3.2.1 Second IgG binding protein
A second immunoglobulin-binding protein (Sbi) is a cell envelope-associated factor that can be secreted [69]. Its N-terminus portion contains two IgG binding domains that share similarity to SpA IgG binding domains, followed by two domains that bind the C3 complement component. The C-terminus part is composed of a proline-rich domain and a tyrosine threonine-rich domain that is involved in the attachment of the protein to the cell envelope. The C3 binding domain is also able to bind the factor H complement component, forming a tripartite complex with factor H and C3, leading to the consumption of C3 [70].The two binding domains confer to the protein multiple immune evasion properties, which have different relevance if the protein is secreted or attached to the cell membrane. In fact the IgG binding activity protects the bacteria when the protein is exposed on the cell surface, while the C3 binding domain preserves the pathogen when the protein is released [69]. Considering these peculiar properties, it is clear how Sbi is a unique immune evasion factor that specifically targets both innate and acquired immunity.
3.3.2.2 Capsule
Most staphylococcal clinical isolates express a thin layer of capsule, often referred to as microcapsule, composed of different serotypes. The serotype 5 and the serotype 8 account for more than the 70% of clinical isolates[71]. The cap operon is composed of 16 genes
(capA-capP) which encode for the enzymes needed for capsule synthesis [72]. A cluster of four
genes (capH-capK) gives serotype 5 or 8 specificity, while the rest of the operon shares more than the 97% of aminoacidic identity among the two serotypes [72]. The contribution of capsular polysaccharide in S. aureus virulence has been debated [73], and its relevance seems to depend on the specific strain and growth conditions [27]. In fact several external stimuli influence capsule expression, which for instance changes drastically if the strain is grown on plates or in liquid [27]. More recent works showed that the expression of either capsule 5 or 8 serotype enhances bacterial protection from opsonophagocytosis in vitro and increased virulence in vivo [27], even though with different contribution by the two serotypes [74].
19 3.3.3 Secreted factors
Among the virulence and immune evasion factors of S. aureus there is a great number of secreted molecules that exerts several functions. Staphylokinase (SAK) is a plasminogen activator that binds to host plasminogen, and mediates the cleavage of surface bound C3b and antibodies [75]. Chemotaxis inhibitory protein of S. aureus (CHIPS) is able to inhibit C5a- and fMLP-induced response in neutrophils and macrophages, impairing their recruitment to the infection site [76]. CHIPS have several homologs in S. aureus, called FPR-like 1 inhibitory proteins (FLIPr and FLIPr-like), which act inhibiting the first chemoattractants from migrating to the site of infection [77].
Killing of immune cells is a key feature in staphylococcal pathogenesis, especially relevant in abscess formation. This is achieved through the secretion of a large number of toxins, able to damage host cell membrane and eventually lysis. There are three classes of molecules able to damage host cell membrane: the pore-forming toxins, β-hemolysin and phenol soluble modulins (PSM). The pore-forming toxins are the largest family of such toxins including the α-hemolysin, the bi-component leukocidins γ-hemolysin, the Panton Valentine leucocidin (PVL), LukED and LukGH/AB. The α-hemolysin is secreted as a monomer, which assembles into a homo-heptamer on target cell surface that determines pore formation and cell lysis. In the other pore-forming toxins the formation of the pore is mediated by two different subunits named F (fast) and S (slow) based on their electrophoresis mobility. All the bi-component leukocidins share sequence homology, and their mechanism of action is thought to be similar. The two components assemble sequentially on the cell surface creating a hetero-octamer, in which the S and F subunits are alternatively disposed.
In contrast to pore forming toxins, the β-hemolysin is a neutral sphingomyelinase hydrolysing sphingomyelin, which is a plasma membrane lipid and is thought to destabilize membrane structure.
The PSM are small amphipathic peptides, divided in two sub classes based on their length: PSMα that includes γ-hemolysin, PSMα1-4 and PSM mec that have a length of 20-26 aminoacids, while the PSMβ1 PSMβ2 are 44 aminoacids long.
20
3.4 Regulation of S. aureus gene expression
The huge array of virulence factors and immune evasion systems harbored by S. aureus is not always expressed in an indiscriminate way. In fact, S. aureus colonization and infection are complex processes that need the activation of specific functions in a coordinate manner in response to determined task. The same happens in in vitro growth curves were each virulence factor has a peculiar expression profile, which reflects a specific temporal expression during the different phases of infection [78]. As a general rule, factors involved in colonization (Cell Wall Associated proteins with adhesive and tissue binding functions) are preferentially expressed during the exponential phase of an in vitro growth curve, while proteins involved in dissemination and spreading of the infection (exoproteins, proteases, toxins, haemolysins) are more likely to be expressed in the stationary phase [78]. This expression profile is the result of a highly complex and interconnected regulation that enables the pathogen to respond to external stimuli and environmental changes [79, 80]. In Staphylococcus aureus two major families of global regulators have been identified: (1) the two component signal transduction systems (TCS) and (2) the SarA homologs, a global regulator of virulence factors. The TCS family normally consists of a membrane bound sensor histidine kinase (HK) and a cytosolic response regulator that induces transcriptional responses [79]. The phosphorylation of the response regulator mediated by the histidine kinases determines conformational changes that modifies the affinity of the DNA binding domain for its target sequence [81]. This simple and general scheme of the TCS can vary in different systems, including other accessory proteins or cytosolic sensor histidine kinases. S. aureus genome encodes for 16 TCS, involved in sensing a variety of external stimuli and affecting diverse cellular processes, ranging from quorum sensing and virulence regulation (agr, SaeRS), response to antimicrobials and cell wall damage (VraSR, GraXSR, BraRS), cell wall metabolism (WalRK), autolysis (ArlRS, LytSR) and cellular metabolism (SrrAB, NreCBA, AirRS, HssSR, KdpDE, PhoRP). SarA homologs are composed of single proteins with multiple specific targets across the genome. The S. aureus genome shows the presence of eleven SarA homologs (SarA, SarR, SarS, SarT, SarU, Rot, SarX, MgrA, SarZ, SarV, SarY) [82]. Those regulators control highly interconnected regulons, in which the expression of a target gene is the result of several diverse regulations. Moreover, SarA homologs and TCS can influence each other expression, adding a further level of regulation.
21
S. aureus circulating strains can harbor different alleles of these regulators, as well as
mutations within the regulatory network, resulting in diverse expression patterns. This can influence several aspects of staphylococcal physiology, ranging from antibiotic resistance (VISA phenotype), to persistence and adaptation in human host like the Small Colony Variant phenotype (SCV) reference.
These observations point out further the importance that gene regulation has in staphylococcal pathogenesis, and its role during infections.
3.4.1 Accessory gene regulator
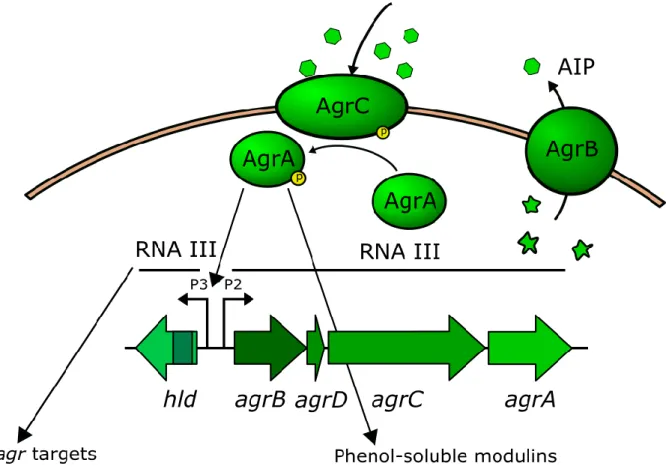
The accessory gene regulator system (agr) is the major quorum sensing system of S. aureus as well as a major global regulator controlling the expression of a wide number of virulence factors. The agr system controls the expression of more than 100 genes, determining the transition from a colonizing to an invasive phenotype in a cell density dependent manner. As general rule, it promotes transcription of secreted virulence factors (i.e. lipases, protease, PSM, haemolysins, leukocidins) and inhibits the expression of cell surface proteins involved in adhesion and aggregation (SpA, FnbA, FnbB). The agr locus encodes for two divergent transcripts, the RNAII and RNAIII, controlled by the promoters P2 and P3, respectively. The RNAII contains the coding sequences of the quorum sensing system agrBDCA. agrB encodes for a transmembrane peptidase that is involved in processing and secreting the AgrD propeptide into the active pheromone called autoinducing peptide (AIP). AgrC is the sensor kinase that undergoes transient phosphorylation after binding AIP through the extracellular sensor domain. The activation of the sensor kinase AgrC occurs only when the accumulation of AIP exceeds a concentration threshold. AgrC then transfers the phosphate group to the response regulator AgrA triggering its activity. Phosphorylated AgrA binds to the P2 promoter inducing RNAII transcription and completing the autoinducing cycle of the quorum sensing system. AgrA binds also to the P3 promoter, activating the transcription of RNAIII, which is the main effector molecule of the quorum sensing system and functions as a non-coding RNA as well as a non-coding RNA ennon-coding the hld gene. AgrA binds to P3 with lower affinity compared to P2, indicating that the argBDCA autoinduction occurs before RNAIII transcription activation. RNA III modulates the expression of most agr system target genes by interacting with their mRNA. Moreover, AgrA is able to activate transcription of α and
22
βphenol soluble modulins (PSM), binding directly to their promoters in a RNAIII independent manner. Four different types of AIP are known to date and strains can be grouped according to the AIP produced. Each AIP type is able to activate agr system only in strains belonging to the same group (Fig.5). Conversely, AIP molecules can inhibit response of agr belonging to different groups. The agr system is further tuned by direct or indirect interconnection with several other transcription factors. The most relevant regulators of agr are SarA homologs. In fact, SarA induces RNAII transcription binding directly to the P2 promoter, while SarR downregulates transcription from P2.
Figure 5. Schematic representation of the agr system. The system is encoded by two divergent
transcripts, the RNAII that comprise agrBDCA genes and RNAIII transcript. agrD encodes for the propeptide, which is secreted and matured in AIP by AgrB. The AgrC senses the AIP, and activates AgrA. AgrA induces transcription from P2 and P3 promoters, and activates transcription of α and β PSMs. RNAIII is the effector molecule that controls the expression of agr system targets
23
3.4.2 Vancomycin resistance associated sensor-regulator
The vancomycin resistance associated sensor-regulator (vraSR) TCS was firstly described as upregulated in Vancomycin Intermediate Staphylococcus aureus strains (VISA) [83]. VraS is the sensor HK that is composed by an N-terminal transmembrane domain and a C-terminal HK domain, while VraR is the response regulator of the system. The vraRS system is encoded downstream of a transcript containing other two genes of unclear function vraU and vraT (previously named yvqF). VraS responds to cell-wall affecting antimicrobials like glycopeptides, β-lactams, bacitracins by autophosphorylation and subsequent phosphorylation of VraR. VraR induces vra operon (vraUTRS) transcription and presumably controls the transcription of vra stimulon. It has been proposed that VraT is the actual sensor that interacts with VraS, influencing its autophosphorylation [84], while VraU role remains unknown to date. Mutations in this TCS can modulate (either increasing or diminishing) vancomycin resistance, as well as other antimicrobials. The broad spectrum of the stimulating agents suggests that the vraSR(T) senses cell wall damage and its activation determines the expression of cell wall biosynthesis enzymes that increase cell wall thickness.
24
3.5 S. aureus vaccine development
Considering the great burden of staphylococcal infections, and the remarkable ability to overcome antibiotic treatment by this pathogen, a vaccine against S. aureus would have an extremely beneficial impact on public health. Several attempts have been made for the development of a S. aureus vaccine, with different antigen composition [85-87], but only two have progressed to phase III clinical trials [88]. Merck’s V710, based on surface protein IsdB showed safety concerns in phase III trial [89], despite being protective in murine model and inducing of high antibody titers in rhesus macaque. NABI’s StaphVAX, composed by the capsular polysaccharide 5 and 8 coupled with a carrier protein, failed to meet the primary end point in two phase III clinical trials [90, 91].
Several reasons behind this failure have been proposed [88, 92], but it is worth considering that so far both strategies are based on single antigen vaccines approaches. Given the redundancy and complexity of S. aureus pathogenesis, a multicomponent strategy may be more successful and other vaccines formulations in earlier stages of development include multivalent approaches. Despite the failures obtained so far, S. aureus vaccine research programs are still active [86-88].
In recent years, SpA has been proposed as a promising vaccine candidate, showing efficacy in both passive and active immunization in animal models [64, 93-95]. A mutation within the IgG binding domains lead to the creation of a stable form of the protein void of ability to bind antibodies, named SpAKKAA [96]. Vaccination with this mutated protein in mouse elicited higher SpA specific antibodies and an increase of the IgG titers against other staphylococcal antigens after challenge with MRSA epidemic strain [96]. Moreover, vaccination with the SpAKKAA showed protection after challenge with different staphylococcal strains [96]. Passive immunization of mice with monoclonal antibodies was able to protect against MRSA and MSSA strains [93]. A later study demonstrated that immunization of mice with non-toxigenic SpA reduces nasal carriage rates in susceptible murine strains [97]. Similar results were obtained in guinea pig model, were the VH3 fraction in B cell population resemble human physiology whereas in mice is lower [94].
25
4 Aims of the study
Given the central role of SpA in staphylococcal pathogenesis and the raising interest in SpA as potential vaccine antigen, we aimed at understanding the prevalence of SpA expression in staphylococcal isolates. To do so, we set out to screen a large collection of strains for the expression of this virulence factor. We identified a subset of strains carrying the gene but void of expression to detectable levels of SpA (SpA- strains). We investigated if the absence of SpA could be associated with genetic polymorphisms common to the SpA- subset of strains and whether other changes in the virulence factor expression profile are associated with the SpA- phenotype. The hypotheses are: 1) the lack of a major staphylococcal immune evasion system such as SpA may be complemented with upregulation of another factor with a redundant function, and 2) a regulatory effect altering SpA expression may also drive other changes in the regulatory network of additional virulence factor gene expression. We verified these hypotheses by investigating the expression dynamics of a large number of virulence factors during in vitro growth curves using a high throughput qRT PCR approach.
On identifying other genes that exhibit significant alteration in their transcription profiles we characterized the phenotypic differences other than SpA expression that are exhibited in the SpA- and SpA+ groups of test strains.
To understand the regulatory circuitry that may be involved in the phenotypic observations, we mapped the regulatory networks that exert control on the identified genes with altered expression.
The study of the expression interplays among the most significant immune evasion systems will give a deeper insight on staphylococcal pathogenesis and support to the design of new therapies against this important human pathogen.
26
5 Results
5.1 Identification of a small subset of strains not expressing SpA
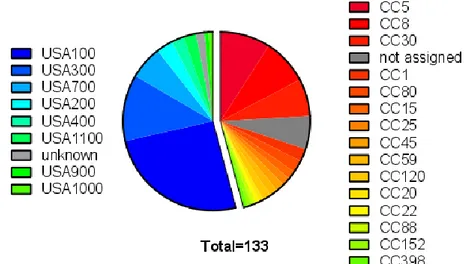
Our first aim was to evaluate the presence of the spA gene and its expression in our collection of S. aureus strains. The collection was composed of 133 strains with different origins and different typing systems. In particular 72 isolates were collected in Vanderbilt University Medical Center (US) between 2005 and 2015 and were characterized according to the Pulse Field Gel Electrophoration typing (PFGE typing)[98], while the remaining 61 strains, including well characterized lab strains such as Newman, were collected from different locations and typed by Multilocus Sequence Typing (MLST) (Fig.6).
The Vanderbilt subset was composed of 10 different PFGE types: USA100 (33 isolates), USA300 (16 isolates) USA400 (14 isolates), USA700 (8 isolates), USA200 (4 isolates), USA400 (3 isolates), USA1100 (3 isolates), USA 500 (2 isolates), USA1000, USA800, USA 900 (1 isolate each), plus 2 isolates with uncertain typing.
The remaining collection included strains belonging to 15 different clonal complexes (CCs) and 28 unique genotypes (STs) (Fig.6). The largest portion of the subset typed by MLST was composed of CC30 (9 isolates, STs 30-34-36), CC8 (10isolates, STs 8-239-250-254) and CC5 (12 isolates, STs 5-228), while the rest of the CCs were represented by less than 4 isolates.
Figure 6. Lineages in the S. aureus collection. The collection is divided in two main subsets
according to the typing method used. The strains from the Vanderbilt subset were characterized by PFG electrophoration, the other by MLST. The majority of the strains belongs to USA100/CC5 and USA300/CC8 lineages.
27
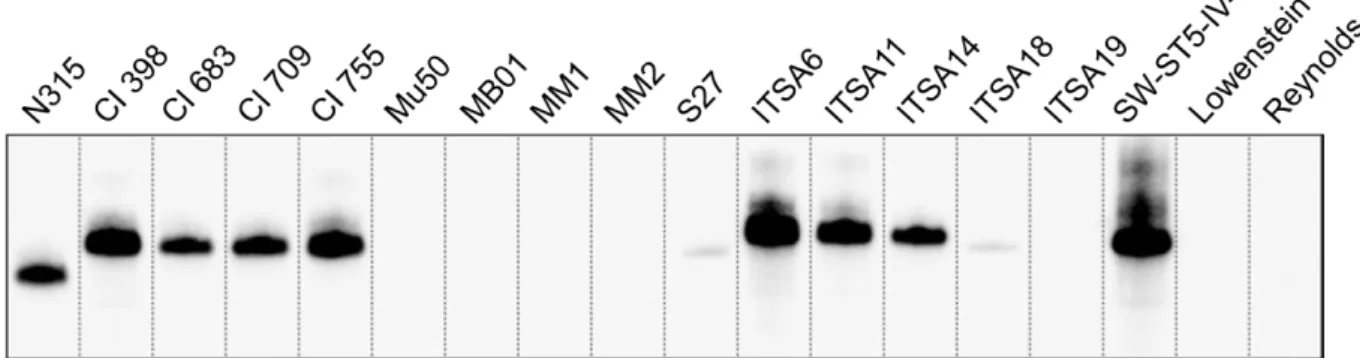
The collection was tested by PCR for the presence of the spA gene, and by Western blot for the expression of the SpA protein. Although all the strains carried the spA locus (data not shown), nine of them resulted negative by Western blot analysis (Fig.7). The SpA negative (SpA- ) strains included the Mu50 strain [12], four USA100 strains (MB01, MM1, MM2, S27), two CC5 isolates from Italy (ITSA18, ITSA19) and two laboratory strains belonging to CC25, Lowenstein [99] and Reynolds [100]. To further investigate the reasons of the loss of SpA expression in the above-mentioned isolates, an equal number of strains were chosen as representatives of the SpA+ group. In particular, N315 strain [101], four USA100 and four CC5 strains were selected.
N315 and Mu50 are well characterized strains, isolated in Japan in 1982 and 1998 respectively [12]. These two strains were previously sequenced and compared, showing 96% of sequence identity [101] and both belong to USA100 lineage [98, 102]. Given their well-established characterization, Mu50 and N315 were chosen as representatives for the SpA- and SpA+ group respectively.
Figure 7. SpA expression in a representative panel of strains. Western blot analysis on the SpA
-strains and the representative panel of SpA+ strains. Samples were taken from exponential phase of in
28
5.2 Comparative genomic analysis shows deletion in spA 5’UTR affects
SpA expression in a subset of SPA
-strains
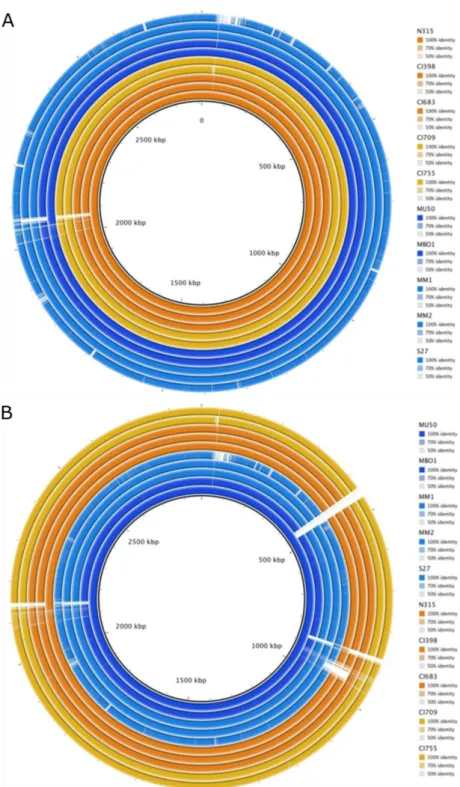
After the identification of the SpA- phenotype, we investigated the possible reasons for the loss of SpA expression. In particular, we investigated if at the level of genome sequence we could identify the genetic basis for the SpA- phenotype that could be shared by the different SpA- strains. For this purpose, we analyzed the genomes of the ten USA100 strains (five SpA+ and five SpA-), including N315 and Mu50. Comparative genomics analysis was performed using either N315 or Mu50 as reference, to find possible insertions or deletions in the genomes of SpA- strains.
The analysis showed that all the strains shared high sequence identity if compared to N315 (Fig.8A). As expected, Mu50 resulted with higher similarity to the N315 genome, while S27 is the isolate that carried the highest number of mutations. Most of the identified mutations are harbored in all the USA isolates, supporting that they are not responsible for the phenotype.
Similar results were obtained using Mu50 as reference (Fig.8B). This analysis revealed a higher number of gaps in the other genome sequences, indicating several regions that are present only in the Mu50 strain. Moreover, the distribution of these mutations is more heterogeneous, as some of them are not carried by all the strains. Anyway, also in this case the same mutations are harbored in strains coming from both groups. As already reported, N315 showed a deletion in the coding sequence of arlR/S, a two component system known to be also a repressor of spA [103]. It was not possible to identify a single mutation carried by all the SpA- strains and not present in any of the SpA+. However, three of the SpA- strains (MB01, MM1, MM2) showed a deletion of eight nucleotides, six nucleotides upstream the
29
Figure 8. Comparative genomic analysis using N315 or Mu50 as reference. The figure shows the
genetic identity between the USA100 strains and the reference strains N315 and Mu50. The SpA+ strains are depicted in orange, while the SpA- strains in blue. The color scale is different for each strain. White gaps show regions present in the reference strain but absent in the analyzed genomes. The inner circle represents the reference strains. (A) Genomic comparison using N315 as reference. (B) Genomic comparison using Mu50 as reference.
30
The sequence corresponding to the deletion (CAGGGGGT) and its position make it likely to contain a Ribosome Binding Site (RBS) sequence for the spA gene.
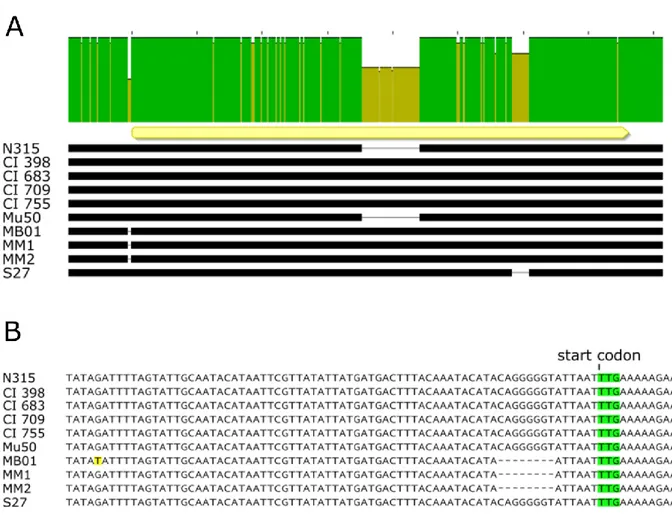
Further analysis on the spA locus showed additional differences among the isolates (Fig.9). The spA gene in the Mu50 and N315 strain carried a deletion of 174 nucleotides that causes the expression of a shorter SpA protein that lacks the last IgG binding domain, as already shown in the Western blot (Fig.7). Moreover, S27 isolate carries several SNPs across the sequence, including the promoter, as well as a shorter X variable region. Most of these mutations are silent, and none of these is responsible for an early stop codon.
Figure 9. Alignment of spA locus in the USA100 subset of strains . (A) Alignment of the spA locus
of the ten strains analyzed. The upper bar highlights the sequence identity of the spA locus. The yellow arrow shows the position of spA coding sequence, and its orientation. The black bars represent the sequence in each strain and gaps correspond to deletions. (B) Magnification of the region upstream the coding sequence of spA. The start codon is highlighted in greenand the mismatch present in the MB01 sequence is highlighted in yellow. The dashed gaps underline the deletion present in the 5’UTR region of spA gene in MB01, MM1 and MM2 strains.
31
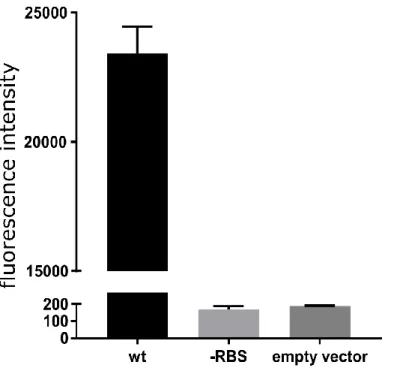
In order to investigate whether the deletion found in three of the SpA- strain could be responsible for their SpA- phenotype, we generated two translational fusions of the spA promoter and the 5’UTR region to a mCherry reporter with or without the deletion (Fig.10). While expression of the reporter was detected when the N315 spA gene upstream sequence was fused to mCherry, fusion of the sequence containing the deletion resulted in no fluorescence signal. This suggests that the mutation containing the RBS region may be responsible for abolishing SpA expression in the three identified strains. This genomic analysis showed that the genetic reasons for SpA- phenotype are probably different among the different strains, however for the MB01, MM1 and MM2 strains the loss of SpA expression is caused by a mutation in spA untranslated region.
Figure 10. Effect of the 5’ UTR mutation on reporter production. The graph shows the fluorescence signal
obtained from overnight growth of E.coli transformed with pOS1 plasmid containing either the wt spA promoter, or carrying the RBS mutation fused to mCherry reporter gene. The empty vector control shows the signal from
E.coli strain transformed with pOS1 backbone. The graph represents three independent experiments from
32
5.3 Comparative transcript profiling of 84 virulence related genes in the
subpanel of USA 100 strains
Our genomic analysis showed that the genetic reasons for the SpA- phenotype are probably different among the different strains. For this reason, the SpA- strains were further investigated using a high-throughput qRT PCR approach to analyze the transcripts of virulence related genes. A panel of 84 TaqMan assays of selected virulence related genes, was used together with the HD Biomark microfluidics system were used to perform comparative transcription profiling. The panel of genes has been previously selected (Haag et al., manuscript in preparation) to cover diverse factors expressed in different stages of staphylococcal infection process, including adhesion, invasion and immune evasion. It is known that virulence genes exhibit in vitro growth phase regulation [78], therefore the transcriptional profiling was performed by measuring the transcript levels of the 84 virulence-related genes at five representative time points (early, mid and late exponential phase, early and late stationary phase) of the in vitro growth curve. The Heatmap in Fig. 11 shows the transcription kinetics of the selected genes in all the strains tested. Several assays were not able to detect any target transcript in S27 isolate, probably because of the high rate of mismatch between the probes and the targets sequences. All the genes were then clustered according to their transcription profiles through the growth and among the isolates. The majority of the genes expression is increased with respect to early log phase (0,5 OD) indicated by the yellow predominance in the heatmap. There are four main clusters representing different transcript kinetic profile. Cluster 1 comprises the genes whose transcription decreases during the growth like clfB and fnbB that are known to be upregulated in exponential phase (Fig.12) [42]. Cluster 2 includes the genes which are upregulated in mid-exponential phase and then downregulated in stationary phase. This second cluster contains the isdA isdB, isdC and isdG genes, which are involved in iron metabolism and are part of the iron-regulated surface determinant pathway (Isd). sirA, an iron-regulated lipoprotein involved in iron metabolism, is also included in this cluster [104]. The genes comprised in cluster 3 are highly upregulated as the growth progress (Fig12). As expected, this cluster includes genes involved in the quorum sensing system agr, such as agrA and hld. In particular, agrA encodes for the response regulator of the system, while hld coding sequence is located onto the RNAIII transcript, which is the RNA effector molecule of the system.
33
Figure 11. Transcript levels variation during in vitro growth curve. Each column represents one assay, while
each row corresponds to a sample. Values are normalized to the first growth point (early stationary phase, OD0,5). The genes transcribed at lower levels compared to the first growth point are depicted in blue, and in yellow genes that are up-regulated. The bars on the two sides of the heatmap represent the four major clusters: cluster1 (green), cluster 2(dark green), cluster3(yellow) cluster 4(pink).
34
Figure 12. Kinetic profiles of the four major transcription clusters. Black lines represent the mean values of
single genes and the error bars show the standard deviation among the isolates. The mean profile of the genes within the cluster is showed in pink. In cluster 4, the blue line represents the mean of the cluster in N315 strain.
35
Several genes that are known to be targets of the agr system are grouped in this cluster, like the capsule genes capA and cap5H, the alpha haemolysin hla, the gamma haemolysin (component B-C) hlgB and hlgC [105].
The genes in cluster 4 are moderately up-regulated during the growth, with the exception of the N315 where they appear down-regulated (Fig.11, Fig.12). This is particularly evident comparing the mean kinetic profile of N315 with the other strain (Fig.12, cluster 4).
The spA gene is not present in any of these major clusters, but it clusters together with sasD, their transcription increases in mid log phase and goes down during the stationary phase. However, their kinetic varies considerably among the isolates, although the transcription profile of these two genes is similar within the same strain. For example, both spA and sasD show flat curves in Mu50 and MB01 strains (Fig.11).
Focusing on spA transcription, it is clear how the variability of spA transcript in SpA- strains follows the upregulation of spA itself, which has the highest expression in the exponential phase. In Fig. 13 the spA transcription kinetic is shown in detail for each strain, considering the different relative steady state levels, and highlighting three different behaviors. Two of the strains with the RBS mutation (MM1, MM2) maintained the kinetic of expression of the SpA+ strains, even though at lower steady state in comparison with SpA+ strains. Strains MB01 (that harbor the RBS mutation) and S27 maintained only partially this profile as reflected by the flatter curve. MU50 shows a completely flat trend, with similar transcript levels across the growth. This means that some of the SpA- strains lost spA regulation during growth other than expressing lower steady state spA transcript.
The difference in transcription kinetics among the isolates was further investigated by clustering the data both by assays and by samples. Vertical colored bars in Fig.14 show that N315, Mu50 and S27 samples are grouped by strain, while the samples from the other isolates cluster according to the growth phases. This indicates that the overall differences within the growth phases of N315, Mu50 and S27 are lower than the one displayed with the other strains, whose similarity is higher within the same growth phase rather than within the same strain. In particular, mid and late exponential phases are well distinguished, while early and late stationary phases cluster together. This analysis showed that the profiles of N315, Mu50 and S27 strains are independent from the other isolates.
36
Figure 13. spA transcript profiles in all the SpA+ and SpA- strains. The black lines indicate the transcript
profile of the SpA+ strains, while the coloured ones represent the spA RNA levels in the SpA- strains. All the values are normalized to the mean of the SpA+ strains in the early exponential phase. The three strains that carry the RBS mutation are highlighted in the figure legend.
37
Figure 14. Heatmap shows the clusterization of the transcription profiles both by assays and samples.
Colored bars indicate the different clusters and the ten strains. Horizontal colored bars indicate assays clusters, as already shown in Fig.5. Vertical coloured bars represent the ten strains tested and samples clusters.
38
5.4 Capsule biosynthesis operon transcription is higher in SpA
-strains
To highlight the transcriptional differences between SpA+ and SpA- strains, we calculated the difference in gene expression between the mean RNA levels of SpA+ and SpA- strains. The genes were ranked based on their up-regulation in one or the other group and plotted in to a heatmap (Fig.15). At the two extremities of the heatmap are shown the genes that were diversely expressed in each point of the growth, i.e. genes that are always upregulated in either group. The center of the heatmap shows that some genes had time point specific differences.Figure 15. Heatmap showing the differential transcription between SpA+ and SpA- strains. The heatmap
shows the difference in transcription for all the genes tested between SpA+ and SpA- strains at each time point. The genes that are more transcribed in the SpA+ strains are depicted in yellow, while the ones that are more transcribed in the SpA- strains are depicted in blue.
39
The significance of the difference in transcription for each gene was assessed through a two-way ANOVA, as shown by the volcano plot in Fig.16. This analysis highlighted five genes that show significant difference in transcript levels, i.e. genes with a fold change higher than two and p-value lower than 0.05 among the two groups of strains. As expected the spA gene exhibits the highest upregulation in the SpA+ strains, while other two genes, sdrC and sasD, were upregulated in SpA+ strains with lower significance. Interestingly, two genes were upregulated in the SpA- strains, the capsule biosynthesis related genes capA and cap5H. These two genes belong to the capsule biosynthesis operon (Fig.17) and are the first gene of the operon (capA) and the first gene of the capsular polysaccharide type 5 specific region (cap5H). Of note, cap5H transcript was not detected in S27 isolate, indicating that it probably belongs to a different serotype.
Figure 16. Volcano plot showing genes with significant difference in transcription. Genes are displayed
according to the mean difference in transcript levels between SpA+ and SpA- strain along the entire growth, and the p value measuring the statistical significance associated. On the right, with positive mean difference, the genes that are more transcribed in the SpA+ strains, on the left, with negative mean difference, the genes that are more transcribed in the SpA- strains.
Figure 17 Schematic representation of the capsule biosynthesis operon. The arrows represent the open
reading frames. In blue are highlighted the two genes present in the transcriptional screening, capA and cap5H are highlighted in blue. The operon is composed by 16 genes, four of which are specific for the capsular polysaccharide type 5.
40
The transcriptional changes of spA, capA and cap5H genes during the growth are shown in the boxplots in Fig.18, highlighting how the difference in RNA levels between the two groups of strains is not constant, but changes during the growth.
Figure 18. Transcription trends for spA, capA and cap5H. The boxplots show the transcription of the three
genes among the SpA+ and SpA- strains; bars show the median and whiskers the maximum and minimum values. The values are normalized by the mean of the SpA+ strains at OD 0,5. The dotted line represents the SpA+ mean level in early exponential phase.
41
The analysis performed allowed the identification of genes whose transcription is different among the two groups of strains throughout the growth, however, less evident transcriptional differences could occur in single phase of the growth. To deeper understand the differences in gene regulation between SpA+ and SpA- strains, we investigated whether some of the genes had a significant difference in transcription at single growth points. In this analysis, all the genes were evaluated in each growth point separately, and the results are reported in the volcano plot in Fig.19. The spA gene resulted different in all the growth points, while capA and cap5H showed a significant difference in three and two growth phases respectively (late log phase, early and late stationary phase). All the remaining genes detected by this analysis had significantly different RNA levels only in one time point of the growth. The genes that were transcribed with significant difference throughout the growth, i.e. spA, capA, cap5H and
sdrC, showed a similar profile, with the highest upregulation in the early stationary phase
(Fig.20). The common kinetics in differential regulation makes it reasonable to address this expression profile to the same factor or combination of factors. Despite sasD was identified as one of the genes with a significant difference throughout the growth, no singular growth point was highlighted by this analysis (in early stationary phase the mean difference was 5, the p-value 0.0581). Interestingly, all the remaining genes were differentially transcribed in late stationary phase (Fig.19, Fig.20B). In particular, sarA that is a well-known regulator [105-107], was detected among them. To summarize, the comparative analysis of transcription kinetic highlighted two different groups of genes with similar profiles. The genes that showed different transcript levels in the late stationary phase have different transcript levels among SpA+ and SpA- strains only in this growth phase. Conversely, the genes that have a significant difference in RNA levels throughout the growth show the highest difference in transcription during early stationary phase.
42
Figure 19. Volcano plot showing the genes with significant difference in specific growth phases. Each dot
represents one gene in one growth point. The genes and the corresponding OD are ordered by significance: spA (OD 8; OD10; OD 4; OD 2; OD 0,5), capA (OD 8, OD4, OD 10), cap5H (OD8, OD10) sdrC (OD 8), aur, clfA,
43
Figure 20. Differential transcription kinetic of significant genes. The graphs represent the log2 of the ratio
between SpA+ and SpA- mean RNA levels, dotted lines highlights the fold two difference. (A) Differential transcription kinetic of genes with significant difference throughout the growth. (B) Differential transcription kinetic of genes with significant difference in one single growth phase.
44
5.5 Absence of SpA does not influence directly cap operon transcription
The anti-correlation between the spA and capsule transcripts, and their common localization on the cell wall, suggested that the two factors could compete for the same localization on bacterial surface. It is possible that the two factors are linked to a feedback loop regulation, in which the presence of one of the two directly inhibits the expression of the other. To investigate this hypothesis, we measured the RNA levels of capsule biosynthetic genes in a ΔspA background. Figure 21 shows capA and cap5H RNA levels in strain Newman wt and ΔspA. The transcript levels are similar in the two strains, probably slightly lower in the spA mutant. This suggests that the expression of SpA does not influence the transcription of the capsule biosynthetic genes, so their expression is probably balanced by an upstream regulatory network. The increased transcription of the capsule biosynthetic genes and the down regulation of spA could be determined by the impairment of this regulation.Figure 21. capA and cap5H RNA levels in ΔspA background. The graphs show capA and cap5H RNA levels
in five growth points of an in vitro growth curve. Newman wild type and ΔspA were used. The experiment was performed in single replicate.
45
5.6 Regulatory network analysis of genes with distinct transcription
profiles in SpA
+and SpA
-strains
Since spA and capsule expression do not interfere directly on each other transcription, we focused on the dissection of the regulatory network upstream the differentially transcribed genes, to identify factors that could be responsible for the phenotype. The genes whose deletion affects the transcription of the genes selected for transcript analysis were extracted from the SATMD Staphylococcus aureus Transcriptome Meta-Database [108]. The relevant factors for the transcription of the genes having different RNA levels in SpA+ and SpA -strains throughout the growth are shown in Fig.22. Three different types of genes can be identified in the regulatory network. Seven genes (Fig.22, group marked 1) are known to have similar regulatory activity on both group of genes upregulated by SpA+ or SpA- strains, indicating that they are unlikely involved in the SpA- phenotype. Twenty genes were shown to influence the transcription of only one of the two groups of genes differently expressed, implying that one single gene of this group cannot be responsible for SpA- phenotype. Ten of the regulators (Fig.22 group marked 2) are reported to have an opposite regulatory activity (induction or inhibition) on the genes identified as having distinct profiles in SpA+ and SpA- group of strains. This suggests that a shift in the regulatory output of one of these could result in the transcriptional difference observed in the SpA- strains. Interestingly, a relevant number of regulators whose activity is consistent with SpA- phenotype is involved in cell envelope stress signal sensing, cell wall synthesis regulation and antimicrobial resistance (vraTSR,
46
Figure 22. The regulatory network of the genes differentially transcribed between SpA+ and SpA-. The network was extracted from SATMD Staphylococcus aureus Transcriptome Meta-Database (core free). The yellow circles represent genes upregulated in SpA+ strains, the blue circles represents the genes upregulated in the SpA- strains. The dimension of the circle indicates the significance of the upregulation. Green circles represent genes, or combination of genes, whose deletions influence the transcription of the five genes of interest. The three regulators present in the assays are depicted with the same graphic representation of the differential transcribed genes. Red arrows represent a positive regulation, blue arrows negative regulation. Dotted lines represent interaction not found in the database, but in the literature. 1) Genes that influence transcription of both groups of genes, but which is not consistent with transcript analysis. 2) Genes that exert a regulation on both groups of genes and which is consistent with transcript data.
47
Knowing that sarA gene is differently transcribed during the late stationary phase, we verified whether its regulon fits with our transcript data. The network represented in Fig.23 shows the known targets of SarA that were tested in the transcriptional screening, and their differential expression between SpA+ and SpA- strains. SarA represses all the genes that have significant upregulation in the SpA+ strains, and induces those showing a significant upregulation in the SpA- strains, except for sarA itself. This is consistent with sarA upregulation in the SpA -strains. However, the majority of SarA targets (80%) do not show a significant difference in transcription in the SpA+ or SpA- strains (smaller circle in the network). This could be explained by the interference of others regulator that can impair SarA effect. Moreover, it is important to consider that the genes reported in the network are not necessarily direct targets of SarA, and overexpression of SarA alone could be not sufficient for their upregulation.
Figure 23. SarA regulon. The genes present in the screening and regulated by SarA are depicted in the figure
according the group of strain in which they are up regulated (yellow for the genes upregulated in the SpA+, blue for the genes upregulated in the SpA- strains), and the p-value of the upregulation transcription at late stationary phase (dimension of the circle). Red arrows represent positive regulation, blue arrows negative regulation. Dotted lines represent interaction not found in the database, but in the literature.
48
5.7 Capsule gene transcription and capsule production is higher in SpA
-isolates of geographically distinct origin
Having identified significant transcriptional differences in the USA100 subset of strains, we expanded the subset to include the remaining SpA- strains as well as a control SpA+ group, verified the upregulation of capA and cap5H transcripts by qRT-PCR and quantified the relative amount of capsule produced by all strains. The capA and cap5H transcripts levels were quantified at a single time point (early stationary phase) by RT-PCR. As already observed in the USA100 subset of strains, the RNA levels of both genes were significantly higher in the SpA- strains (Fig.24).
Figure 24. capA and cap5H transcript levels in SpA+ and SpA- strains. Bars indicate the medians, whiskers
the maximum and minimum values. All values are relative to the mean of SpA+ strains levels. Statistical significance is calculated with t test.
49
To quantify the amount of capsule produced by the SpA- strains, we performed a capsule immunoblot from single growth point (late stationary phase) (Fig.25).The analysis showed high variability in the amount of capsule among the different strains, although the highest quantity of capsular polysaccharide was detected in the SpA- isolates. Moreover, four of the SpA+ strains (N315, CI709, ITSA6, ITSA14) produced no detectable capsule at the time point tested, while all SpA- strains expressed capsule at detectable levels.
Figure 25. Capsule production among SpA+ and SpA- strains. Bars indicate the medians, whiskers the
maximum and minimum values. All values are relative to the mean of SpA+ strains levels. Statistical significance is calculated with t test.