O R I G I N A L R E S E A R C H
Open Access
The kinetics of
18
F-FDG in lung cancer:
compartmental models and voxel analysis
Erica Silvestri
1, Valentina Scolozzi
2, Gaia Rizzo
1, Luca Indovina
3, Marco Castellaro
1, Maria Vittoria Mattoli
2,
Paolo Graziano
4, Giuseppe Cardillo
5, Alessandra Bertoldo
1*and Maria Lucia Calcagni
2Abstract
Background: The validation of the most appropriate compartmental model that describes the kinetics of a specific tracer within a specific tissue is mandatory before estimating quantitative parameters, since the behaviour of a tracer can be different among organs and diseases, as well as between primary tumours and metastases. The aims of our study were to assess which compartmental model better describes the kinetics of18F-Fluorodeoxygluxose(18F-FDG) in primary lung cancers and in metastatic lymph nodes; to evaluate whether quantitative parameters, estimated using different innovative technologies, are different between lung cancers and lymph nodes; and to evaluate the intra-tumour inhomogeneity.
Results: Twenty-one patients (7 females; 71 ± 9.4 years) with histologically proved lung cancer, prospectively evaluated, underwent18F-FDG PET-CT for staging. Spectral analysis iterative filter (SAIF) method was used to design the most appropriate compartmental model. Among the compartmental models arranged using the number of compartments suggested by SAIF results, the best one was selected according to Akaike information criterion (AIC). Quantitative analysis was performed at the voxel level.K1,VbandKiwere estimated with three advanced methods: SAIF approach, Patlak
analysis and the selected compartmental model. Pearson’s correlation and non-parametric tests were used for statistics. SAIF showed three possible irreversible compartmental models: Tr-1R, Tr-2R and Tr-3R. According to well-known18F-FDG physiology, the structure of the compartmental models was supposed to be catenary. AIC indicated the Sokoloff’s compartmental model (3K) as the best one. Excellent correlation was found betweenKiestimated by Patlak and by SAIF
(R2= 0.97,R2= 0.94, at the global and the voxel level respectively), and betweenKiestimated by 3K and by SAIF (R2= 0.98,
R2
= 0.95, at the global and the voxel level respectively). Using the 3K model, the lymph nodes showed higher mean and standard deviation ofVbthan lung cancers (p < 0.0014, p < 0.0001 respectively) and higher standard
deviation ofK1(p < 0.005).
Conclusions: One-tissue reversible plus one-tissue irreversible compartmental model better describes the kinetics of18F-FDG in lung cancers, metastatic lymph nodes and normal lung tissues. Quantitative parameters, estimated at the voxel level applying different advanced approaches, show the inhomogeneity of neoplastic tissues. Differences in metabolic activity and in vascularization, highlighted among all cancers and within each individual cancer, confirm the wide variability in lung cancers and metastatic lymph nodes. These findings support the need of a personalization of therapeutic approaches.
* Correspondence:[email protected]
1Department of Information Engineering, University of Padova, Via G.
Gradenigo 6/B, 35131 Padova, Italy
Full list of author information is available at the end of the article
© The Author(s). 2018 Open Access This article is distributed under the terms of the Creative Commons Attribution 4.0 International License (http://creativecommons.org/licenses/by/4.0/), which permits unrestricted use, distribution, and reproduction in any medium, provided you give appropriate credit to the original author(s) and the source, provide a link to the Creative Commons license, and indicate if changes were made.
Background
18
F-Fluorodeoxygluxose positron emission-computed
to-mography (18F-FDG PET-CT) is one of the most used
diagnostic tool in oncology [1]. The quantitative parame-ters, such as Ki (the fractional uptake of 18F-FDG), K1
(the rate constant of 18F-FDG forward trans-capillary
membrane transport) and Vb (the percentage of blood
volume) are not often utilised in clinical practice although they are more reliable than semi-quantitative parameters [2–5] and provide both accurate and exhaustive descrip-tion of tissue metabolism [6]. Quantitative parameters can be estimated utilising compartmental models solved by non-linear regression methods. In particular, the classical Sokoloff’s compartmental model [7], which was primarily
validated to quantify the18F-FDG metabolism in normal
brain tissue, in brain tumours and in myocardium [8–10] provides the estimation of four parameters, including K1 andVbplus the derived parameterKi. Alternatively,Kican be obtained by using Patlak graphical analysis [11]. It has been reported that glucose metabolism, represented by
the kinetics of 18F-FDG, can be different among organs
and diseases, as well as between primary tumours and their metastases [12]. Therefore, before estimating quanti-tative parameters, it is mandatory to design and validate the most appropriate compartmental model for that spe-cific tracer within that spespe-cific tissue, rather than to apply “sic et simpliciter” a standard one. Finally, the quantitative analysis can be performed either at a global level, i.e. within the volume of interest, or at a voxel level, applying innovative technologies. Voxel analysis allows identifying the presence of intra-tumour inhomogeneity, which is one of the characteristics of the neoplastic cells. In particular, lung cancer, despite several multimodal therapeutic ap-proaches (http://globocan.iarc.fr/Pages/fact_sheets_cancer. aspx?cancer=lung), still has a poor prognosis mainly due to its intra-tumour inhomogeneity and consequently
in-homogeneous response to treatments [13]. Therefore,
from a clinical point of view, characterising the intra-tumour inhomogeneity is becoming increasingly more im-portant because it enables us to: (1) better personalise the treatment, such as a tailored radiotherapy planning target-ing specific areas within the cancer; (2) better assess the treatment response since it can be inhomogeneous; and (3) better evaluate the prognosis [14]. To our knowledge, a few attempts have been performed in identifying an ap-propriate compartmental model to describe the kinetics of 18
F-FDG in lung tissues but in an animal study [15]. And only recently, SAIF has been employed to quantify these kinetics in 5 normal subjects and 11 patients with acute lung injury [16].
The aims of our study were (1) to assess which compart-mental model better describes the kinetics of18F-FDG in primary lung cancers and in metastatic lymph nodes; (2) to evaluate whether quantitative parameters can be
different between primary lung cancers and metastatic lymph nodes; and (3) to quantitatively investigate the intra-tumour inhomogeneity.
Methods
Patients
We prospectively evaluated 21 patients (7 females, 14 males, mean age 71.0 ± 9.4 years) with histologically proved (all but one) primary lung cancer (19 non-small cell lung cancer, 1 non-Hodgkin lymphoma bronchus associated lymphoid tissue) referred from the Unit of Thoracic Surgery of San Camillo Forlanini Hospital of Rome to the PET-CT centre of the Fondazione Policlinico Universitario A. Gemelli IRCCS of Rome.
The characteristics of the patients, the anatomic site of the primary lung cancer and the histopathological data are reported in Table1. All patients underwent18F-FDG PET-CT for staging, and suspected metastatic lymph
nodes with moderate/intense 18F-FDG uptake
under-went biopsy to confirm their neoplastic nature. Overall, we analysed 23 primary lung cancers (patients no. 8 and no. 15 had two primary lung cancers) and 24 metastatic lymph nodes. Regarding the histological classification, we analysed 9 adenocarcinomas and 11 other histotypes: in one patient (no. 3), two biopsies were both not diag-nostic; in patients with two primary lung cancers (no. 8 and no. 15), it has been possible to clearly identify the histotype only in one of them. The ethical committee of Fondazione Policlinico Universitario A. Gemelli IRCCS approved the study, and all patients signed an informed consent form.
18
F-FDG PET-CT acquisition protocol and reconstruction data
All patients, fasted for at least 6 h and in normo-glycaemic conditions before they underwent dynamic PET acquisition using an integrated PET-CT scanner (3D Biograph mCT, Siemens Healthcare). An X-ray scout was carried out to precisely define the spatial range of CT acquisition, and a low-dose CT (120 kV, 90 mA) was performed over the thoracic region with a field-of-view of 21 cm. The transaxial CT matrix size was 512 × 512 (1 mm × 1 mm × 3 mm). Pa-tients were intravenously injected with 240 MBq (range 185–333 MBq, according to the body mass index) of 18
F-FDG, using an infusion pump (Tema Sinergie, model RADInject). 10 ml of18F-FDG were administered at a rate of 4.32 ml/s followed by a 10 ml saline flush. The actual dose delivered to the patient was calculated accounting for the residual activity in the infusion system. PET images were acquired in list mode over the same area defined at a low-dose CT, lasting 60 min. Dynamic PET frames were de-fined using the following protocol: 24 frames at 5 s, 12 frames at 15 s and 11 frames at 300 s. Each of the 47 frames was reconstructed with the OSEM algorithm, including
time-of-flight and UltraHD recovery with 21 subsets and 2 iterations. The transaxial PET matrix size was 256 × 256 (3.18 mm × 3.18 mm × 3 mm). After dynamic acquisi-tion, total-body PET-CT was acquired, and images were reconstructed using the protocol described above. CT images were used for attenuation correction, anatom-ical localization and fusion with PET images (Syntegra software, Siemens).
Image processing and quantification
The individual arterial input function was directly de-rived from the PET images of each patient by manually drawing a region of interest (ROI) in the centre of the
descending aorta [17]. The plasma fraction over the
blood image-derived activity was calculated assuming a constant partition coefficient of 1.136; derived from Eq. 5 in [18] assuming a lung haematocrit of 40% [19]. ROIs over primary lung cancer and metastatic lymph nodes
with 18F-FDG uptake were manually drawn on PET-CT
images. 18
F-FDG data were analysed at the voxel level using the semi-quantitative standardized uptake value (SUV)
[20] and using three different quantitative methods:
Patlak graphical analysis [11], spectral analysis with it-erative filter (SAIF) approach as proposed by Veronese
and colleagues in [21] and compartmental modelling
[22]. As one of the aims of the work was to identify the compartmental model structure that better fits the 18
F-FDG kinetics in tumours and metastatic lymph nodes, the spectral analysis approach was exploited to identify the number of compartments necessary to
de-scribe those kinetics [18]. The component of trapping
was explicitly included in the SAIF implementation as from literature it has been know that in lung18F-FDG is irreversibly trapped in the tissues within the first 60 min after injection [23] (i.e. dephosphoryllation is supposed to be negligible over the duration of measurement). In order to configure the structure of the compartmental model, once the number of reversible compartments (“equilibrating components” in [24]) has been provided by SAIF, the compartments were arranged according to physiological insight of the tracer. As previously re-ported for other outside-brain tissues such as in muscu-loskeletal tissue [25] and liver [26] (where however the underpinning physiology is different as dephosphorylla-tion is not negligible), only models with a catenary struc-ture that describe the tracer transport and consumption were considered as physiologically plausible. SAIF results in different scenarios; therefore, for each of them, a compartmental model structure was identified and fitted
Table 1 Characteristics of the patients
Patient Sex Age Anatomic site Histology
1 M 57 Left superior lobe ADC
2 M 75 Left inferior lobe NSCLC (favouring adenocarcinoma)
3 F 80 Right superior lobe Two not diagnostic biopsies
4 M 74 Middle lobe LCNEC
5 M 55 Left inferior lobe SqCC
6 M 73 Right inferior lobe NSCLC (favouring adenocarcinoma)
7 M 50 Right inferior lobe NHL
8 M 77 Right inferior lobe SqCC
9 M 80 Left superior lobe NSCLC (favouring adenocarcinoma)
10 F 73 Left superior lobe ADC acinar and solid patterns
11 M 73 Right superior lobe ADC solid pattern
12 M 70 Right superior lobe NSCLC (favouring adenocarcinoma)
13 M 73 Right Inferior Lobe ADC acinar and solid patterns
14 F 74 Right Superior Lobe ADC
15 F 76 Right superior lobe NSCLC (favouring adenocarcinoma)
16 F 72 Right inferior lobe ADC acinar and solid patterns
17 M 81 Right superior lobe ADC
18 F 86 Middle lobe ADC
19 M 74 Left inferior lobe NSCLC (favouring adenocarcinoma)
20 M 61 Left superior lobe ADC
21 F 58 Right superior lobe NSCLC (favouring adenocarcinoma)
M male, F female, ADC adenocarcinoma, NSCLC non-small cell lung carcinoma, LCNEC large cell neuroendocrine carcinoma, SqCC squamous cell carcinoma, NHL BALT non-Hodgkin Lymphoma bronchus associated lymphoid tissue
on the 18F-FDG dynamic data using a variational Bayes-ian approach as proposed by Castellaro and colleagues
[27]. The compartmental model that best describes
18
F-FDG kinetics at the voxel level within both the pri-mary lung cancer and metastatic lymph nodes was fi-nally selected by comparing the fitted models in terms of parsimony using the Akaike information criterion (AIC) [28]. Regarding the model parameters, the inflow
rate constant from blood to tissue (K1, ml/cm3
/min), the blood volume fraction (Vb, %), and the fractional
uptake of18F-FDG (Ki, ml/cm3/min) were estimated as
main outcome. As in Grecchi et al. [16], Ki estimated
by SAIF approach was chosen as the reference
param-eter for comparison with Ki estimated by Patlak
ana-lysis and Ki estimated by the selected compartmental
model.
Statistical analysis
Pearson’s correlation analysis was performed to correlate the Kivalues estimated by Patlak analysis with those es-timated by SAIF, as well as the values ofKiestimated by the compartmental model selected using AIC with those estimated by SAIF. Wilcoxon rank-sum test was em-ployed to compare SUV and quantitative parameters values between primary lung cancers (n = 23) and meta-static lymph nodes (n = 24). Significance level was set to 0.05. The non-parametric approach was used because of the non-Gaussian distribution of the data, assessed by Komolgorov-Smirnov test. Additionally, to confirm that the statistical results do not depend on outliers, we
per-formed a random cross validation test [29] and
boot-strap [30]. Statistical analysis was performed with both in-house and naïve scripts running on Matlab™R2016b (The Mathworks Inc. Natick Massachusetts, USA).
Results
In primary lung cancers, in metastatic lymph nodes and in normal lung tissues, SAIF approach showed one trap-ping component and up to three spectral lines corre-sponding to just as many reversible compartments. The model order related to these results is reported in what follows as Tr-1R, Tr-2R and Tr-3R, where Tr and R
stand respectively for trapping and reversible
compartment. Table 2 reports the percentages of
num-ber of compartments identified at the voxel level within primary lung cancers, metastatic lymph nodes and in nor-mal lung parenchyma of all patients. Among the possible compartmental models provided by SAIF, the Tr-3R oc-curred in less than 3% of voxels; hence, it was decided to not consider it for further analysis as scarcely plausible. Starting from the SAIF results (i.e. trapping plus one or two reversible compartments), two catenary models were defined, namely the 3K and the 5K model. The 3K model includes one reversible compartment followed by one
irreversible compartment: the first compartment
represents the exchanges from plasma pool to
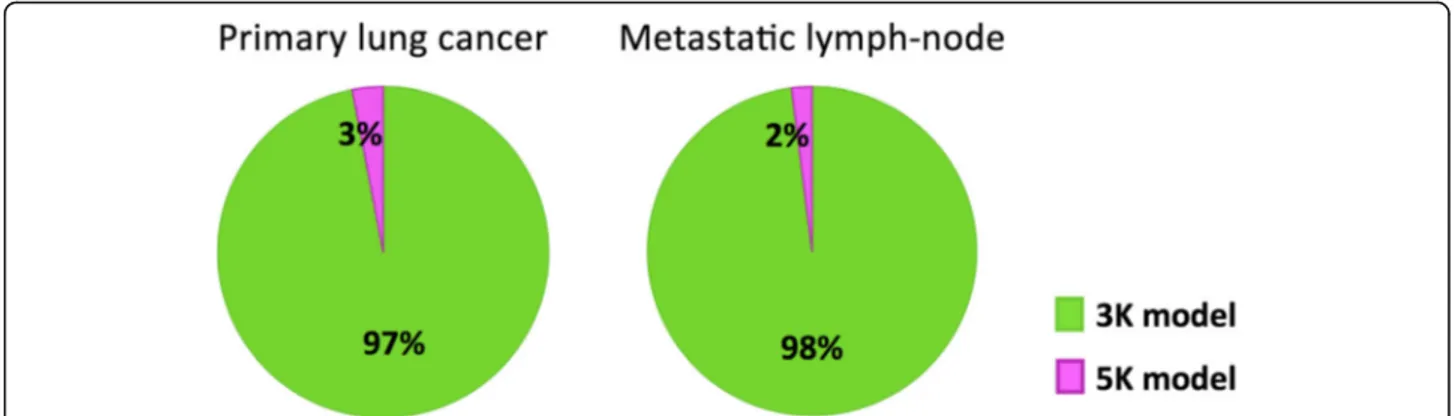
interstitial-intracellular space and back, while the irrevers-ible compartment describes the phosphorylation process. The 5K model includes two reversible compartments followed by one irreversible compartment; in this second model, the first and second compartments respectively represent the transport between plasma pool and the extracellular space and between the latter and the cell; as for 3K, phosphorylation is described by the irreversible compartment. After estimating 3K and 5K model with a variational Bayesian approach, the AIC indicated that in almost all voxels of the primary lung cancers and meta-static lymph nodes, 3K represented the best compromise between model fit and model complexity (Fig.1).
In primary lung cancers and in metastatic lymph
nodes, the correlation between Ki values estimated by
Patlak analysis with those estimated by SAIF, as well
as between Ki values estimated by 3K model with
those estimated by SAIF was high both at the global level (R2
= 0.97 and R2= 0.98, respectively) and at the voxel level (R2
= 0.94,R2= 0.95, respectively).
Figure 2 shows the mean and standard deviation values
ofKi(i.e. the18F-FDG net uptake of the tracer),K1(i.e. the 18
F-FDG transport rate from plasma to tissue, which is tightly related to the blood flow) andVb(i.e. the blood vol-ume fraction), estimated by 3K model, in both primary lung cancers (n = 23) and in metastatic lymph nodes (n = 24). Metastatic lymph nodes showed significant higher mean
and standard deviation values of Vbwhen compared with
lung cancers (p < 0.0014, p < 0.0001 respectively), as well as higher standard deviation values ofK1(p < 0.005).
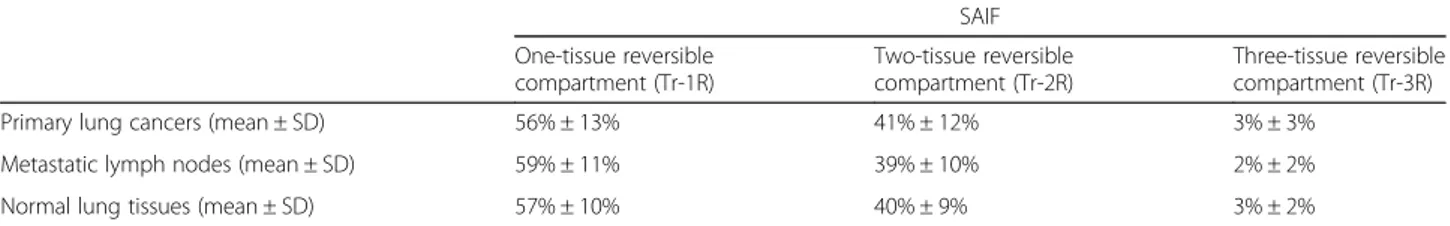
Table 2 Number of compartments that SAIF approach returned to describe the kinetics of18F-FDG. Average and standard deviation among patients of the percentages of voxels resulting from SAIF in one, two or three reversible compartments (plus trapping) are reported SAIF One-tissue reversible compartment (Tr-1R) Two-tissue reversible compartment (Tr-2R) Three-tissue reversible compartment (Tr-3R)
Primary lung cancers (mean ± SD) 56% ± 13% 41% ± 12% 3% ± 3%
Metastatic lymph nodes (mean ± SD) 59% ± 11% 39% ± 10% 2% ± 2%
Normal lung tissues (mean ± SD) 57% ± 10% 40% ± 9% 3% ± 2%
For completeness, we have also tested for differences be-tween primary lung cancers and metastatic lymph nodes in k2(i.e. 18F-FDG transport from the interstitial-intracellular space to the blood) and k3(i.e. phosphoryllation) parame-ters (results not reported in Fig. 2 for the 281 sake of
clarity), as well as in SUV, however, no statistically signifi-cant difference was found.
Figures3 and4 report respectively, in a representative
patient, the map of SUV and the parametric maps ofKi
values obtained with Patlak analysis, SAIF approach,and
Fig. 1 Pie charts of model comparison performed in primary lung cancers and in metastatic lymph nodes. In green, the percentage of voxels for which Akaike information criterion indicates the 3K compartmental model as the optimal model to fit18F-FDG data. In violet, the percentage of voxels for which the 5K compartmental model results the optimal model
Fig. 2 Comparison of quantitative parameters estimated by 3K model in primary lung cancers and metastatic lymph nodes. Box plot of mean values (top row) and standard deviation (SD, bottom row) ofKi,K1andVb, respectively, in primary lung cancers (n = 23) and metastatic lymph
nodes (n = 24). The individual values making up the box plot are shown as grey points. In the box plots, the red line indicates the median value and the edges of the box plot are the 25th and 75th percentiles, whereas the star (*) indicates statistically significant differences between the two groups (p < 0.05, Wilcoxon rank-sum test)
3K model, and the parametric maps ofK1andVbas well as the spatial distribution of SUV. The heterogeneity of 18
F-FDG-uptake distribution, influx rate constant and blood volume fraction within voxels in primary lung cancer is evident.
Discussion
This is the first paper that identifies, in oncological pa-tients, which compartmental model better describes the kinetics of18F-FDG in both primary lung cancers and in their metastatic lymph nodes. The application of a single “standard compartmental model” to different organs and/or to different diseases is not recommended. There-fore, before estimating quantitative parameters, it is im-portant to understand the behaviour of the tracer in that organ/disease and to individuate the most appropriate compartmental model to describe it. A very few authors followed this approach in animals [15].
From our data, SAIF approach performed at the voxel level showed that in primary lung cancers, metastatic lymph nodes and normal lung tissues, the kinetics of 18
F-FDG could be represented by compartmental models with three different model orders: one-tissue reversible plus one-tissue irreversible (Tr-1R), two-tissue reversible
plus one-tissue irreversible (Tr-2R) and three-tissue re-versible plus one-tissue irrere-versible (Tr-3R). Percentages
obtained in normal lung tissues reported in Table 2 are
in line with the findings of Grecchi and colleagues [16], whereas the very low percentages obtained for the Tr-3R in the tumour and metastases tissues led us to consider this configuration as scarcely plausible and to exclude it from the further compartmental modelling and model selection. According to the SAIF results and the
physio-logical knowledge on 18F-FDG transport and
consump-tion [25,26], two catenary model structures were tested: 3K and 5K. Between 3K and 5K compartmental models, AIC selected the 3K model as the best to describe the
kinetics of 18F-FDG within tumours and metastatic
lymph nodes. Differences between the percentages ob-tained with SAIF and AIC in terms of model complexity (i.e. number of spectral lines in the first case and num-ber of model parameters in the second) are somehow expected, as the mathematical framework that lies at the base of those two methods is very different. In particular, the spectral analysis approach relies on a linear de-composition of the dynamic data that employs an
overcomplete basis of the signals space [31] which
makes the decomposition not unique and could lead
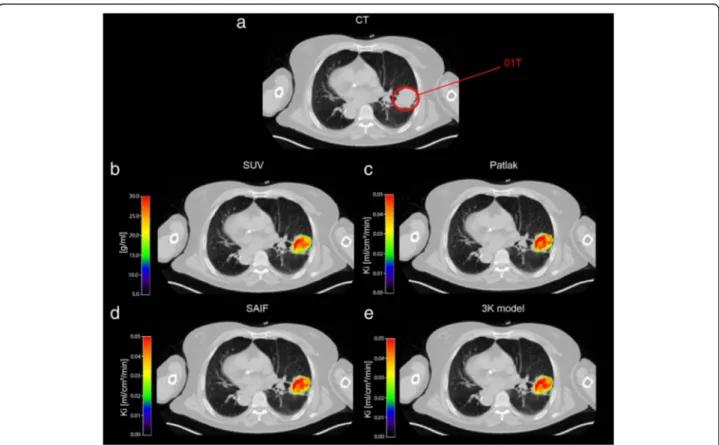
Fig. 3 Parametric maps of SUV andKiin a representative patient. Transaxial thoracic CT image: the primary lung cancer is highlighted by red
circle (a). Map of SUV within primary lung cancer over-imposed on transaxial thoracic CT image (b). Voxel-wise maps ofKiobtained with Patlak,
SAIF approach and 3K model, respectively, in primary lung cancer over-imposed on transaxial thoracic CT image (c, d and e)CT, computed tomography;SUV, standardized uptake value; Ki, the fractional uptake of
18
to an overestimation of the number of compartments necessary to describe the kinetics. Whereas, AIC is employed for the model selection in a compartmental modelling framework, where the structure of the two compared models is fixed (i.e. it has not to be esti-mated), and the selection is based on a compromise between the model complexity and the accuracy of the model prediction. Notably, the 3K is the same model validated to quantify the18
F-FDG-glucose metabolism in normal brain tissue, in brain tumours and in myo-cardium [8–10] and has the same complexity observed
in normal and inflamed lung tissue [16]. Therefore,
these findings confirm that 3K compartmental model
can be applied to analyse the kinetics of 18F-FDG in
normal lung tissue but also in lung cancer.
Regarding the quantitative parameters, excellent
cor-relation was found between Ki estimated by Patlak and
by SAIF (R2
= 0.97,R2= 0.94, at the global and the voxel
level respectively) and between Ki estimated by 3K and
by SAIF (R2
= 0.98,R2= 0.95, at the global and the voxel level respectively). Therefore, the three mathematical
methods are equally good at estimating Ki. From a
clin-ical point of view, we advise the use of Patlak graphclin-ical analysis because of its robustness and simplicity, and when it is sufficient to have only the estimation of Ki. More advanced methods, such as compartmental model-ling or SAIF, are recommended when it is important to provide a full characterisation of the tracer kinetics [6].
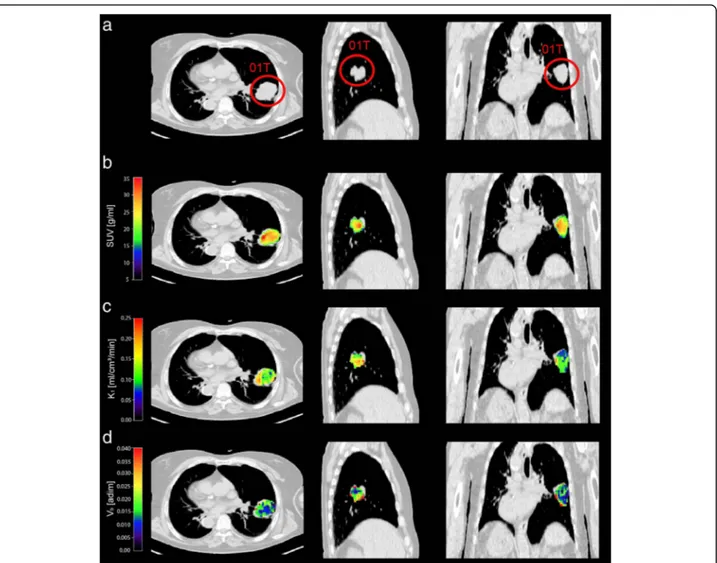
As clearly depicted in Fig.4, the quantitative parame-ters, when obtained at the voxel level with a compart-mental modelling approach, allow to better point out the intra-tumoural inhomogeneity if compared with SUV maps. It is well known that cancers are characterised by areas of higher or lower or absence functionality when
Fig. 4 Parametric maps of SUV, K1and Vbin a representative patient. Transaxial, lateral and frontal views of thoracic CT image: the primary lung
cancer is highlighted by red circle (a). Map of SUV (b) within primary lung cancer over-imposed on thoracic CT image (b). Voxel-wise parametric maps ofK1andVbobtained with 3K model in primary lung cancer over-imposed on thoracic CT image (c and d).CT, computed tomography;
compared with healthy tissues. This is due to several factors, such as cellular proliferative activity, hypoxia, necrosis, angiogenesis, gene expression, etc. [32–36]. Quantitative parameters identified at a voxel level have a potential role in several phases of the lung tumour care. In particular, the diagnostic process could benefit of a better tissues characterisation, as well as the treat-ment planning where the delivered radiation dose need to be modulated within tumour according to its
patho-physiology. Moreover, the18F-FDG absolute
quantifica-tion at the voxel level enables to assess the spatially heterogeneity of tissues which is relevant to evaluate the treatments response and to accurately estimate the patient’s prognosis [37–39].
From our data, we found that the 18F-FDG uptake
rate, the 18F-FDG consumption and the blood volume
fraction are variable among all primary lung cancers, as well as among all metastatic lymph nodes as expressed
by relatively wide range of K1, Ki, and Vb mean values
depicted in Fig. 2 (inter-cancer variability). In addition, within each individual cancer (primary or metastatic lymph node), we found inhomogeneity of functional ac-tivity with areas of faster and slower rate of18F-FDG up-take and metabolic activity, and areas heterogeneously vascularized as expressed by relatively wide range of standard deviation of all parameters evaluated (intra--cancer variability). Differences in functional activity and vascularization are expected because it is known that the behaviour of neoplastic cells is variable and depends on histotype, histological grading (inter-cancer variability), as well as on up-regulation of glucose transporters and hexo-kinase enzymes, aggressiveness, hypoxia, etc. (intra-cancer variability) [40–43]. Finally, we observed that the in-homogeneity is more evident in metastatic lymph nodes compared with primary lung cancers, as expressed by
significant higher standard deviation values of K1 and
Vb (p < 0.05 by Wilcoxon rank-sum test). This finding suggests that metastases tend to be less differentiated with a more chaotic behaviour compared with primary cancers [14, 44, 45]. The metastatic lymph nodes are characterised by higher blood volume and higher 18
F-FDG-uptake rate (even if, this latter, not significant) when compared with primary lung cancers. Further-more, these findings might be attributed to higher up-regulation of glucose transporters [46], poor differen-tiation, higher angiogenesis, faster growing and higher ag-gressiveness of the metastases compared with primary cancers [14, 44, 45]. In clinical practice, it is difficult to evaluate the intra-cancer inhomogeneity even with biopsy, which is considered the gold standard, because when the result is positive for malignancy it might be representative only of a small part of the sample. Moreover, in some cases, the result of biopsy may be not diagnostic, due to insufficient materials, or negative for malignancy because
the neoplastic cells are not included in the sample. In addition, it is almost impossible to perform biopsy of all metastatic tissues to evaluate intra-cancer inhomogeneity. The voxel-analysis has the potential to provide a more ex-tensive map of the intra-cancer inhomogeneity of all neo-plastic sites, or at least of those included in the field of view of the tomograph.
Finally, regarding SUV, we did not find any significant difference, also at voxel level, between primary lung can-cers and metastatic lymph nodes. This finding further confirms that quantitative parameters, obtained from a full dynamic study, highlight more detailed aspects of the tracer kinetics compared to SUV, obtained with a simple static acquisition.
Limitations of the study were as follows: the small sample size due to the difficulty to have surgical speci-mens of all neoplastic lesions in patients with advanced disease; and the possibility to evaluate only the medias-tinal lymph nodes included in the field of view of the tomograph.
Of note, our data were not corrected for motion pres-ence. Motion can have an impact on the assessment of model parameters. In fact, normal respiratory motion, involuntary patient motion and cardiac cyclic movement can introduce partial volume effect in the ROIs and, consequently, reduce the precision and accuracy of the estimates.
It is known that the smaller the ROI size the higher the impact on the estimates will be [47]. In our study, the smaller ROIs included in the analysis have a mini-mum size of 13.5 mm (patient no. 1). Thus, we do not expect a misinterpretation of the results due to this issue.
It is also known that motion reduces and regularises the PET intensity [47]. This decreases the power of our quantitative analysis in detecting tissues heterogeneity. In other words, it is expected that tissue heterogeneity is underestimated in our study.
However, these limitations are not strictly related to the dynamic acquisition since, these factors (i.e. normal respiratory motion, involuntary patient motion and cardiac cyclic) have an impact even on the static SUV images [48].
Conclusions
In primary lung cancers, in metastatic lymph nodes and in normal lung tissue, the kinetics of18F-FDG can be de-scribed by one-tissue reversible plus one-tissue irreversible compartmental model (3K). The quantitative parameters, especially when estimated at the voxel level using ad-vanced approaches, show the finest differences in the
kin-etics of 18F-FDG reflecting the inhomogeneity of the
neoplastic tissues. The differences in metabolic activity and in vascularisation, highlighted among all cancers and
within each individual cancer confirm the wide inter-and intra-cancer variability of primary lung cancer inter-and metastatic lymph nodes. Further studies are needed in larger and more selected oncological samples to con-firm that quantitative parameters at the voxel level are useful especially to better individualise the treatment and to evaluate both the treatment response and the prognosis. In addition, to validate the method, it would be interesting to correlate the quantitative parameters representing vascularization and metabolism with im-munohistochemical analysis.
Availability of data and materials Please contact authors for data requests. Authors’ contributions
MLC and LI were responsible for the conception and design of the study. GC was responsible for the selection of the patients. PG was involved in histological analysis. VS and MVM were involved in acquisition of PET/CT and collection of data. ES, GR and MC were responsible for data analysis and statistics. VS, MLC, LI, ES, GR and AB were involved in interpretation of data. MLC, ES, VS and AB drafted the manuscript. MVM and LI contributed to the manuscript. All authors read and approved the final manuscript.
Ethics approval and consent to participate
All procedures performed in studies involving human participants were in accordance with ethical standards of the institutional and/or national research committee and with the 1964 Helsinki Declaration and its later amendments or comparable ethical standards. The ethical committee of the Fondazione Policlinico Universitario A. Gemelli IRCCS of Rome approved the study. Consent for publication
Not applicable. Competing interests
The authors declare that they have no competing interests.
Publisher’s Note
Springer Nature remains neutral with regard to jurisdictional claims in published maps and institutional affiliations.
Author details
1
Department of Information Engineering, University of Padova, Via G. Gradenigo 6/B, 35131 Padova, Italy.2Department of Diagnostic Imaging,
Radiation Oncology and Haematology, Institute of Nuclear Medicine, Fondazione Policlinico Universitario A. Gemelli IRCCS– Università Cattolica del Sacro Cuore, Roma, Italy.3Medical Physics Unit, Fondazione Policlinico Universitario A. Gemelli IRCCS, Roma, Italy.4Unit of Pathology, Scientific
Institute for Research and Health Care“Casa Sollievo della Sofferenza”, San Giovanni Rotondo, Foggia, Italy.5Unit of Thoracic Surgery, San Camillo
Forlanini Hospital, Rome, Italy.
Received: 5 June 2018 Accepted: 9 August 2018 References
1. Sharma B, Martin A, Stanway S, Johnston SR, Constantinidou A. Imaging in oncology--over a century of advances. Nat Rev ClinOncol. 2012;https://doi. org/10.1038/nrclinonc.2012.195.
2. Kwee TC, Cheng G, Lam MG, Basu S, Alavi A. SUVmax of 2.5 should not be embraced as a magic threshold for separating benign from malignant lesions. Eur J Nucl Med Mol Imaging. 2013;https://doi.org/10.1007/s00259-013-2484-x. 3. Keyes JW Jr. SUV: standard uptake or silly useless value? J Nucl Med. 1995;
36:1836–9.
4. de Geus-Oei LF, van Krieken JH, Aliredjo RP, Krabbe PF, Frielink C, Verhagen AF, et al. Biological correlates of FDG uptake in non-small cell lung cancer. Lung Cancer. 2007;55:79–87.
5. Calcagni ML, Taralli S, Cardillo G, Graziano P, Ialongo P, Mattoli MV, et al. Diagnostic performance of (18)F-Fluorodeoxyglucose in 162 small pulmonary nodules incidentally detected in subjects without a history of malignancy. Ann Thorac Surg. 2016;https://doi.org/10.1016/j.athoracsur.2015.10.072.
6. Lammertsma AA. Forward to the past: the case for quantitative PET imaging. J Nucl Med. 2017;https://doi.org/10.2967/jnumed.116.188029. 7. Sokoloff L, Reivich M, Kennedy C, Des Rosiers MH, Patlak CS, Pettigrew KD,
et al. The [14C]deoxyglucose method for the measurement of local cerebral glucose utilization: theory, procedure, and normal values in the conscious and anesthetized albino rat. J Neurochem. 1977;28:897–916.
8. Phelps ME, Huang SC, Hoffman EJ, Selin C, Sokoloff L, Kuhl DE. Tomographic measurement of local cerebral glucose metabolic rate in humans with (F-18)2-fluoro-2-deoxy-D-glucose: validation of method. Ann Neurol. 1979;6:371–88. 9. Hawkins RA, Phelps ME, Huang SC. Effects of temporal sampling, glucose metabolic rates, and disruptions of the blood-brain barrier on the FDG model with and without a vascular compartment: studies in human brain tumors with PET. J Cereb Blood Flow Metab. 1986;6:170–83.
10. Herrero P, Sharp TL, Dence C, Haraden BM, Gropler RJ. Comparison of 1-(11)C-glucose and (18)F-FDG for quantifying myocardial glucose use with PET. J Nucl Med. 2002;43:1530–41.
11. Patlak CS, Blasberg RG, Fenstermacher JD. Graphical evaluation of blood-to-brain transfer constants from multiple-time uptake data. J Cereb Blood Flow Metab. 1983;9:1–7.
12. Chen DL, Cheriyan J, Chilvers ER, Choudhury G, Coello C, Connell M, et al. Quantification of lung PET images: challenges and opportunities. J Nucl Med. 2017;https://doi.org/10.2967/jnumed.116.184796.
13. Cook GJ, Yip C, Siddique M, Goh V, Chicklore S, Roy A, et al. Are pretreatment 18F-FDG PET tumor textural features in non-small cell lung cancer associated with response and survival after chemoradiotherapy? J Nucl Med. 2013;https://doi.org/10.2967/jnumed.112.107375.
14. Marusyk A, Polyak K. Tumor heterogeneity: causes and con sequences. Biochim Biophys Acta. 2010;https://doi.org/10.1016/j.bbcan.2009.11.002. 15. Schroeder T, Vidal Melo MF, Musch G, Harris RS, Venegas JG, Winkler T.
Modeling pulmonary kinetics of 2-deoxy-2-[18F]fluoro-D-glucose during acute lung injury. Acad Radiol. 2008;https://doi.org/10.1016/j.acra.2007.12.016. 16. Grecchi E, Veronese M, Moresco RM, Bellani G, Pesenti A, Messa C, et al.
Quantificationof dynamic [18F]FDG pet studies in acute lung injury. Mol Imaging Biol. 2016;https://doi.org/10.1007/s11307-015-0871-3.
17. de Geus-Oei LF, Visser EP, Krabbe PF, van Hoorn BA, Koenders EB, Willemsen AT, et al. Comparison of image-derived and arterial input functions for estimating the rate of glucose metabolism in therapy-monitoring 18F-FDG PET studies. J Nucl Med. 2006;47:945–9.
18. Bertoldo A, Vicini P, Sambuceti G, Lammertsma AA, Parodi O, Cobelli C. Evaluation of compartmental and spectral analysis models of [18F]-FDG
kinetics for heart and brain studies with PET. IEEE Trans Biomed Eng. 1998;
https://doi.org/10.1109/10.730437.
19. Larsen OA. The hematocrit of the lung in man. Scan J Clin Lab Invest. 1996; 18:112–8.
20. Huang S-C. Anatomy of SUV. Nucl Med Biol. 2000;27:643–6. 21. Veronese M, Bertoldo A, Bishu S, et al. A spectral analysis approach for
determination of regional rates of cerebral protein synthesis with the L-[1-11C]leucine PET method. J Cereb Blood Flow Metab. 2010;30:1460–76.
22. Carson E, Cobelli C. Modelling Methodology for Physiology and Medicine. London: Elsevier; 2014. 2nd Edition.
23. Gallagher BM, Fowler JS, Gutterson NI, MacGregor RR, Wan C, Wolf A-P. Metabolic trapping as a principle of radiopharmaceutical design: some factors responsible for the distribution of [18F] 2-Deoxy-2-Fluoro-D-Glucose. J Nucl Med. 1978;19:1154–61.
24. Veronese M, Rizzo G, Bertoldo A, Turkheimer FE. Spectral analysis of dynamic PET studies: a review of 20 years of method developments and applications. Comput Math Methods Med. 2016;2016https://doi.org/10. 1155/2016/7187541.
25. Bertoldo A, Peltoniemi P, Oikonen V, Knuuti J, Nuutila P, Cobelli C. Kinetic modeling of [18F]FDG in skeletal muscle by PET: a four-compartment five-rate-constant model. Am J Physiol Endocrinol Metab. 2001;281(3):E524–36. 26. Iozzo P, Lautamaki R, Geisler F, et al. Non-esterified fatty acids impair
insulin-mediated glucose uptake and disposition in the liver. Diabetologia. 2004; 47(7):1149–56.https://doi.org/10.1007/s00125-004-1443-2.
27. Castellaro M, Rizzo G, Tonietto M. A variational Bayesian inference method for parametric imaging of PET data. NeuroImage. 2017;https://doi.org/10. 1016/j.neuroimage.2017.02.009.
28. Akaike H. A new look at the statistical model identification. IEEE Trans Automat Contr. 1974;19(6):716–23.https://doi.org/10.1109/TAC.1974.1100705. 29. Stone M. Cross-validatory choice and assessment of statistical predictions. J.
R. Stat. Soc. Ser. B Methodol. 1974;36:111–47.
30. Efron B. Bootstrap methods: another look at the jackknife. Ann Stat. 1979;7:1–26.
31. Gunn RN, Gunn SR, Turkheimer FE, Aston JAD, Cunningham VJ. Positron emission tomography compartmental models: a basis pursuit strategy for kinetic modeling. J Cereb Blood Flow Metab. 2002;22(12):1425–39.
https://doi.org/10.1097/01.wcb.0000045042.03034.42.
32. Fidler IJ, Hart IR. Biological diversity in metastatic neoplasms: origins and implications. Science. 1982;https://doi.org/10.1126/science.7112116. 33. Dick JE. Stem cell concepts renew cancer research. Blood. 2008;
https://doi.org/10.1182/blood-2008-08-077941.
34. Nicolson GL. Generation of phenotypic diversity and progression in metastatic tumor cells. Cancer Metastasis Rev. 1984;3:25–42. 35. Heppner GH. Tumor heterogeneity. Cancer Res. 1984;44:2259–65. 36. Miwa K, Inubushi M, Wagatsuma K, Nagao M, Murata T, Koyama M, et al.
FDG uptake heterogeneity evaluated by fractal analysis improves the differential diagnosis of pulmonary nodules. Eur J Radiol. 2014;
https://doi.org/10.1016/j.ejrad.2013.12.020.
37. Rizk NP, Tang L, Adusumilli PS, Bains MS, Akhurst TJ, Ilson D, et al. Predictive value of initial PET-SUVmax in patients with locally advanced esophageal and gastroesophageal junction adenocarcinoma. J Thorac Oncol. 2009;
https://doi.org/10.1097/JTO.0b013e3181a8cebf.
38. Hoekstra CJ, Paglianiti I, Hoekstra OS, Smit EF, Postmus PE, Teule GJ, et al. Monitoring response to therapy in cancer using [18F]-2-fluoro-2-deoxy-D-glucose and positron emission tomography: an overview of different analytical methods. Eur J Nucl Med. 2000;27:731–43.
39. Katiyar P, Divine MR, Kohlhofer U, Quintanilla-Martinez L, Schölkopf B, Pichler BJ, et al. Spectral clustering predicts tumor tissue heterogeneity using dynamic 18F-FDG PET: a complement to the standard compartmental modeling approach. J Nucl Med. 2017;https://doi.org/10.2967/jnumed.116.181370. 40. Duhaylongsod FG, Lowe VJ, Patz EF Jr, Vaughn AL, Coleman RE, Wolfe WG.
Lung tumor growth correlates with glucose metabolism measured by fluoride-18 fluorodeoxyglucose positron emission tomography. Ann Thorac Surg. 1995;60:1348–52.
41. Vesselle H, Schmidt RA, Pugsley JM, Li M, Kohlmyer SG, Vallires E, et al. Lung cancer proliferation correlates with [F-18]fluorodeoxyglucose uptake by positron emission tomography. Clin Cancer Res. 2000;6:3837–44. 42. Clavo AC, Brown RS, Wahl RL. Fluorodeoxyglucose uptake in human cancer
cell lines is increased by hypoxia. J Nucl Med. 1995;36:1625–32. 43. Mamede M, Higashi T, Kitaichi M, Ishizu K, Ishimori T, Nakamoto Y, et al.
[18F]-FDG uptake and PCNA, Glut-1, and hexokinase-II expressions in cancers and inflammatory lesions of the lung. Neoplasia. 2005;7:369–79.
44. Cheng L, Bostwick DG, Li G, Wang Q, Hu N, Vortmeyer AO, et al. Allelic imbalance in the clonal evolution of prostate carcinoma. Cancer. 1999;85: 2017–22.
45. Kuukasjarvi T, Karhu R, Tanner M, Kähkönen M, Schäffer A, Nupponen N, et al. Genetic heterogeneity and clonal evolution underlying development of asynchronous metastasis in human breast cancer. Cancer Res. 1997;57: 1597–604.
46. Rocha CM, Barros AS, Goodfellow BJ, Carreira IM, Gomes A, Sousa V, et al. NMR metabolomics of human lung tumours reveals distinct metabolic signatures for adenocarcinoma and squamous cell carcinoma. Carcinogenesis. 2015;https://doi.org/10.1093/carcin/bgu226.
47. Masoomi MA, McLean AH, Bouchareb Y, Ryder W, Robinson A. Impact of PET - CT motion correction in minimising the gross tumour volume in non-small cell lung cancer. Asia Oceania J Nucl Med Biol. 2013;1(2):35–46. 48. Liu C, Pierce LA, Alessio AM, Kinahan PE. The impact of respiratory motion
on tumor quantification and delineation in static PET/CT imaging. Phys Med Biol. 2009;54(24):7345–62.https://doi.org/10.1088/0031-9155/54/24/007.