Scicchitano et al. Cancer Cell Int (2018) 18:136 https://doi.org/10.1186/s12935-018-0626-8
PRIMARY RESEARCH
Levetiracetam enhances
the temozolomide effect on glioblastoma stem
cell proliferation and apoptosis
Bianca Maria Scicchitano
1*, Silvia Sorrentino
1, Gabriella Proietti
1, Gina Lama
1, Gabriella Dobrowolny
2,
Angela Catizone
2, Elena Binda
3, Luigi Maria Larocca
4and Gigliola Sica
1Abstract
Background: Glioblastoma multiforme (GBM) is a highly aggressive brain tumor in which cancer cells with stem
cell-like features, called cancer stem cells (CSCs), were identified. Two CSC populations have been previously identified in GBM, one derived from the GBM area called enhanced lesion (GCSCs) and the other one from the brain area adjacent to the tumor margin (PCSCs) that greatly differ in their growth properties and tumor-initiating ability. To date the most effective chemotherapy to treat GBM is represented by alkylating agents such as temozolomide (TMZ), whose activity can be regulated by histone deacetylases (HDACs) inhibitors through the modulation of O6-methylguanine-DNA methyltransferase (MGMT) expression. Levetiracetam (LEV), a relatively new antiepileptic drug, modulates HDAC levels ultimately silencing MGMT, thus increasing TMZ effectiveness. However, an improvement in the therapeutic efficacy of TMZ is needed.
Methods: Cell proliferation was investigated by BrdU cell proliferation assay and by Western Blot analysis of PCNA
expression. Apoptosis was evaluated by Western Blot and Immunofluorescence analysis of the cleaved Caspase-3 expression. MGMT and HDAC4 expression was analyzed by Western Blotting and Immunofluorescence. Statistical analysis was performed using the Student’s t test and Mann–Whitney test.
Results: Here we evaluated the effect of TMZ on the proliferation rate of the IDH-wildtype GCSCs and PCSCs derived
from six patients, in comparison with the effects of other drugs such as etoposide, irinotecan and carboplatin. Our results demonstrated that TMZ was less effective compared to the other agents; hence, we verified the possibility to increase the effect of TMZ by combining it with LEV. Here we show that LEV enhances the effect of TMZ on GCSCs proliferation (being less effective on PCSCs) by decreasing MGMT expression, promoting HDAC4 nuclear translocation and activating apoptotic pathway.
Conclusions: Although further studies are needed to determine the exact mechanism by which LEV makes GBM
stem cells more sensitive to TMZ, these results suggest that the clinical therapeutic efficacy of TMZ in GBM might be enhanced by the combined treatment with LEV.
Keywords: Glioblastoma, Cancer stem cells, MGMT, Temozolomide, Levetiracetam
© The Author(s) 2018. This article is distributed under the terms of the Creative Commons Attribution 4.0 International License (http://creat iveco mmons .org/licen ses/by/4.0/), which permits unrestricted use, distribution, and reproduction in any medium, provided you give appropriate credit to the original author(s) and the source, provide a link to the Creative Commons license, and indicate if changes were made. The Creative Commons Public Domain Dedication waiver (http://creat iveco mmons .org/ publi cdoma in/zero/1.0/) applies to the data made available in this article, unless otherwise stated.
Open Access
Cancer Cell International
*Correspondence: [email protected]
1 Istituto di Istologia ed Embriologia, Università Cattolica del Sacro Cuore, Fondazione Policlinico Universitario A. Gemelli IRCCS, Roma, Italia Full list of author information is available at the end of the article
Background
Glioblastoma multiforme (GBM) is one of the most aggressive primary brain tumor. It has been demon-strated that mutations of the IDH1 gene correlate with outcome in patients with malignant glioma and are considered as independent factors for predicting longer overall survival and progression free survival in patients with GBM [1]. In GBM, cancer cells with stem cell-like features, called cancer stem cells (CSCs), were identified [2, 3]. GBM stem-like cells (GSCs) have a high capacity to resist or to adapt to standard therapies which include sur-gery followed by radiotherapy and chemotherapy [4–6], resulting in a poor prognosis with a median survival time of about 14 months [7, 8]. Thus, the development of effi-cient strategies targeting these cells is urgently needed.
It has been demonstrated that CSC distinct pools reside within different regions of the same GBM [9–11]. More recently, the presence of two GSC populations, one derived from the GBM area called enhanced lesion (GCSCs) and the other one from the brain area adjacent to the tumor margin (PCSCs) that greatly differ in their growth properties and tumor-initiating ability, was iden-tified. Indeed, GCSCs and PCSCs possess key neural stem cell features, such as multipotency, clonogenic ability and extensive self-renewal, together with aberrant growth properties [12]. Moreover, the area adjacent to the tumor shows edema, vascular alterations [13, 14], reactive astro-cytes and microglia [15, 16] in addition to an abnormal gene expression [17, 18]. It has been demonstrated that tumor recurrence occurs in tissue neighboring GBM in approximately 90% of patients, suggesting a growing rel-evance for this area in translational research [16, 19].
GSCs can be isolated from surgical specimens through mechanical dissociation of the tumor tissue and culture in a serum-free medium. In this conditions GCSC- and PCSC-derived cell clones are able to grow in vitro in aggregates called neurospheres and maintain an undif-ferentiated state as demonstrated by the expression of stem cell markers. Moreover, when injected in immuno-suppressed mice, these cells are able to generate a tumor identical to the original one in terms of antigen expres-sion and histological features, although GCSCs exhibit a higher tumor-initiating ability and clonogenicity when
compared with PCSCs [12]. For all the above, GCSCs
and PCSCs represent a good model to study glioblas-toma response to treatments and, in particular, to high-light the role of neighboring microenvironment in tumor progression. To date the most effective chemotherapies to treat GBM are alkylating agents such as Temozolo-mide (TMZ), with a good penetration into the blood–
brain barrier [20]. Alkylating agents damage DNA by
formation of different small and bulky adducts with
nucleic acid bases. In particular, TMZ acts by delivering a methyl group to purine bases of DNA leading to cell cycle arrest and, eventually, to apoptosis [21]. O6-Meth-ylguanine-DNA-methyltransferase (MGMT) repairs the most cytotoxic lesions generated by TMZ, by remov-ing the methyl adducts from DNA. MGMT promoter methylation, leading to a transcriptional silencing, cor-relates with improved survival in GBM patients exposed to alkylating agent treatment. Accordingly, expression of MGMT is one of the most robust predictors of the TMZ response in malignant glioma cells [22–24]. Epige-netic mechanisms are increasingly recognized as a major factor contributing to pathogenesis of cancer includ-ing glioblastoma. Enzymatic modification of histone proteins regulating gene expression are recently being exploited for therapeutic drug targeting. In particular, histone acetylation and deacetylation have been demon-strated to regulate several physiological and pathological cellular processes. Histone acetylation is mediated by histone acetyltransferases (HATs) and generally allows for active gene transcription. Conversely, histone dea-cetylation is catalyzed by histone deacetylases (HDACs) and favors gene repression. Eighteen distinct HDACs have been identified so far and they are classified into four classes based on their sequence and catalytic activ-ity. HDAC4 is a member of class II and it has been
dem-onstrated to be involved in progression of GBM [25].
In addition, it has been recently reported that a great number of non-histone proteins can undergo reversible acetylation by HATs and HDACs. Modifications in this dynamic equilibrium can disturb cell homeostasis and result in a pathological state [26]. Nevertheless, HDAC inhibitors cause acetylation of both histone and non-his-tone proteins and exert multiple anti-tumoral effects by inducing differentiation, apoptosis, cell cycle arrest, sus-ceptibility to chemotherapy and inhibition of migration and angiogenesis [27].
Emerging evidences demonstrate that some antie-pileptic drugs (AEDs) have a transcriptional regulatory
activity via HDAC modulation [28]. In particular, it
has been shown that Levetiracetam (LEV), a relatively new AED, increases the transcription of HDACs and recruits corepressor complex on MGMT promoter, thus silencing its activity [22].
In this work, we used the GCSC and the PCSC neu-rospheres derived from primary GBM of six patients, according to the WHO 2016 classification, and we evalu-ated the effect of several antineoplastic drugs such as TMZ, Etoposide (ETO), Irinotecan (IRI) and Carboplatin (CARB) on their proliferation. Since our results demon-strated that the chemotherapeutic agent with less efficacy was TMZ, we subsequently investigated the possibility to
Page 3 of 18 Scicchitano et al. Cancer Cell Int (2018) 18:136
increase its cytotoxic activity by the concomitant treat-ment with LEV.
Here we show that LEV enhances the effect of TMZ on GCSCs proliferation (being less effective on PCSCs) by decreasing MGMT expression, promoting HDAC4 nuclear translocation and activating apoptotic pathway. Although further studies are needed to determine the exact mechanism by which LEV sensitizes GBM stem cells to TMZ, these results suggest that the clinical ther-apeutic efficacy of TMZ in GBM might be enhanced by the combination treatment with LEV.
Materials and methods
Neurosphere culture
A total of six pairs of neurospheres derived from both GBM and peritumoral tissue (at a distance < 1 cm from macroscopic tumor border), called Glioblastoma Cancer Stem Cells (GCSCs) and Peritumoral Cancer Stem Cells (PCSCs), respectively, were kindly provided by Vescovi and Binda. According to the classification of human
gli-omas by WHO [29], we analyzed the GCSC and PCSC
neurospheres for the mutational status of IDH1 [30, 31]. Mutational IDH1/2 status and MGMT promoter methyl-ation status were also investigated in all the available tis-sue samples from which the neurospheres were derived [32].
The neurospheres were cultured in NeuroCult™ NS-A
Proliferation Kit (StemCell Technologies Inc, Vancou-ver, BC, Canada) supplemented with 20 ng/mL human recombinant EGF, 10 ng/ml human recombinant bFGF and 2 µg/mL heparin (all from StemCell Technologies Inc.), as described previously [33]. All cell cultures were maintained at 37 °C in a 5% CO2 humidified atmosphere. IDH analysis
IDH1 was amplified from 20 ng genomic DNA with forward primer 5′- ACC AAA TGG CAC CAT ACG A-3′ and reverse primer 5′- TTC ATA CCT TGC TTA ATG GGTGT-3′ using conditions described by Balss J. et al.
[34]. The resulting PCR products were sequenced using
the ABI Prism BigDye Terminator v3.1 Cycle Sequenc-ing Kit (Applied Biosystems, 4337455). Thirty cycles were performed employing 10 mM of the sense primers with denaturing at 95 °C for 10 s, annealing at 56 °C for 5 s and extension at 60 °C for 240 s. A second round of sequencing analysis was performed using the antisense primer. Sequences were determined using the automated AB3130xl (Applied Biosystems, CA, USA). Results were analyzed with Chromas Lite software (Technelysium) and Mutation Surveyor software (SoftGenetics).
O6‑Methylguanine‑DNA methyltransferase (MGMT) promoter methylation analysis
O6-methylguanine-DNA methyltransferase (MGMT) promoter methylation patterns were studied by methyl-ation-specific PCR using primers specific for methylated
and unmethylated DNA [35] on genomic DNA extracted
from paraffin-embedded tissue using QIAamp DNA Mini kit (Qiagen). The annealing temperature was 60 °C. DNA from normal lymphocytes treated with SssI meth-yltransferase (New England Biolabs) was used as a posi-tive control for methylated and unmethylated alleles of MGMT. PCR products were separated onto 3% agarose gel, stained with ethidium bromide, and visualized under UV illumination.
Chemotherapeutic drugs and adjuvant molecules
Temozolomide, ETO and IRI (Sigma-Aldrich, Saint Louis, MO, USA) were dissolved in dimethyl sulfoxide (DMSO) (Sigma-Aldrich) at the concentration of 100 mM, 30 mg/ mL and 10 mg/mL, respectively, while CARB and LEV (Sigma-Aldrich) were dissolved in deionized water at the concentration of 10 mg/mL and 5 mg/mL, respectively. All the drugs were stored as stock solutions at -80 °C and diluted in stem cells culture medium just before use. The final drug concentrations used in the experiments were: TMZ: 250 µM; ETO: 10 µM; IRI: 10 µg/mL and CARB: 10 µg/mL; LEV: 40 µg/mL.
When the cells were treated with both TMZ and LEV, LEV was added 2 h before TMZ addition and the cultures were stopped after 48 h. The chemotherapeutic drug con-centrations utilized in our experiments are in the higher range of serum peak levels transiently reached in vivo during high-dose chemotherapy.
BrdU cell proliferation assay
GCSCs and PCSCs were seeded at the density of 50.000 cells/well in 96-well plates and incubated overnight. The cells were then treated with the appropriate chemothera-peutic agents, as indicated in the Fig. 1 for 48 h. Finally 10 µM BrdU was added to the plates and the cells were incubated overnight. BrdU proliferation assay was per-formed according to the manufacturer’s instructions (Cell Signaling, #6813 Danvers, MA, USA).
Western blot analysis
For immunoblotting analysis, cells were washed in 1 × PBS, harvested and lysed in 1x Cell Lysis Buffer (Cell Signaling #9803) containing 1 mM PMSF (Cell Signal-ing #8553) and a complete protease inhibitor cocktail (Cell Signaling #5872) for 30 min at 4 °C. Then the cells were sonicated briefly and the extracts were centri-fuged 10 min at 14,000 × g in a cold microfuge. Protein
concentration was determined by Bradford Protein Assay (Bio-Rad Laboratories Inc, Hercules, CA, USA) accord-ing to the manufacturer’s instructions. Equal amounts of proteins were then separated by SDS/PAGE
(Mini-PROTEAN® TGX™ Precast Protein Gels, or
Mini-PROTEAN TGX stain-free precast PAGE gels, Bio-Rad Laboratories Inc.) and transferred to a nitrocellulose membrane (GE Healthcare, Piscataway, NJ, USA). Mem-branes were blocked with Tris-buffered saline (TBS) 1X (Bio-Rad Laboratories Inc.) supplemented with 0.1% Tween-20 and containing 5% nonfat milk for 1 h at room temperature (RT). The primary antibodies used in this work were: MGMT (1:500, mouse monoclonal anti-body, clone MT3.1, MAB16200, Merk Millipore, Darm-stadt, Germany); anti-HDAC4 (1:100, rabbit monoclonal antibody, sc-46672 Santa Cruz Biotechnology, Dallas, Tx, USA); anti-PCNA (1:1000, mouse monoclonal antibody, M0879, Dako, Santa Clara, CA, USA); anti-cleaved Cas-pase-3 (1:1000, polyclonal antibody, #9665, Cell Signal-ing); anti-β-actin, (1:10000 mouse monoclonal antibody, Sigma-Aldrich). Blots were then incubated with horse-radish peroxidase-conjugated secondary antibody (1:10,000, Vector Laboratories, Burlingame, CA, USA) for 1 h RT. Signals were captured by ChemiDoc™ Imaging System (Bio-Rad Laboratories, Hercules, CA, USA) using an enhanced chemiluminescence system (SuperSignal Chemoluminescent substrate, Thermo Fisher Scientific Inc. Waltham, MA, USA) and densitometric analyses
were performed with Image Lab™ Touch Software
(Bio-Rad Laboratories). Nuclear and cytosolic fractions were normalized using stain free technology (Bio-Rad Labora-tories Inc.). All experiments were carried out in triplicate and representative results are shown.
Immunofluorescence and confocal microscopy analysis Immunofluorescence analysis was performed on GCSCs and PCSCs collected onto a glass slide using a Cyto-spin centrifuge (Shandon Centrifuge, Model CytoCyto-spin 3, Marshall Scientific, Hampton, NH, USA), fixed with 4%
paraformaldehyde for 20 min, incubated with 0,01% Tri-ton X-100 for 7 min and blocked with Super Block solu-tion (UCS Diagnostic S.r.l., Morlupo, Italy) for 5 min. The slides were incubated overnight at 4 °C with the primary antibodies against: MGMT (1:100, Merk Millipore), HDAC4 (1:100; Santa Cruz Biotechnology, INC.) and cleaved Caspase-3 (1:400, Cell Signaling). The next day, the slides were incubated with the following secondary antibodies for 1 h at RT: Alexa Fluor 584 (1:1000, Invit-rogen Molecular Probes, Eugene, OR, USA) and Alexa Fluor 488 (1:1000, Invitrogen Molecular Probes). The cells were cover-slipped with ProLong Gold antifade rea-gent with DAPI (Life Technologies) and examined with a confocal laser scanning microscope (TCS-SP2, Leica Microsystems, GmbH, Wetzlar, Germany) equipped with an Ar/ArKr laser and a HeNe lasers. The images were recovered utilizing the Leica Confocal software. Laser line was at 488 nm and 543 for alexafluor 488 and alex-afluor 568 excitation, respectively. For each analyzed field, optical spatial series each composed of about 10 optical sections with a step size of 1 μm were obtained. The images were scanned under a 40× oil. In each exper-iment, negative controls without the primary antibody were included to check for nonspecific staining.
Statistical analysis
Each experiment was repeated three times. Data are pre-sented as the mean ± SD. Statistical analysis was generally performed using Student’s t-test, assuming equal variance, and p-values were calculated based on the 2-tailed test. A p-value of < 0.05 was considered statistically significant. The Mann-Whitney test was used for the analysis of dis-tribution values of BrdU incorporation in neurospheres.
Results
TMZ was the less effective chemotherapeutic agent in decreasing the GCSC and PCSC proliferation
The analysis of the IDH1 status in all the GCSC and PCSC pairs derived from six patients revealed that all of Fig. 1 Effects of chemotherapeutic treatments on patient-derived GSC proliferation. GCSC and PCSC neurospheres derived from GBM of six
different patients were treated with TMZ (250 µM), ETO (10 µM), IRI (10 µg/mL) and CARB (10 µg/mL) for 48 h. GCSCs and PCSCs proliferation rate was evaluated by BrdU incorporation. a The graph represents the distribution values of BrdU incorporation of the all neurospheres analyzed. b The graph represents BrdU incorporation of the GCSCs and PCSCs derived from patients #1, #2 and #3, that exhibit a higher capacity of BrdU incorporation. c The graph represents BrdU incorporation of the GCSCs and PCSCs derived from patients #4, #5 and #6, that exhibit a lower capacity of BrdU incorporation. K-means algorithm was used to cluster into 2 groups the BrDU incorporation values. d Percentage of decreased BrdU incorporation versus CTR. The results shown are representative of three independent experiments. a–c *p < 0.05 vs CTR by Mann–Whitney test. d * p< 0.05, ** p< 0.01, ***p < 0.001 vs CTR by Student’s t-test
Page 5 of 18 Scicchitano et al. Cancer Cell Int (2018) 18:136
them are IDH1-wildtype. Moreover, the analysis of muta-tional IDH1/2 status and MGMT promoter methylation status in all the available tissue samples revealed that all of them were IDH1/2 wildtype and showed an un-meth-ylated MGMT status.
We then investigated the effects of different chemo-therapeutic agents on the proliferation of the neu-rospheres isolated from the GBM derived from six different patients. For this purpose, GCSCs and PCSCs were treated with TMZ, ETO, IRI and CARB for 48 h and then the rate of proliferating cells was evaluated by BrdU incorporation. At first, we noted that when the data regarding GCSCs and PCSCs derived from all the patients were analyzed together they were distributed in two clusters: one with the higher and one with lower values of BrdU incorporation (Fig. 1a). Interestingly, all the chemotherapeutic agents exerted significant effects only in the cells with higher values of BrdU incorpora-tion (GCSCs and PCSCs derived from patients #1, #2 and #3) (Fig. 1b), whereas none of the drugs affected sig-nificantly the cells with a lower proliferation rate (GCSCs and PCSCs derived from patients #4, #5 and #6) (Fig. 1c). We then evaluated, more specifically, the percentage of proliferative reduction induced by the chemotherapeutic agents when the GCSCs and the PCSCs derived from the GBM of each patient were considered separately (Fig. 1d). As expected, both GCSCs and PCSCs obtained from the GBM of all the patients exhibited a higher resistance in terms of proliferation to the chemotherapeutic drug treatments when compared to Jurkat cells that, as hemat-opoietic cells, represent a good general model to test chemotherapeutic agent activity [36] (Additional file 1
and Additional file 2: Figure S1). Although no signifi-cant differences were observed in the response between GCSCs and PCSCs, our results showed that, similarly to what happens in Jurkat cells, TMZ had the lower effect, as demonstrated by the percentage of decreased
proliferative range (8–23% versus CTR), while CARB had the stronger effect since the percentage of decreased pro-liferative range was 21–45% versus CTR (Fig. 1d). Levetiracetam sensitized GSCs to TMZ treatment
Since our previous results demonstrated that, among the tested antineoplastic drugs, TMZ was the less effi-cient to decrease the proliferation of both GCSCs and PCSCs, we then investigated whether its anti-prolifera-tive effect might be strengthened when combined with the LEV. LEV concentration used in this study (40 μg/ mL) is included in the clinical serum therapeutic con-centration range achieved in patients at oral doses of
500-1000 mg twice daily [28]. GCSCs and PCSCs
iso-lated from the GBM derived from six patients were treated with TMZ, LEV or with a combination of TMZ and LEV, for 48 h. Figure 2a shows that, when analyzed together, the GCSCs derived from all the patients dis-played a significant reduction of BrdU incorporation only with the combined treatment with TMZ and LEV. This result is confirmed by the analysis of BrdU incorpora-tion evaluated in the GCSCs derived from each patient (Fig. 2b), demonstrating that the slight antitumor effect exerted by the treatment with TMZ or LEV alone was strongly enhanced when TMZ and LEV were added in combination. Only the GCSCs derived from patient #6 did not display a significant reduction in cell proliferation (Fig. 2b). Interestingly, the PCSCs subjected to the same treatments (Fig. 3a, b) seemed to be more resistant than the GCSCs since only the PCSCs derived from patients #4 and #5 (Fig. 3b) showed a significant decrease of pro-liferation when exposed to the combination of TMZ and LEV compared to either untreated cells or treated with these drugs alone. These results demonstrate that LEV sensitized GBM stem cells to TMZ and that this effect is stronger in GCSCs than in PCSCs.
(See figure on next page.)
Fig. 2 Effect of TMZ and LEV combined treatment on GCSC proliferation. GCSC neurospheres derived from GBM of six different patients were
treated with TMZ (250 µM), LEV (40 μg/mL) or with a combination of TMZ and LEV for 48 h. Cell proliferation was evaluated by BrdU incorporation. The results were representative of three independent experiments. Statistical analysis was performed using Mann–Whitney test *p < 0.05 (a) and Student’s t-test (b). P value < 0.05 was considered statistically significant
Page 7 of 18 Scicchitano et al. Cancer Cell Int (2018) 18:136
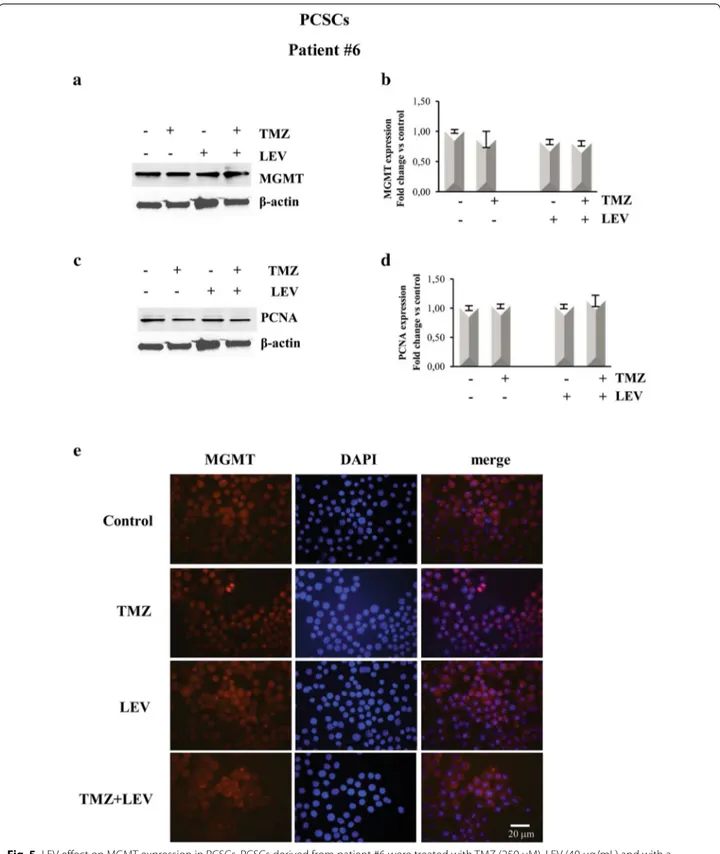
MGMT expression was downregulated in GCSCs treated with LEV + TMZ
To test the hypothesis that LEV-induced sensitization to TMZ might result from the inhibition of MGMT-medi-ated DNA repair, we investigMGMT-medi-ated MGMT protein levels. This analysis was performed in the GCSCs derived from patient #4, which displayed a high reduction of the pro-liferative rate after exposure to the combined treatment with LEV + TMZ and in PCSCs derived from patient #6, which showed resistance to all the treatments. The data obtained by BrdU cell proliferation assay were confirmed by Western blot analysis shown in Figs. 4c, d and 5c, d that demonstrated a decreased expression of the prolif-eration marker PCNA in the GCSCs of patient #4 when LEV and TMZ were added together, while its expression was not affected in the PCSCs derived from patient #6. Western blot analysis revealed a high level of MGMT expression in untreated GCSCs derived from patient #4; this expression was slightly decreased after treat-ment with TMZ and LEV singularly but it was dramati-cally decreased after the combined treatment with TMZ and LEV (Fig. 4a, b). In contrast, none of the treatments seemed to modify the MGMT expression level in the PCSCs derived from patient #6 when compared with untreated cells (Fig. 5a, b). Immunofluorescence analysis confirmed that the high expression of MGMT in
con-trol GCSCs derived from patient #4 (Fig. 4e) was
par-tially decreased in the presence of either LEV or TMZ, while it was strongly reduced by the combined
treat-ment with TMZ and LEV (Fig. 4e). In contrast, none of
the treatments modified MGMT expression in PCSCs derived from the GBM of patient #6 (Fig. 5e). The PCNA and MGMT expression levels were also investigated in the PCSCs derived from patient #2 that similarly to the PCSCs of patient #6 did not show a reduction of the pro-liferative rate after exposure to all the treatments. West-ern blot analysis revealed that none of the treatments significantly affected the MGMT expression level, and
the slight effect of TMZ and LEV on PCNA expression was not significantly modified by the combined treat-ment with TMZ + LEV (data not shown).
LEV induced HDAC4 nuclear translocation in TMZ‑treated GCSCs but not in PCSCs
It is has been demonstrated that some antiepileptic drugs, such as LEV, are able to regulate the HDACs activ-ity. In particular, HDACs inhibitors can influence TMZ efficacy by modulating the expression of MGMT. Hence, we verified whether in our system, the LEV-induced sensitization to TMZ might be the result of a HDACs-dependent mechanism.
To this purpose, we first analyzed the expression lev-els and the cellular localization of HDAC4 in the GCSCs derived from patient #4, that, as we previously demon-strated, greatly reduced their proliferative rate following the combined treatment with TMZ and LEV, in com-parison with the PCSCs derived from patient #6, that, by contrary, showed resistance to the same treatment.
Immunofluorescence analysis (Fig. 6A) and Western
blotting of nuclear and cytosolic fractions (Fig. 6B, C) revealed that the combination of TMZ and LEV induced the accumulation of HDAC4 into the nucleus of GCSCs derived from patient #4. Indeed HDAC4 expression was low and diffuse in the control and in correspondence of the separate treatments (Fig. 6A: panel a, b and c) while a strong nuclear expression was detected in TMZ + LEV treated cells (Fig. 6: panel d).
Interestingly, none of the treatments induced HDAC4 nuclear translocation in PCSCs derived from patient #6 as demonstrated by the immunofluorescence and West-ern Blotting of nuclear and cytosolic fractions, as shown
in Fig. 6D–F. We also performed Western blot analysis
of HDAC4 expression in the total lysate of the PCSCs derived from patient #2 subjected to the same treatments described above, demonstrating that the low increase in HDAC4 expression observed after TMZ treatment was Fig. 3 Effect of TMZ and LEV combined treatment on PCSC proliferation. PCSC neurospheres derived from GBM of six different patients were
treated with TMZ (250 µM), LEV (40 μg/mL) or with a combination of TMZ and LEV for 48 h. Cell proliferation was evaluated by BrdU incorporation. The results were representative of three independent experiments. Statistical analysis was performed using Mann–Whitney test *p < 0.05 (a) and Student’s t-test (b). P value < 0.05 was considered statistically significant
Page 9 of 18 Scicchitano et al. Cancer Cell Int (2018) 18:136
not significantly modified by the combined treatment with TMZ and LEV (data not shown).
LEV induced apoptosis in TMZ‑treated GCSCs but not in PCSCs
It has been demonstrated that one of the mechanisms involved in the cytotoxic effect of chemotherapeutic agents is apoptosis. Indeed, in Jurkat cells, all the chem-otherapeutic treatments significantly induced high lev-els of the activity of some of the pro-caspases that are known to act as initiators (such as Caspases-2, -8 and -9) and some of the caspases (such as Caspase-3 and -6) that are known to act as effectors of apoptosis (IRI treatment only did not significantly induce the activity of Caspase-6) (Additional file 1 and Additional file 3: Figure S2). To explore whether the anti-proliferative effect of the combined treatment with TMZ and LEV was associated with apoptotic death, we tested for the presence and cellular localization of cleaved Caspase-3 under the same condition described above. By immu-nofluorescence analysis, we observed that in the GCSCs derived from patient #4, Caspase- 3 is present in the cytoplasm of the control and of the cells that received
the individual treatments with LEV or TMZ (Fig. 7A:
panels a–c), while its expression was strongly increased in the nuclei when the cells received the combined
treat-ment LEV + TMZ (Fig. 7A: panel d). To confirm this
result, we assessed the levels and the intracellular locali-zation of cleaved Caspase-3 by Western blot analysis of
nuclear and cytosolic fraction. Figure 7B and C show
that Caspase-3 expression was significantly increased in the nuclei of GCSCs of patient #4 when the cells were treated with TMZ and LEV together, while none of the treatments exerted Caspase-3 significant modifications in cytosolic extracts. In contrast, immunofluorescence and Western blot analysis performed on PCSCs derived from patient #6 demonstrated that although low levels of Caspase-3 were detected in both nuclei and cytosolic fractions, none of the treatments induced changes in its
expression (Fig. 7D–F). Caspase- 3 expression was also evaluated by Western blot analysis in the total lysate of the PCSCs derived from patient #2. Although a slight but significant increase in the Caspase-3 expression was detectable after TMZ treatment, this effect was not modified by the combined treatment with TMZ + LEV (data not shown).
Discussion
Glioblastoma is a very aggressive form of brain tumor particularly resistant to the standard therapies which include maximal surgical resection, followed by com-bined treatment with radiotherapy and chemotherapy
[6]. Alkylating agents, such as TMZ and CARB, and
topoisomerase inhibitors, such as ETO and IRI, although effectively improve clinical outcomes when used alone or in combination with radiotherapy, display several adverse effects [6] and their administration has not significantly changed the survival for GBM over the last years, making chemoresistance one of the biggest problems for GBM therapy [37]. Thus, it is evident the need to identify new therapeutic strategies that can increase the life spans of patients affected by GBM.
Glioblastoma stem-like cells (GSCs) represent a sub-population within the heterogeneous tumor mass of GBM, with a high similarity with neural stem cells [6, 38]. They are characterized by elevated proliferative rate and tumorigenic capability in vivo [39, 40] and are thought to be responsible for the resistance to standard therapies [41, 42]. It has been demonstrated that the peritumor tis-sue is the site of tumor recurrence in 90% of the patients
[19]. This area shows complex changes such as edema,
increased vascularization, abnormal gene expression and presence of numerous specialized cell types [13–18], and is also the site in which a subpopulation of cancer
stem-like cells (PCSCs) has been found [12]. Although
both GCSCs and PCSCs express stem cell markers, they have different characteristics in terms of self-renewal and
(See figure on next page.)
Fig. 4 LEV effect on MGMT expression in GCSCs. GCSCs derived from patient #4 were treated with TMZ (250 µM), LEV (40 μg/mL) and with a
combination of TMZ and LEV for 48 h. a, c Western blot analysis of MGMT and PCNA expression levels; representative immunoblots are shown. b,
d Densitometric analysis of MGMT and PCNA expression levels (normalized to β-actin levels) of three independent experiments. Statistical analysis
was performed using Student’s t-test. P value < 0.05 was considered statistically significant. e Confocal microscopy micrographs of GCSCs from patient #4 showing MGMT expression. Nuclei were stained with 4′,6-diamidino-2-phenylindole (DAPI). Original magnification: ×400
Page 11 of 18 Scicchitano et al. Cancer Cell Int (2018) 18:136
Fig. 5 LEV effect on MGMT expression in PCSCs. PCSCs derived from patient #6 were treated with TMZ (250 µM), LEV (40 μg/mL) and with a
combination of TMZ and LEV for 48 h. a, c Western blot analysis of MGMT and PCNA expression levels; representative immunoblots are shown. b,
d Densitometric analysis of MGMT and PCNA expression levels (normalized to β-actin levels) of three independent experiments. Statistical analysis
was performed using Student’s t-test. P value < 0.05 was considered statistically significant. e Confocal microscopy micrographs of PCSCs from patient #4 showing MGMT expression. Nuclei were stained with 4′,6-diamidino-2-phenylindole (DAPI). Original magnification: X 400
Page 13 of 18 Scicchitano et al. Cancer Cell Int (2018) 18:136
tumorigenicity, suggesting that PCSCs may have high rel-evance in translational research [12].
In this study, we investigated the response of IDH1-wildtype GCSCs and PCSCs derived from six patients affected by GBM to different chemotherapeutic drugs and verified the possibility to enhance their effect through the combined treatment with adjuvant mol-ecules. The comparison of GCSCs and PCSCs behavior and the identification of the molecules involved in their differential response to the treatments may provide a further insight in the complexity of GBM-neighboring microenvironment, which plays a crucial role in tumor progression.
Since hematopoietic cells represent the primary tar-get of chemotherapy-related adverse effects, here we first analyzed the efficacy of different chemotherapeutic drugs (TMZ, ETO, IRI and CARB) in Jurkat cells (Addi-tional file 2: Figure S1A). As expected, all the tested antineoplastic agents dramatically decrease the prolif-eration of these cells. In particular, BrdU assay dem-onstrates that IRI and CARB have the stronger effect in decreasing proliferation while TMZ is less efficient. Western blot analysis of PCNA expression confirms that among the used compounds, TMZ exerts the lower anti-proliferative activity (Additional file 2: Figure S1B and C). This effect seems to be related to the activation of apoptotic pathway since all the chemotherapeutic drugs increased the activity of both pro- and effector-caspases (Additional file 3: Figure S2). We then inves-tigated the effects of the different chemotherapeutic treatments on the proliferation rate of GCSCs and PCSCs. Both cell populations resulted more resist-ant than Jurkat cells to the different treatments and we noted that all the chemotherapeutic agents exerted
significant effects only in the cells with higher values of BrdU incorporation (GCSCs and PCSCs derived from patients #1, #2 and #3), whereas none of the drugs affected significantly the cells with a lower prolifera-tion rate (GCSCs and PCSCs derived from patients #4, #5 and #6). Moreover, although no significant dif-ferences have been found between GCSCs and PCSCs, TMZ is the drug with the lower efficacy in decreas-ing the proliferation of neurosphere clones derived from GBM of all the six patients. TMZ is a small mol-ecule that is readily absorbed in the digestive tract and, because of its lipophilia, it is able to cross the blood–brain barrier. TMZ is the most widely chemo-therapeutic drug used in patients with GBM, although the majority of the patients demonstrate de novo or acquired resistance, with subsequent tumor progres-sion [5, 43]. Thus, the identification of the mechanisms of resistance and the attempting to enhance its effect can represent a good therapeutic strategy. MGMT repairs cytotoxic DNA lesions generated by TMZ. Many studies have shown a mechanistic link between MGMT activity and TMZ resistance, with suppression of MGMT activity resulting in increased cytotoxic-ity and MGMT protein overexpression which lead to resistance [31]. However, the role of MGMT in the evo-lution of acquired resistance is not well established as demonstrated by several papers revealing that MGMT expression is not always related to resistance to TMZ treatment [44–46]. Since our results demonstrate that TMZ is the less efficient chemotherapeutic agent in decreasing the proliferation of both GCSCs and PCSCs, we have investigated the possibility of increasing its anti-tumor activity by means of the combined use with LEV. LEV is a relatively new non-enzyme inducing AED
(See figure on next page.)
Fig. 6 LEV effect on HDAC4 expression in GCSCs and PCSCs. GCSCs from patient #4 and PCSCs from patient #6 were treated with TMZ (250 µM),
LEV (40 μg/mL) and a combination of TMZ and LEV for 48 h. A panels a–d HDAC4 expression was evaluated in GCSCs from patient #4 by immunofluorescence analysis. Confocal microscopy micrographs showing HDAC4 (green) in untreated control cells (a), TMZ treated cells (b), LEV treated cells (c) and LEV + TMZ treated cells (d). B Cytoplasmic and nuclear extracts from GCSCs (patient #4) were evaluated for HDAC4 expression by Western blot analysis. A representative immunoblot is shown. C Densitometric analysis of HDAC4 expression levels of three indipendent experiments normalized using Stain free technology. Statistical analysis was performed using Student’s t-test. P value < 0.05 was considered statistically significant. D panels a–d HDAC4 expression was evaluated in PCSCs from patient #6 by immunofluorescence analysis. Confocal microscopy micrographs showing HDAC4 (green) in untreated control cells (a), TMZ treated cells (b), LEV treated cells (c) and LEV + TMZ treated cells (d). E Cytoplasmic and nuclear extracts from PCSCs (patient #6), were evaluated for HDAC4 expression by Western blot analysis. A representative immunoblot is shown. F Densitometric analysis of HDAC4 expression levels of three indipendent experiments normalized using Stain free technology. Statistical analysis was performed using Student’s t-test. P value < 0.05 was considered statistically significant
Page 15 of 18 Scicchitano et al. Cancer Cell Int (2018) 18:136
strongly recommended as a first line drug for patients
with brain tumors [47]. Recently, a growing body of
evidence suggests that selected AEDs could lead to sig-nificant pharmaco-epigenetic interactions. It has been reported that LEV could act by favoring the recruit-ment of inhibitory complex, including HDAC, on the
MGMT promoter, thus reducing its transcription [25].
Here we show that in the GCSCs the combined treat-ment with LEV and TMZ decreases the MGMT expres-sion levels and induces the nuclear translocation of HDAC4, suggesting, in agreement to what reported
by Bobustuc et al. [25], an HDAC4-dependent
inhibi-tory role for MGMT transcription, thus increasing the sensitivity of these cells to TMZ treatment. In contrast, HDAC4 is expressed, although at low levels, in PCSCs, but none of the treatments modulated its expres-sion and cellular localization. As GSCs show intrinsic deregulation in apoptotic cell death, we investigated whether in our system, the decreased proliferation rate observed in the presence of the combined treatment with LEV and TMZ could be associated with the activa-tion of apoptotic pathway. Here we show an increased caspase 3 nuclear accumulation in GCSCs, while no change of its expression was observed in PCSCs. This result is supported by the analysis of pro-and effector-caspase expression evaluated in Jurkat cells after expo-sure to different chemotherapeutic agents showing that all the treatments significantly induced high levels of the activity of both classes of caspase compared to untreated cells (Additional file 3: Figure S2). All these
data suggest that activation of apoptotic pathway is involved in the strong anti-proliferative effect exerted by the used antineoplastic drugs.
Taken together our results demonstrate that LEV enhances the TMZ effect on GCSCs by HDAC4-depend-ent downregulation of MGMT and by the activation of apoptotic pathways. PCSCs seem to be more resistant to the treatment, suggesting that the peritumoral micro-environment can favor the activation of survival mecha-nisms that make this therapeutic approach less effective. Our results are supported by data reported by Kim et al. demonstrating that the median progression-free sur-vival and overall sursur-vival for patients who received LEV in combination with TMZ were significative longer than those for patients who did not receive LEV [48]. In addi-tion, a case report was published by Peddi et al. where a continuous regression of GBM was noted in a patient who received LEV and Dexamethasone without any can-cer-targeted therapy, suggesting that the response may be related to Dexamethasone and/or LEV treatment [49]. Although more studies are needed to better evaluate the role of LEV and its molecular mechanism of action, these papers together with our results strongly suggest the ben-eficial effect of LEV as a chemosensitizer agent.
Conclusions
Although further studies are necessary to better charac-terize the GSC environment, our results suggest that the clinical therapeutic efficacy of TMZ in GBM might be potentiated by the combination treatment with LEV and Fig. 7 LEV effect on Caspase-3 expression in GCSCs and PCSCs. GCSCs from patient #4 and PCSCs from patient #6 were treated with TMZ
(250 µM), LEV (40 μg/mL) and a combination of TMZ and LEV for 48 h. A panels a–d Caspase-3 expression was evaluated in GCSCs from patient #4 by immunofluorescence analysis. Confocal microscopy micrographs showing Caspase-3 (green) in untreated control cells (a), TMZ treated cells (b), LEV treated cells (c) and LEV + TMZ treated cells (d). B Cytoplasmic and nuclear extracts from GCSCs (patient #4) were evaluated for Caspase-3 expression by Western blot analysis. A representative immunoblot is shown. C Densitometric analysis of Caspase-3 expression levels of three indipendent experiments normalized using Stain free technology. Statistical analysis was performed using Student’s t-test. P value < 0.05 was considered statistically significant. D panels a–d Caspase-3 expression was evaluated in PCSCs from patient #6 by immunofluorescence analysis. Confocal microscopy micrographs showing Caspase -3 (green) in untreated control cells (a), TMZ treated cells (b), LEV treated cells (c) and LEV + TMZ treated cells (d). E Cytoplasmic and nuclear extracts from PCSCs (patient #6) were evaluated for Caspase-3 expression by Western blot analysis. A representative immunoblot is shown. F Densitometric analysis of Caspase-3 expression levels of three indipendent experiments normalized using Stain free technology. Statistical analysis was performed using Student’s t-test. P value < 0.05 was considered statistically significant
Page 17 of 18 Scicchitano et al. Cancer Cell Int (2018) 18:136
that the enhancement of apoptotic pathways may repre-sent a primary goal in the development of new and more effective strategies.
Additional files
Additional file 1. Description (Results, Material and Methods) of addi-tional figures S1 and S2.
Additional file 2: Figure S1. Effects of different chemotherapeutic drugs on Jurkat cell proliferation. (A) BrdU cell proliferation assay of Jurkat cells treated for 48 h with TMZ (250 µM), ETO (10 µM), IRI (10 µg/ml) and CARB (10 µg/ml). (B) Western blot analysis of total lysates from Jurkat cells, treated as described above was performed to detect PCNA expression levels; β-actin was used as a loading control. (C) Densitometric analysis of three independent experiments on PCNA expression levels. ** p< 0.01, ***p < 0001 vs control by Student’s t-test.
Additional file 3: Figure S2. Effects of different chemotherapeutic agents on apoptosis induction in Jurkat cells. Jurkat cells were treated with the same concentrations of the antineoplastic drugs described in additional Fig. 1. After 48 h, the activity of the pro-caspases-2, -8 and -9 and of the effector caspases -3 and -6 was measured by using ApoTarget Caspase Colorimetric Protease Assay. The results are representative of three independent experiments. *p < 0.05, **p < 0.01, *** p< 0.001 vs control by Student’s t-test.
Abbreviations
GBM: gliobastoma multiforme; CSCs: cancer stem cells; GSCs: glioblastoma stem-like cells; GCSCs: glioblastoma cancer stem cells; PCSCs: peritumoral cancer stem cells; TMZ: temozolomide; HDACs: histone deacetylases; HATs: histone acetyltransferases; MGMT: O6-methylguanine-DNA methyltrans-ferase; CTR : control; LEV: levetiracetam; AEDs: antiepileptic drugs; PCNA: proliferating cell nuclear antigen; ETO: ETO; IRI: irinotecan; CARB: CARB; DAPI: 4′,6-diamidino-2-phenylindole.
Authors’ contributions
BMS designed all the experiments, performed BrdU and Apoptosis assays and wrote the manuscript. GD and SS performed the Western Blotting assays. SS and GP collected the neurospheres and performed Immunofluorescence analysis. BMS and AC performed confocal analysis. EB kindly provided the neurospheres. EB performed the analysis of IDH1 status in the neurospheres. LML performed the analysis of IDH1/2 status and MGMT methylation status on tissue samples. GS and GL critically revised the paper. All authors read and approved the final manuscript.
Author details
1 Istituto di Istologia ed Embriologia, Università Cattolica del Sacro Cuore, Fon-dazione Policlinico Universitario A. Gemelli IRCCS, Roma, Italia. 2 DAHFMO-Unit of Histology and Medical Embryology, Sapienza University of Rome, Via Scarpa 16, 00161 Rome, Italy. 3 ISBReMIT-Cancer Stem Cells Unit, IRCSS Casa Sollievo della Sofferenza, Viale Padre Pio 7, 71013 San Giovanni Rotondo, FG, Italy. 4 Isti-tuto di Anatomia Patologica, Università Cattolica del Sacro Cuore, Fondazione Policlinico Universitario A. Gemelli IRCCS, Roma, Italia.
Acknowledgements
The Authors sincerely thank Prof. A.Vescovi for kindly providing the neuro-spheres, Dr Nadia Trivieri for her expert technical assistance and Dr Cristina Giacinti for her support in the BrdU assays.
Competing interests
The authors declare that they have no competing interests.
Availability of data and materials
All original data are available upon request.
Consent for publication
No parts of this manuscript are being considered for publication elsewhere.
Ethics approval and consent to participate
Tissue samples from where neuropsheres were derived were provided by the Istituto Neurologico “C. Besta”, Milano and by the Istituto di Neurochirurgia, Università Cattolica del Sacro Cuore, Roma, according to the ethical require-ments of the institutional committees on human experimentation. Informed consent of the patients was obtained according to the Helsinki declaration of ethical requirements.
Funding
This work was supported from Ministero dell’Istruzione, dell’Università e della Ricerca-FIRB “Accordi di Programma” 2010 Project RBAP10KJC5_003.
Publisher’s Note
Springer Nature remains neutral with regard to jurisdictional claims in pub-lished maps and institutional affiliations.
Received: 28 March 2018 Accepted: 29 August 2018
References
1. Ohgaki H, Kleihues P. The definition of primary and secondary glio-blastoma. Clin Cancer Res. 2013. https ://doi.org/10.1158/1078-0432. CCR-12-3002.
2. Singh SK, Hawkins C, Clarke ID, Squire JA, Bayani J, Hide T, et al. Identifica-tion of human brain tumour initiating cells. Nature. 2004;432:396–401. 3. Cheray M, Begaud G, Deluche E, Nivet A, Battu S, Lalloue F, et al. Cancer
stem-like cells in glioblastoma. Brisbane (AU): Codon Publication; 2017. 4. Avgeropoulos NG, Batchelor TT. New treatment strategies for malignant
gliomas. Oncologist. 1999;4:209–24.
5. Stupp R, Mason WP, van den Bent MJ, Weller M, Fisher B, Taphoorn MJ, et al. Radiotherapy plus concomitant and adjuvant temozolomide for glioblastoma. N Engl J Med. 2005;352:987–96.
6. Minniti G, Muni R, Lanzetta G, Marchetti P, Enrici RM. Chemotherapy for glioblastoma: current treatment and future perspectives for cytotoxic and targeted agents. Anticancer Res. 2009;29:5171–84.
7. Mirimanoff RO, Gorlia T, Mason W, Van den Bent MJ, Kortmann RD, Fisher B, et al. Radiotherapy and temozolomide for newly diagnosed glioblas-toma: recursive partitioning analysis of the EORTC 26981/22981-NCIC CE3 phase III randomized trial. J Clin Oncol. 2006;24:2563–9.
8. Hart MG, Garside R, Rogers G, Stein K, Grant R. Temozolomide for high grade glioma. Cochrane Database Syst Rev. 2013; 30:CD007415. 9. Piccirillo SG, Combi R, Cajola L, Patrizi A, Redaelli S, Bentivegna A,
Baronchelli S, et al. Distinct pools of cancer stem-like cells coexist within human glioblastomas and display different tumorigenicity and inde-pendent genomic evolution. Oncogene. 2009;28:1807–11. 10. Glas M, Rath BH, Simon M, Reinartz R, Schramme A, Trageser D, et al.
Residual tumor cells are unique cellular targets in glioblastoma. Ann Neurol. 2010;68:264–9.
11. Piccirillo SG, Dietz S, Madhu B, Griffiths J, Price SJ, Collins VP, Watts C. Fluorescence-guided surgical sampling of glioblastoma identifies pheno-typically distinct tumour-initiating cell populations in the tumour mass and margin. Br J Cancer. 2012;107:462–8.
12. Lama G, Mangiola A, Proietti G, Colabianchi A, Angelucci C, D’ Alessio A, et al. Progenitor/Stem Cell Markers in Brain Adjacent to Glioblastoma: GD3 Ganglioside and NG2 Proteoglycan Expression. J Neuropathol Exp Neurol. 2016;75:134–47.
13. Bakshi A, Nag TC, Wadhwa S, Mahapatra AK, Sarkar C. The expression of nitric oxide synthases in human brain tumours and peritumoral areas. J Neurol Sci. 1998;155:196–203.
14. Roy S, Sarkar C. Ultrastructural study of micro-blood vessels in human brain tumors and peritumoral tissue. J Neurooncol. 1989;7:283–92. 15. Charles NA, Holland EC, Gilbertson R, Glass R, Kettenmann H. The brain
tumor microenvironment. Glia. 2012;60:502–14.
•fast, convenient online submission
•
thorough peer review by experienced researchers in your field
• rapid publication on acceptance
• support for research data, including large and complex data types
•
gold Open Access which fosters wider collaboration and increased citations maximum visibility for your research: over 100M website views per year
•
At BMC, research is always in progress. Learn more biomedcentral.com/submissions
Ready to submit your research? Choose BMC and benefit from:
transcriptome and miRNome profiling of glioblastoma tissues and peritumoral regions highlights molecular pathways shared by tumors and surrounding areas and reveals differences between short-term and long-term survivors. Oncotarget. 2015;6:22526–52.
18. Mangiola A, Saulnier N, De Bonis P, Orteschi D, Sica G, Lama G, et al. Gene expression profile of glioblastoma peritumoral tissue: an ex vivo study. PLoS ONE. 2013;8:e57145.
19. Park I, Tamai G, Lee MC, Chuang CF, Chang SM, Berger MS, et al. Patterns of recurrence analysis in newly diagnosed glioblastoma multiforme after three-dimensional conformal radiation therapy with respect to pre-radiation therapy magnetic resonance spectroscopic findings. Int J Radiat Oncol Biol Phys. 2007;69:381–9.
20. Barciszewska AM, Gurda D, Glodowicz P, Nowak S, Naskret-Barciszewska MZ. A new epigenetic mechanism of temozolomide action in glioma cells. PLoS ONE. 2015;10:e0136669.
21. Alonso MM, Gomez-Manzano C, Bekele BN, Yung WK, Fueyo J. Adeno-virus-based strategies overcome temozolomide resistance by silencing the O6-methylguanine-DNA methyltransferase promoter. Cancer Res. 2007;67:11499–504.
22. Nakada M, Furuta T, Hayashi Y, Minamoto T, Hamada J. The strategy for enhancing temozolomide against malignant glioma. Front Oncol. 2012;2:98.
23. Nishikawa R. Standard therapy for glioblastoma-a review of where we are. Neurol Med Chir. 2010;50:713–9.
24. Zhao YH, Wang ZF, Cao CJ, Weng H, Xu CS, Li K, et al. The clinical signifi-cance of O6-methylguanine-dna methyltransferase promoter methyla-tion status in adult patients with glioblastoma: a meta-analysis. Front Neurol. 2018. https ://doi.org/10.3389/fneur .2018.00127 .
25. Marampon F, Megiorni F, Camero S, Crescioli C, McDowell HP, Sferra R, et al. HDAC4 and HDAC6 sustain DNA double strand break repair and stem-like phenotype by promoting radioresistance in glioblastoma cells. Cancer Lett. 2017;397:1–11.
26. Adamopoulou E, Naumann U. HDAC inhibitors and their potential appli-cations to glioblastoma therapy. Oncoimmunology. 2013;2:e25219. 27. Witt O, Deubzer HE, Milde T, Oehme I. HDAC family: what are the cancer
relevant targets? Cancer Lett. 2009;277:8–21.
28. Bobustuc GC, Baker CH, Limaye A, Jenkins WD, Pearl G, Avgeropoulos NG, Konduri SD. Levetiracetam enhances p53-mediated MGMT inhibi-tion and sensitizes glioblastoma cells to temozolomide. Neuro Oncol. 2010;12:917–27.
29. Louis DN, Perry A, Reifenberger G, von Deimling A, Figarella-Branger D, Cavenee WK, et al. The 2016 World Health Organization classification of tumors of the central nervous system: a summary. Acta Neuropathol. 2016;131:803–20.
30. Horbinski C, Kofler J, Kelly LM, Murdoch GH, Nikiforova MN. Diagnostic use of IDH1/2 mutation analysis in routine clinical testing of formalin-fixed, paraffin-embedded glioma tissues. J Neuropathol Exp Neurol. 2009;68:1319–25.
31. Caldera V, Mellai M, Annovazzi L, Piazzi A, Lanotte M, Cassoni P, Schiffer D. Antigenic and genotypic similarity between primary glioblas-tomas and their derived neurospheres. J Oncol. 2011. https ://doi. org/10.1155/2011/31496 2.
32. Pallini R, Ricci-Vitiani L, Banna GL, Signore M, Lombardi D, Todaro M, et al. Cancer stem cell analysis and clinical outcome in patients with glioblas-toma multiforme. Clin Cancer Res. 2008;14:8205–12.
receptor drives self-renewal and tumorigenicity in stem-like tumor-prop-agating cells from human glioblastomas. Cancer Cell. 2012;22:765–80. 34. Balss J, Meyer J, Mueller W, Korshunov A, Hartmann C, von Deimling A.
Analysis of the IDH1 codon 132 mutation in brain tumors. Acta Neuro-pathol. 2008. https ://doi.org/10.1007/s0040 1-008-0455-2.
35. Esteller M, Hamilton SR, Burger PC, Baylin SB, Herman JG. Inactivation of the DNA repair gene O6-methylguanine-DNA methyltransferase by promoter hypermethylation is a common event in primary human neoplasia. Cancer Res. 1999;59:793–7.
36. Zeuner A, Pedini F, Signore M, Testa U, Pelosi E, Peschle C, et al. Stem cell factor protects erythroid precursor cells from chemotherapeutic agents via up-regulation of BCL-2 family proteins. Blood. 2003;102:87–93. 37. Sarkaria JN, Kitange GJ, James CD, Plummer R, Calvert H, Weller M, Wick
W. Mechanisms of chemoresistance to alkylating agents in malignant glioma. Clin Cancer Res. 2008;14:2900–8.
38. Sanai N, Alvarez-Buylla A, Berger MS. Neural stem cells and the origin of gliomas. N Engl J Med. 2005;353:811–22.
39. Ignatova TN, Kukekov VG, Laywell ED, Suslov ON, Vrionis FD, Steindler DA. Human cortical glial tumors contain neural stem-like cells expressing astroglial and neuronal markers in vitro. Glia. 2002;39:193–206. 40. Singh SK, Clarke ID, Terasaki M, Bonn VE, Hawkins C, Squire J, Dirks PB.
Identification of a cancer stem cell in human brain tumors. Cancer Res. 2003;63:5821–8.
41. Chen J, Li Y, Yu TS, McKay RM, Burns DK, Kernie SG, Parada LF. A restricted cell population propagates glioblastoma growth after chemotherapy. Nature. 2012;488:522–6.
42. Reya T, Morrison SJ, Clarke MF, Weissman IL. Stem cells, cancer, and cancer stem cells. Nature. 2001;414:105–11.
43. Burton EC, Prados MD. Malignant gliomas. Curr Treat Options Oncol. 2000;1:459–68.
44. Pandith AA, Qasim I, Zahoor W, Shah P, Bhat AR, Sanadhya D, Shah ZA, Naikoo NA. Concordant association validates MGMT methylation and protein expression as favorable prognostic factors in glioma patients on alkylating chemotherapy (Temozolomide). Sci Rep. 2018;30:6704. 45. Kitange GJ, Carlson BL, Schroeder MA, Grogan PT, Lamont JD, Decker PA,
Wu W, James CD, Sarkaria JN. Induction of MGMT expression is associated with temozolomide resistance in glioblastoma xenografts. Neuro Oncol. 2009. https ://doi.org/10.1215/15228 517-2008-090.
46. Blough MD, Westgate MR, Beauchamp D, Kelly JJ, Stechishin O, Ramirez AL, Weiss S, Cairncross JG. Sensitivity to temozolomide in brain tumor initiating cells. Neuro Oncol. 2010;12:756–60.
47. van Breemen MS, Wilms EB, Vecht CJ. Epilepsy in patients with brain tumours: epidemiology, mechanisms, and management. Lancet Neurol. 2007;6:421–30.
48. Kim YH, Kim T, Joo JD, Han JH, Kim YJ, Kim IA, Yun CH, Kim CY. Survival benefit of levetiracetam in patients treated with concomitant chemora-diotherapy and adjuvant chemotherapy with temozolomide for glioblas-toma multiforme. Cancer. 2015. https ://doi.org/10.1002/cncr.29439 . 49. Peddi P, Ajit NE, Burton GV, El-Osta H. Regression of a glioblastoma
multiforme: spontaneous versus a potential antineoplastic effect of dexamethasone and levetiracetam. BMJ Case Rep. 2016;23:2016.