Alma Mater Studiorum – Università di Bologna
Dipartimento di Medicina Specialistica, Diagnostica e Sperimentale
Dottorato di Ricerca in Oncologia e Patologia Sperimentale
XXIX Ciclo
Settore Concorsuale: SC 06/D3
Settore Scientifico Disciplinare: SSD MED 06 SC 06/D3
ROLE OF HUMAN EQUILIBRATIVE NUCLEOSIDE
TRANSPORTER 1 (hENT1) IN INTRAHEPATIC
CHOLANGIOCARCINOMA
Presentata da : Dott.ssa Marzia Deserti
Coordinatore Dottorato:
Relatore:
Prof. Pier Luigi Lollini
Prof. Giovanni Brandi
Correlatore:
Dott.ssa Simona Tavolari
CONTENTS
INTRODUCTION
1. Cholangiocarcinoma (CCA)……….. 3
1.1 Anatomical and functional characteristics of the biliary tree………... 3
1.2 Classification and pathological aspects of cholangiocarcinoma………... 4
1.3 Epidemiology, incidence and risk factors………... 9
1.4 Therapies and treatment strategies ………... 12
2. Human Equilibrative Nucleoside Transporter 1 (hENT1)………... 13
2.1 Clinical oncology relevance of hENT1 ………... 14
3. p53 ………... 17
4. Patient derived xenograft (PDX) model ………... 20
AIM OF THE STUDY ……….. 22
MATERIALS AND METHODS Patients characteristics………. 23
DNA and RNA extraction ………... 23
PCR analysis……….……... 23
Reverse transcription and real-time PCR………. 24
Tissue microarray and immunohistochemistry ………... 24
Cell lines, culture conditions and drug treatments………... 25
Immunocytochemistry………... 25
Transient transfection of siRNA……….. 26
Cell Viability Assay……….. 26
Cell Cycle Analysis by Flow Cytometry ………... 26
Western blot analysis………... 27
Establishment and characterization of patient derived xenograft (PDX)…………... 27
RESULTS
Analysis of hENT1 expression in intrahepatic cholangiocarcinoma affected
patients………... 29
Immunohistochemistry analysis of hENT1 and Ki67 expression in iCCA………... 30
Role of membrane hENT1 in cell growth………... 33
p53 and hENT1 ………... 35
P53 and hENT1 expression in iCCA cell lines……….... 36
PDX model of iCCA……… 38
DISCUSSION……...………... 40
INTRODUCTION
1. Cholangiocarcinoma (CCA)
Cholangiocarcinoma (CCA) is a group of malignant tumors that originates from cholangiocytes, the epithelial cells that form the biliary tree. Historically the tumor was described for the first time by Durand-Fardel in 1840, but it was only since 1911 that primary liver cancer were divided into hepatocellular carcinoma (HCC) and cholangiocarcinoma (CCA) based on their cellular origin [1]. In recent years the interest of the medical community towards the CCA has increased significantly, probably aided by the fact that CCA is a malignant tumor with very poor prognosis associated with high mortality rates and for which, in recent decades, has been highlighted a marked increase of global incidence.
1.1 Anatomical and functional characteristics of the biliary tree
The biliary tree is divided into intrahepatic and extrahepatic bile ducts. The more proximal intrahepatic biliary tree is represented by Hering Canals. The Canals of Hering are covered by both hepatocytes from both cholangiocytes and it contains stem progenitor cells from which can differ or in cholangiocytes or in hepatocytes; it will continue in the bile ductules, completely covered with cholangiocytes, whose localization is both intralobular that intraportal. The bile ductules converge at the level of portal tracts, in the interlobular bile ducts that are the main targets of damage in many cholangiopaties.
The intrahepatic bile ducts converge from the periphery of the parenchyma towards the hepatic hilum where they meet to form the main hepatic ducts, which in turn flow into the common hepatic duct, called common bile duct.
With the common bile duct, which also receives the cystic duct from the gall bladder, it starts the extrahepatic bile ducts that terminate in the second portion of the duodenum.
The cholangiocytes are the epithelial cells that form the biliary tree. They make up only 4-5% of the liver mass, but contribute about 10-30% of the bile flow [2]. The cholangiocytes
determine the fluidity and the alkalinity of the bile through a series of mechanisms of secretion and resorption that determine the final composition of the bile.
1.2 Classification and pathological aspects of cholangiocarcinoma
Recent clinical practice and molecular studies have clearly revealed how primitive liver tumours are an incredibly heterogeneous number of diseases with no common phenotype or a clear molecular signature. Accumulated evidence encourages the idea that such heterogeneity arise from the existence within the liver and across the biliary tree of distinct cells of origin receptive to different risk factors and liver injuries [3]. Two main mechanisms that could explain the connection involving the cell of origin and tumour heterogeneity have been already proposed: a different oncogenic events in the same cell of origin of the specific tissue or organ or conversely a precisely same oncogenic event within cells becoming cells of origin over the normal cellular hierarchy in a given tissue or organ. Remarkably, those two mechanisms could occur individually or also together to establish distinct tumour subtypes different for molecular profile, histopathological features, malignant potential and clinical evolution.[4]
Nowadays stem cells represent the ideal target for neoplastic transformation due to their longevity and capability of self-renewal, essential for acquiring the full set of mutations needed for oncogenic transformation. In the liver and along the biliary tree, two different types of stem cell niche, with specialized microenvironments maintaining stem cell characteristics and regulating the balance between their quiescent state and self-renewal/differentiation after activation, have been described.
The first has been identified in the canals of Hering, which walls are partially composed by hepatocytes and cholangiocytes and represent the anatomical and physiologic link between hepatocyte canaliculi and biliary duct systems; moreover they contain human hepatic progenitor cells (HPCs), stem cells able to differentiate towards hepatocyte and cholangiocyte lineages. [5,6] HPCs are a heterogeneous and dynamic population with potential hierarchical organization and various degrees of differentiation; these cells continuously change their phenotype, both cholangiocytes both hepatocytes, depending on the cell type most damaged within the liver.
The second stem cell niche was identified in the peribiliary glands (PBGs), tubulo-alveolar glands with mucinous and serous glandular acini located in the tissue of the bile duct walls in
communication with the duct lumen. Recent findings have shown that PBGs connect directly into the canals of Hering, making a continuous network of stem cells that help to form the liver and biliary tree. [7,8] PBGs are distributed along the biliary tree and contain biliary tree stem/progenitor cells (BTSCs), precursors of endodermal origin able to differentiate toward hepatocytes, cholangiocytes and pancreatic islet cells. The type of mature cell generated in this niche depends on whether the portion of the biliary tree is near the liver (hepatocytes), in the middle of the biliary tree (cholangiocytes) or near the duodenum (pancreatic islet cells and goblet cells). The existence of two distinct niches (the canals of Hering containing HPCs and PBGs containing BTSCs) and the successively development of distinct lineages suggests the existence of separate candidate cells of origin for different primitive liver tumour subtypes. Accordingly classification of primitive liver tumours based on the different cells of origin has been proposed: cells arising from HPCs and BTSC lineages are considered the cells of origin of intrahepatic and extrahepatic cholangiocarcinoma (iCCA and eCCA, respectively), hepatocellular carcinoma (HCC) and pancreatic ductal adenocarcinoma. Cells that origin from the HPC lineage are thought to be responsible for the development of ductular iCCA (NCAM positive), small bile duct iCCA (NCAM negative) and HCC. HPCs are also considered to give rise to combined HCC-CCA. Cells of origin from the BTSC lineage can give rise to mucin CCA, emerging from both extrahepatic bile ducts and intrahepatic large bile ducts. (Figure 1) [9,10]
Figure 1 Proposed classification of primitive liver tumours based on cells of origin
The identification of cells of origin is expected to permit a more systematic analysis of the different subtypes, opening a new avenue for the diagnosis, prognosis and treatment of these malignancies. Genetic variability in CCA could also be the result of a complex interplay among several factors including tumor clonal heterogeneity with genetically distinct tumor cell sub-clones that coexist with founder cells harboring most of the tumor-borne genetic mutations, either in the primary tumor (intratumoral heterogeneity), or in the same metastasis (intrametastatic heterogeneity). Genetic variability can also occur among metastases derived from the same primary tumor, as the different sub-clones of the primary tumor can give rise to genetically distinct lesions at the metastatic site (intermetastatic heterogeneity). Stochastic mutations and genomic instability due to the large number of cell divisions required for cancer growth makes tumor cells predisposed to accumulate genomic alterations with a high frequency, due to random mutations occurring during DNA replication and deficiencies in the mechanisms involved in DNA repair. The tumor microenvironment and cancer therapy can also induce fluctuations in tumor sub-clonal architecture and genetic profile by promoting the
selective growth of sub-clones with a survival advantage within a given tumor microenvironment or a given therapeutic setting and by eradicating those with a less favorable survival advantage.
Cholangiocarcinoma may occur in every point of the biliary tree, from the canal of Hering to the main bile duct. The ability to typify the CCA in relation to its localization is relevant both for prognosis both for therapeutic treatment, and correlates in part with the macro- and microscopic morphology of the tumor. According to their anatomical location, the CCA is distinguished in intrahepatic (iCCA) and extrahepatic (eCCA) which in turn may be divided in perhilar (pCCA) or distal (dCCA). [11,12]
On the basis of gross appearance, the iCCA can present three different patterns of growth: mass-forming (MF-iCCA), periductal infiltrating (PI-iCCA), and intraductal growing (IG-iCCA), in which the MF-iCCA largely represents the most frequent form (Figure 2). [13,14] Mass-Forming type (MF) is the most common subtype in iCCAs (60-80%) with increasing incidence. It seems to be related to hepatitis B and C infection, as supported by the fact that in many cases the diagnosis is incidentally during surveillance examinations, without the presence of specific symptom. Periductal Infiltration type (PI) occurs more rarely (7%) and typically grows along bile ducts without forming a mass. Differently, in Intraductal Growth type (GI), the less represented form, the tumor remains located in the lumen of the bile duct without invading the surrounding parenchyma with or without a visible papillary mass.
Figure 2 Anatomic classification and macroscopic subtypes of cholangiocarcinoma (CCA). A) CCA is classified as intrahepatic, when located proximally to the second-order bile ducts;
perihilar, when it is extrahepatic and above the cystic duct; distal, when located between the origin of the cystic duct and the ampulla of Vater. Bismuth-Corlette classification for pCCA: type I, in the common hepatic duct; type II, confined to the bifurcation of the common hepatic duct without involvement of the secondary intrahepatic ducts; type III, located in the bifurcation of the common hepatic duct involving the right (IIIA) or the left (IIIB) confluence, while type IV affects also the secondary intrahepatic ducts on both sides. B) Morphologic subtypes of pCCA: (a) periductal infiltrating type (sclerosing); (b) nodular (mass forming) into the common hepatic duct; (c) polypoid (papillary) subtype, with an intraductal growing pattern. C) Macroscopic iCCA types: (1) mass-forming subtype, (2) periductal infiltrating subtype, (3) intraductal-growth subtype. [15]
Also histological subtyping should be taken into serious consideration because it underlines different cell of origin, aetiology, risk factors, molecular profile, clinical outcome and response to treatment [16,17]. Although the vast majority of pCCAs and dCCAs are pure mucin-producing adenocarcinomas, iCCA is comprised of two main histological subtypes: a mucin-producing adenocarcinoma and a mixed subtype in which areas of adenocarcinoma coexist with areas of hepatocytic differentiation and of neoplastic ductular proliferation. [18]
1.3 Epidemiology, incidence and risk factors
Complessively CCA represents less than 2% of all human malignancies and is still considered a rare cancer. However if the hepatobiliary system will be considered as a whole, cancers of the gallbladder, intrahepatic and extra-hepatic biliary tree together represent approximately 30% of the total primary liver cancers with an incidence rates getting closer to that of HCC.[19]
Studies investigating CCA epidemiology indicate a progressive worldwide increase of incidence and mortality for iCCA, whereas eCCA seems to be stable or slightly decreasing. [20] Large differences in incidence and mortality between iCCA and eCCA observed in numerous studies suggest that the two types of CCA emerge from different pathological conditions and risk factors. [21]
The prevalence of the CCA is geographically heterogeneous and presumably reflects the presence of local and genetic risk factors. (Figure 3) The highest incidence rate is recorded in Southeast Asia, where Thailand reported the highest incidence rates (85/100.000) and where CCA represent approximately the 85% of total liver cancers, followed by China and Korea.[23,24] In fact infection with liver flukes, as Opisthorchis viverrini and Clonorchis sinensis, is a common risk factor in East Asia where iCCA represents a large proportion of primitive liver cancers.[25]
Figure 3 Worldwide incidence of CCA. Worldwide incidence (cases per 100,000) of
cholangiocarcinoma (CCA). Data refer to the period 1971–2009. Green colour identifies countries with lower incidence (<6 per 100,000 cases, rare cancer), whereas pink colour indicates countries in which CCA is not a rare cancer (>6 per 100,000 cases). Diagnoses have been classified according to international classification of disease (ICD) codes (ICD-O-1, ICD-O-2, ICD-O-3, ICD-10, ICD-V9, ICD-V10, ICD-O). When available, the more incident form (intrahepatic (IH) versus extrahepatic (EH) CCA) and the temporal trend of incidence (↑increasing trend; ↕ stable trend; ↓decreasing trend) have been reported). [22]
In comparison to the eastern countries, lower incidence rates occur in all western countries; in fact the lower age-standardized incidence is measured in countries as New Zealand, Costa Rica, Israel, Canada and Australia. (0,3-0,4/100.000). Also in Europe CCA is considered a rare cancer (<6/100.000) with a very low rates reported in Spain, Poland and Switzerland. In Italy, an important linear increase in CCA incidence has been registered in the last two decades; the progressive increase of incidence seems to affect iCCA, while than of eCCA was stable or slightly decrease. (Figure 4A) [26]
The increased incidence of iCCA in the last decades could be associated with the gradual increase of the awareness of this tumor and thus to improved diagnostic and therapeutic approaches.
The association between CCA (mainly pCCA) and primary sclerosing cholangitis (PSC) is well established, although it represents a rare disease; more interesting is the association with HBV-related and HCV-related liver diseases, whose have been identified as reliable risk factors, with a stronger association for iCCA than pCCA. [27, 28]
The CCA has a slight predominance in males; the incidence of iCCA is higher in men than women while that of eCCA is comparable in both sexes. The incidence also assumes a racial disparities increased in African Americans (1.5 times), in Indio and Hispanic Americans (1.8 times) and the Asian American (2.5 times) compared to the US white population.(Figure 4B). [29]
With this consideration in mind, nowadays we can declare that the main risk factors of CCA are liver flukes in Asian countries, primary sclerosing cholangitis (PSC) and HCV in western countries; even if several toxic and environmental factors are known or suspected to be implicated in CCA development, among them asbestos, dioxins and vynil chlorides and also heavy smoking and alcohol consumption seems to represent relevant cofactors. [30,31]
Figure 4 A) The number of new cases of liver and intrahepatic bile duct cancer was 8.4
per 100,000 men and women per year. The number of deaths was 6.1 per 100,000 men A
and women per year. These rates are age-adjusted and based on 2009-2013 cases and deaths. B) Percent of new cases by age group and number of new cases per 100.000 persons by race/ethnicity & sex in liver and iCCA .[32]
1.4 Therapies and treatment strategies
The CCA mortality rate is quite similar to incidence rate. The CCA is responsible for 10-20% of deaths from hepatobiliary malignancies with a number of annual deaths from CCA in the world is about 100.000 to 200.000 people. [33]
To date surgery with complete resection represents the only curative treatment for CCA. Without any treatment, the prognosis for these patients is poor with a median survival range of 6-9 month; recently it has been reported that in unresectable patients palliative, chemotherapy or radiotherapy treatments may prolong the median survival up to 12-15 months. [34] Unfortunately, only one-third of patients are resectable at diagnosis owing to advanced local tumor infiltration or peritoneal or distant metastasis and adequate functional liver remnant. [35] Survival after resection mainly depends on the presence of tumor negative margins in addition to absence of vascular invasion. [36] For iCCA five-year survival rate is reported in the range 22% - 44%. The main problem after resection is the recurrence, as reported in a recent meta-analysis, three- and five-years recurrence free survival rates are 47% and 39% respectively; the main factors associated with an increase rate of recurrence are multiple tumors, vascular invasion and lymph node metastasis. [37] Usually the recurrence arises in liver (50-60%), less frequently in the lymph nodes and peritoneal surface and rarely in lungs, bones, pleura and skin. [38]
However, since the surgery often can not be implemented because of the late diagnosis in advanced stage, it is necessary to assess the patient for liver transplantation, chemotherapy or radiation therapy.
Whereas liver transplantation, in selected patients with early stage (I-II) pCCA, appears to be a surgical alternative [39] for iCCA remains a controversial subject. Historically, liver transplantation for iCCA was associated with rapid recurrence of disease and poor survival rate close to 10%. [40]
2. Human Equilibrative Nucleoside Transporter 1 (hENT1)
Pyrimidine and purine nucleosides and their derivatives play critical roles in physiology and have diverse pharmacological applications. As central ‘salvage’ metabolites they can be converted to nucleotides, which serve as the energy-rich currency of intermediary metabolism, precursors of nucleic acids and play key roles in signalling. [41] Clinically, nucleoside and nucleobase drugs are widely used to treat cancer and viral infections. Because nucleosides and their derivatives are hydrophilic, their availabilities within cells and in the extracellular environment are primarily determined by specific nucleoside transporters proteins (NTs), which facilitate their movement through plasma membranes and some organellar membranes. Thus NTs play key roles in nucleoside physiology and pathophysiology, and in the therapeutic actions of many nucleoside drugs [42]
The main responsibles for these different types of transport belong to two families: the “Concentrative Nucleoside Transporters” (CNTs), corresponding in humans to the SLC28 family, and the “Equilibrative Nucleoside Transporters” (ENTs), corresponding to the SLC29 family.
Equilibrative nucleoside transporter 1 (ENT1) is a member of human integral membrane proteins SLC29 family that consists of four elements: hENT 1, hENT 2, hENT 3, hENT 4. [43] In cells, the family of human transporters ENTs is actually most represented by two proteins, hENT1 and hENT2.
Both transporters are regulated by many factors, some of which are related to fibrosis, like inflammation [44, 45], cell proliferation [46, 47] and oxidative stress [45]. Moreover, these NTs are regulated by inflammatory cytokines such as TNFα and IL6 [46] and their expression depends on cell density and cell–cell contacts [48].
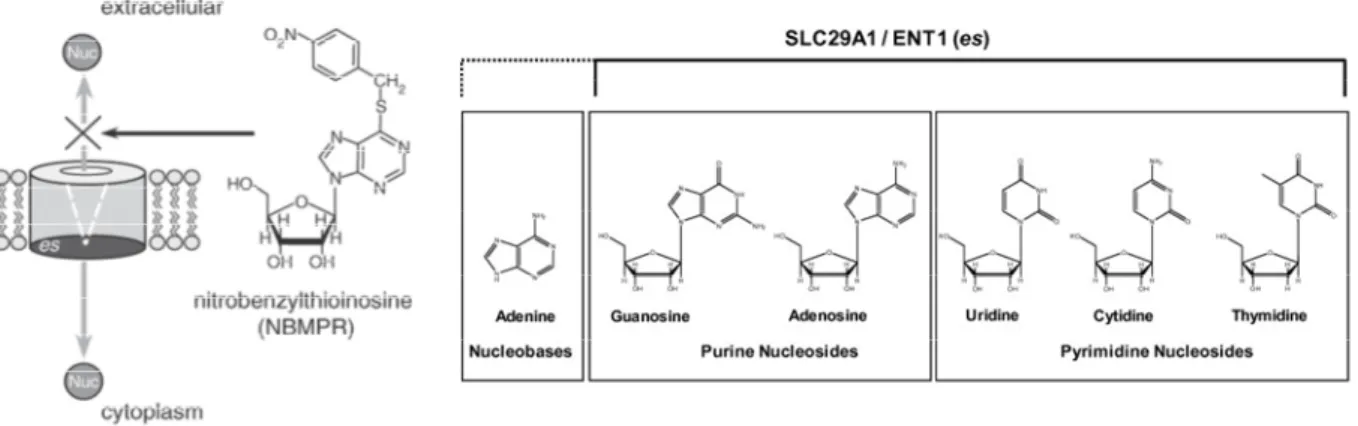
Equilibrative NTs are widely expressed. hENT1, showed in most human cell type, is encoded by the SLC29A1 gene, is a transmembrane glycoprotein that localizes to the plasma and mitochondrial membranes and mediates the cellular uptake of nucleosides, principally purines and pyrimidines, from the surrounding environment according to their concentration gradient between compartments intra and extracellular. (Figure 5)
The protein is categorized as an equilibrative (as opposed to concentrative) transporter that is sensitive to inhibition by nitrobenzylthioinosine (NBMPR).
Nucleoside transporters are required for nucleotide synthesis in cells that lack de novo nucleoside synthesis pathways, and are also necessary for the uptake of cytotoxic nucleosides used for cancer and viral chemotherapies.
Physiologically, these proteins have a fundamental role in certain cell types that are not able to synthesize by itself the nucleoside molecules, such as, in the case of mammals, enterocytes, erythrocytes, leukocytes, certain brain cells and cells of the spinal cord. In all these cases a system for recovery of nucleoside present in the extracellular environment as nutrients or their neosynthesis by other cells is required. [49]
Given its role it could appear obvious that hENT1 content of cultured human cancer cells appears to be coordinated with the cell cycle, levels of the transporter approximately doubling between the G1 and G2-M phases [43].
Multiple kinases have been implicated as regulators of hENT1 in human and other mammalian cells, and direct phosphorylation of the transporter by protein kinase A (PKA) and protein kinase C (PKC) has been demonstrated. [50]. The stress-activated JNK/C-JUN pathway negatively regulates ENT1 in a mouse leukemic cell line, and is a mechanism that might contribute to nucleoside drug resistance in cancer patients [51].
Figure 5 Schematic view of human Equilibrative Nucleosides Transporter 1 function and the
nucleosides that it can transport through cell membrane. [43]
2.1 Clinical oncology relevance of hENT1
In addition to its physiological role, hENT1 has an important clinical relevance due to the development in drug therapy for cancer and viral diseases that utilizes cytotoxic nucleoside
analogues. In oncology hENT1 plays an important role for entry of these drugs inside the target cells. Specifically, it has been shown that it enhances the transport of chemotherapeutic agents such as cladribine, cytarabine, fludarabine, gemcitabine, and capecitabine. [52, 53] These nucleoside analogues function in a multiplicity of ways, including: interference with the nucleic acids synthesis by incorporation into nucleic acids and modification of the metabolism of endogenous nucleosides (depleting the endogenous pools of nucleosides, the cytotoxic nucleosides increase their chances for incorporation into newly forming DNA and RNA). As reported by King, K.M., et al. [54] the expression of hENT1 in highly proliferating cells, such as the malignant cancerous cells, contributes to the selectivity for nucleoside analogues since they require higher transport of nucleosides for their replication. Differently, the downregulation of hENT1 was also suggested to contribute to clinical resistance of cytarabine and gemcitabine given that hENT1 is the major way of entry for these drugs [55] Moreover, hENT1 is now known as a positive predictive marker of patients receiving gemcitabine treatments for pancreatic cancer and metastatic lung disease [56]. Recent studies highlight the importance in measuring hENT1 levels as a predictive tool for better individual drug therapy protocols; in fact it has been shown that levels of hENT1 in patients with different breast cancers, Hodgkin’s disease, and pancreas adenocarcinoma have shown a significant range of distribution. Given that cancer cells have a higher demand for extracellular nucleosides to maintain their increased proliferation rates, nucleoside analogues are relatively specific for target cells. With higher levels of hENT1 being a predictive marker in pancreatic cancer and non-small cell lung cancer, it is of significant importance to improve the selectivity and specificity of drugs for cancer cells to help decrease normal cell toxicity and death.
Also in CCA has been demonstrated that the expression of hENT1 has been shown to be positively correlated with a three-fold increase in the survival of CCA patients receiving gemcitabine treatment [57]. Additionally, the positive role of hENT1 as predictive factor has been further reinforced in CCA patients treated with adjuvant gemcitabine administered intravenously in combination with oral administration [58].
A study recently conducted by our group [59] showed a significant correlation between the tumor expression of hENT1 on cell membrane and the response to treatment with adjuvant gemcitabine in patients with CC, revealing the predictive role of this transporter in this setting of patients. Longer therapies (5-6 cycles) have been associated with a 5 fold decrease risk of recurrence. (P = 0.041) in patients positive for hENT1 membrane compared to negative cases (no expression of hENT1 or expression exclusively cytoplasmic).
For the first time has been underlined how hENT1 localization on tumor cell membrane may predict response to adjuvant gemcitabine in CCA patients receiving more than four cycles of chemotherapy. The localization of hENT1 on the cell membrane seems to play a critical role in the response to therapy with gemcitabine; on the contrary its expression only in the cytoplasm can be compared to the negativity for hENT1 [59]. Obviously, further prospective randomized trials on larger populations are required to confirm these preliminary results, so that optimal gemcitabine-based chemotherapy may be tailored for CCA patients in the adjuvant setting.
In addition to play a key role in the pharmacokinetics of some chemotherapies, physiologically hENT1 is necessary for the cellular uptake of nucleosides, which have an important role of nutrients and metabolites and are crucial for the control of cell growth and tissue. Santini et al. reports that, in patients with metastatic pancreatic cancer and underwent surgical resection, high hENT1 tumor expression appears to be associated with a worse prognosis. Furthermore, by analyzing a homogeneous cohort of patients with carcinoma of the ampulla of Vater, it shows a strong correlation between the expression of hENT1 and the marker of cell proliferation, Ki67, indicating a possible positive correlation between the expression of hENT1 and the rate of proliferation of cancer cells [60, 61]. The intratumoral expression of hENT1, besides being a predictor of response to chemotherapy with gemcitabine in CC (as we have previously demonstred), may therefore also be a prognostic factor in CC.
3. p53
A protein on which particular attention was paid for its activities in cell cycle regulation as a tumor suppressor and apoptosis inducer is p53. The tumour suppressor protein p53 was firstly described in 1979 and ten years later identified as a tumour suppressor. In human, the TP53 gene that contains 11 exons is located in chromosome 17p13.1, the coded protein is approximately 53 kDa in size, containing 393 amino acids [62].
This protein has the ability to preserve cell stability by preventing the emergence of mutations; when normal mammalian cells are subjected to stress signals (hypoxia, radiation, DNA damage or chemotherapeutic drugs) p53 results activated; additionally to its activation, ubiquitin-dependent degradation of the p53 protein is blocked [63]. The resulting increase in p53-dependent gene transcription leads to the p53-mediated induction of programmed cell death and/or cell cycle arrest. Functional p53 is thought to provide a protective effect against tumorigenesis, and indeed, mutations of TP53 gene have been found in nearly all tumor types and are estimated to contribute to around 50% of all cancers [64]. p53 has many functions; the first one identified were inhibition of abnormal growth of cells and trigger of programmed cell death. These processes ensure genomic integrity or destroy the damaged cells, because of this p53 has been called the “guardian of the genome” [65]. As transcription factor p53 regulates the expression of genes involved in the regulation of cell cycle arrest, DNA repair and apoptosis, such as: p21CIP / WAF, GADD45, p53R2, p53AIP1, Bax, IGFBP3, p53DINP1, Fas, bcl-2 and many others. [66]
In the cell cycle arrest, p53 acts as checkpoint that arrests the cells in late G1 phase. This stop is caused by the p53-mediated transcription of p21CIP / WAF gene. The p21CIP / WAF protein, is an inhibitor of cyclin-kinase (CKI) that inhibits the phosphorylation of the Rb protein, by Cyclin D-Cdk4 complex, Cdk6-Cyclin D and Cdk2-cyclin E. This event is necessary for the transition from G1 to S phase, in addition p21CIP / WAF inhibits Cdk1- complex Cyclin A and cyclin B-Cdk1, necessary for the transition from the G2 phase to the M phase, thereby stopping the cell cycle in G2. The arrest of cell cycle is necessary to enable the cell to repair the damage caused by genotoxic stimulus. If the damage is successfully repaired, p53 induces the transcription of MDM2 which binds and inactives p53 directing it toward the proteasome degradation [67]. In this way, the levels of p53 return to be low and the levels of p21CIP / WAF decrease.
In many cases, the damage of the genome results so extensive that the repairing mechanisms are not able to remedy satisfactorily with consequence induction of p53-mediated apoptosis. Every cell has a balance between the expression of genes that can induce and those that can inhibit apoptosis. This balance can be altered by p53, in favor of the genes able to induce apoptosis. To perform its role p53 must be in active form, stable and at high levels. The key-event for the induction of apoptosis p53-mediated is the ATM-dependent phosphorylation and the activation of the WW domain of Pin1. [68]
Figure 6 Simplified scheme of the p53 pathway. [69]
Other genes, whose expression is regulated by p53, are Bcl-2 (anti-apoptotic) and Bax (pro-apoptotic). It has been identified binding sites for p53 in the promoter of Bax gene, which is over-expressed in response to genomic damage and after the increase of expression of p53. Furthermore, p53 promotes down-regulation of Bcl-2. This way indicates how, between the genes Bcl-2 and Bax regulated by p53, the intercellular balance can be altered, as a result of stimuli, in favor of Bax, for cell destruction by apoptosis.
P53 can act also promoting the overexpression of pro-apoptotic Fas gene. Once activated by FasL, Fas (CD95) can activate caspases, causing p53-dependent apoptosis.
Due to its function is results evident that p53 can be defined a tumor suppressor. Indeed, as emerges from the findings, p53-deficient mice are susceptible to spontaneous tumorigenesis
[70] and p53-null mice, although develop normally, show high incidence of sarcomas and lymphomas at early age. Another crucial piece of evidence came from the observation of humans, in which mutations in the p53 locus are present in about 50% of all sporadic tumors and in the other half the p53 protein is inactivated by various cellular and viral antagonists. Cells with mutations in TP53 alleles do not exhibit delayed entry into the S phase after low levels of DNA modification and do not undergo apoptosis following more extensive DNA damage. In such cells, damaged DNA is allowed to replicate, producing mutations and DNA rearrangements that contribute to the development of a highly transformed cell. Therefore mutations in TP53 can have cancer-inducing consequences. Virtually all p53 mutations abolish its ability to bind to specific DNA sequences and activate gene expression [71]. Germ-line TP53 mutations are far less common than somatic, but are recognised.
TP53 mutation is the most frequent genetic event found in a broad range of human tumors to date, including cancers of the ovary (48%), stomach (45%), colon (43%), lung (38%) and breast (25%). [72, 73] The unique feature of TP53 compared to other tumor suppressor genes is its mode of inactivation. While most tumor suppressor genes are inactivated by frameshift or nonsense mutations leading to absence of protein synthesis (or production of a truncated product), more than 80% of TP53 alterations are missense mutations that lead to the synthesis of a full-length protein that accumulates in the nucleus of the tumor cell.
Inactivation of the tumor suppressor gene TP53 has been implicated also in the genesis of cholangiocarcinoma in various immunohistochemical and molecular investigations, including gene sequencing studies.
The finding of different mutation rate in studies from different parts of the world, including studies comparing high and low incidence areas, has been postulated to possibly represent differences in the environmental mutagens and/or their concentrations.
4. Patient derived xenograft (PDX) model
For more than fifty years, tumor cells have been studied in in vivo xenograft models in rodents. In this model solid tumor cell lines, obtained from tumor fragments and cultured in vitro, were successfully engrafted in immunodeficient mice.[74] When in vitro cell line culture became more common, a large number of established cancer cell lines were transplanted into immunodeficient mice for the study of natural history and therapeutic responses; however many of those cell lines no longer represent the cancer type to which they are ascribed, given that they have been cultured in vitro for decades.[75]
Patient derived xenograft (PDX) models are renewable tumor models generated from tumor specimen of cancer patients. The tumor specimen, usually from surgery or biopsy, can be engrafted and expanded in immunodeficient mice directly. It can also be cultured briefly in vitro and then implanted into immunodeficient mice. [76] PDX models have been established for a variety of cancers, including pancreatic cancer, prostate cancer, ovarian cancer and glioblastoma. [77-79]
In comparison to traditional cell line derived xenograft models, PDX models retain the genomic alterations of primary tumors accurately and can be utilized to establish banks of PDX mice that present different genetic background within the same type of tumor. This system, closely imitating the heterogeneity in cancer patients, allows scientists to study evolution of therapeutic resistance in individual patient, to determine the most effective treatment options and to evaluate new therapies action. This personalized pre-clinical trial will ideally speed up the process of clinical trials. Overall, PDX models represent state-of-the-art mouse models in cancer research.
To date PDX models have been established from different types of cancer including: breast, gastric, ovarian, lung, prostate, colon, and pancreatic cancers [80-83]
Despite the recent increased interest in cholangiocarcinoma, human CCA models derived from tumor patients have not been still developed. Recently it has been published a study that could act as a pioneer in this field, in which a patient derived ICC model with KRAS mutation, derived from a patient of Italian origin, has been established and characterized. [84] The development of such models could provide a reliable tool to study the pathogenesis of this cancer and to test the efficacy of new drugs.
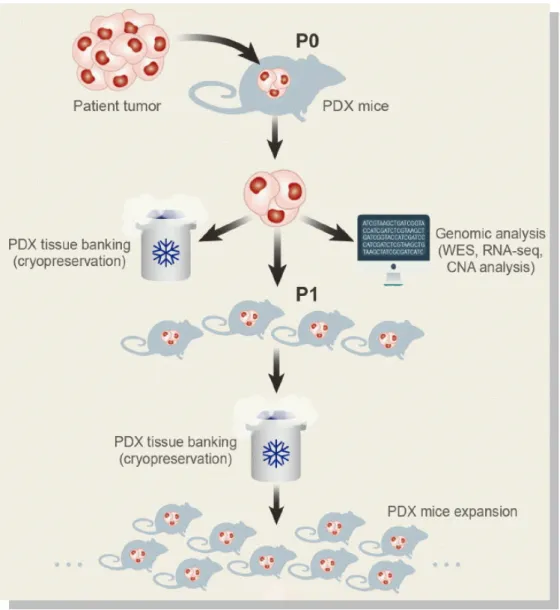
Figure 7 Schematic of patient derived xenograft models. Tumor specimens are collected
from surgery or biopsy procedures in cancer patients. Tumor cells can be either engrafted and propagated in immunocompromised mice directly. Ideally, genomic analysis and cryopreservation will be conducted before engraftment.[85]
AIM OF THE STUDY
The purpose of this study is to evaluate whether the intratumoral expression of hENT1, besides being a predictive factor of response to adjuvant gemcitabine chemotherapy in ICC (as we have previously shown) may also represent a prognostic factor in ICC and may be related to the expression of tumor aggressiveness markers such as Ki67 and p53.
The research project also has the objective to establish and molecularly characterize some ICC PDX models for future pharmacologic studies.
MATERIALS AND METHODS
Patients characteristics
A total of 40 patients affected by intrahepatic cholangiocarcinoma (median age 64±10 years) recovered at Sant’Orsola- Malpighi Hospital of Bologna and undergone surgery at curative intent from January 2012 to June 2016 were included in the study.
Tumor and matched normal liver tissues were collected only after Ethical Committee approval for the study and patient’s written informed consent. For each patients four samples of normal liver and four samples of tumor tissue were collected from fresh liver resection; two samples were immediately frozen in liquid nitrogen while the reminders were immersed in RNAlater® Stabilizat ion So lut ion (Ambio n, Thermo Fisher Scientific, Waltham, MA USA) for at least 4 hrs and frozen at -80°C.
DNA and RNA extraction
Total RNA and DNA, from samples tissue samples was extracted using AllPrep DNA/RNA Mini Kit (Qiagen, Valencia, CA), according to instructions of the manufacturer. Differently, in Huh-28 and SNU-1079 cell lines, total DNA/RNA was extracted by means of TRIzol® Reagent (Invitrogen, Milan, Italy). Nucleic acids were quantified by spectrophotometer.
PCR analysis
In all tumor and matched normal liver, the presence of hENT1 gene (SLC29A1) was evaluated by PCR analysis of the PWN region, a highly conserved motif. [86]
PCR primers for PWN region were designed with Primer3 as follows: forward 5′-CCCATCTTTCCTCCTCCATT-3′; reverse 5′-CTCTTTCCCTGCCTACCA-3′. A long-range PCR was performed using the Expand-Long Range PCR kit according to the manufacturer's instruction (Roche Diagnostics) using 40 ng of genomic DNA from tissue samples with the following PCR cycles (35): 95°C 10′; 95°C 30′′; TM 30′′; 72°C 40’′; 10°C to infinity.
Reverse transcription and real-time PCR
After whole RNA quantification by spectrophotometer, 0,5 μg of RNA for each sample were reverse transcribed using ImProm-II™ Reverse Transcriptase (Promega Corporation, Madison, U.S.A) following the manufacturer's protocol.
Real-time PCR for hENT1 was performed by TaqMan approach with TaqMan® Universal PCR Master Mix (ThermoFisher) in an iCycler iQ™ Real-Time PCR DetectionSystem (Applied Biosystems, Carlsbad, CA, USA). Fluorogenic probe specific for hENT1 was purchased from Life Technologies (Carlsbad, CA, USA). Each sample was analyzed in triplicate. The reactions were incubated at 50° for 2 min; 95°C for 10 min followed by 40 cycles of 95°C for 15 s and 60°C for 1 min. Primers for SYBR Green real-time RT-PCR
analysis of TP53 was purchased from Applied Biosystems (Assay on Demand), For these
primers it was applied the following cycling conditions: 50° for 2 min; 95°C for 10 min
followed by 40 cycles of 95°C for 15 s and 60°C for 1 min. The relative amount of the target mRNA was calculated according to the 2 − (ΔCt target mRNA- ΔCt control) formula, using human glyceraldeide-3-phosphate dehydrogenase (GAPDH) mRNA as housekeeping gene. [87]
Tissue microarray and immunohistochemistry
Tissue microarray (TMA) was constructed from archival formalin-fixed, paraffin-embedded tissue samples from each patient. To account for putative intra-tumour heterogeneity in iCCA [88] for each case three representative neoplastic (and two matched normal liver) cores were assembled in the TMA block. Immunohistochemistry (IHC) for hENT1, Ki67 and p53 was performed on serial 3-μm-thick sections with anti-SLC29A1 (GeneTex, Inc. San Antonio, TX), anti-Ki67 (clone 30-9, Ventana Medical Systems, Tucson, AZ, USA) and anti-mutant p53 (Abcam; USA) antibody, respectively.
IHC for hENT1 was carried out with Novolink Polymer Detection System (Leica Mycrosystems, Germany), as previously reported [59] hENT-1 cellular localization was recorded in all TMA cores and hENT-1 was considered localized on cell membrane when at least two positive TMA cores were observed for each patient.
IHC for Ki67 and p53 was performed using a Benchmark Ultra immunostainer (Ventana/ Roche) according to the following protocol: a) dewaxing; b) antigen retrieval in Cell Conditioning 1 for 36 min at 95°C; c) incubation with primary antibody for 32 min at 37°C; d) development using the UltraView Alkaline Phosphatase Red detection kit and
counterstaining in haematoxylin II. Ki67 and p53 were considered to be overexpressed when there were ≥10% positive stained nuclei in each core. For each patient, the overall Ki67 labelling index was obtained from the mean value of three TMA cores. IHC analysis was performed by one dedicated pathologist, blinded to patients’ clinical characteristics and outcome.
Cell lines, culture conditions and drug treatments
The human iCCA cell lines SNU-1079 and Huh-28 were obtained from Korean Cell Line Bank (KCLB) (Seul, Korea). All cell lines were cultured RMPI’s Medium with 4.5 g/L glucose (Euroclone, Milan, Italy), supplemented with 10% (v/v) heat-inactivated FBS (Euroclone), 2 mM L-glutamine, 100 U/ml penicillin and 100 µg/ml streptomycin (Sigma-Aldrich, St. Louis, MO, USA). Cells were grown at 37°C in a humidified atmosphere of 95% air and 5% CO2 and routinely passaged using trypsin-EDTA 0.025% (Sigma-Aldrich).
To stimulate p53 accumulation, Actinomycin-D (Biovision, Mountain View, CA, USA) was used at a final concentration of 8 NM and the treatment was carryed out for 8h .
Immunocytochemistry
Huh-28 and SNU-1079 cells were seeded (250.000 cells/well) on a slide in a 6 well plate and let grow for 24h. After a wash with PBS, cells were fixed with paraformaldehyde (4%) for 5’ at room temperature. Cells were then washed with PBS, permeabilized with 0.5% Triton X-100 for 4 minutes, washed with PBS, and incubated with PBS-BSA 3% for 30’ and successively with primary anti-hENT1 antibody (GeneTex, Inc. San Antonio, TX) diluted 1:100 at 4 C overnight. Following primary antibody incubation, cells were washed with PBS and incubated with secondary antibodies for 1 hour at room temperature.
Following secondary antibody incubation, cells were washed with PBS and then once with dH2O. Finally, cells were developed in 3,3′-diaminobenzidine and counterstained with haematoxylin.
Transient transfection of siRNA
The day before transfection, SNU-1079 cells (2X10⁵) and Huh-28 cells (1X10⁴) were seeded in a 6 well plate and in a 24 well plate respectively in antibiotic-free growth medium. Transfections were performed with Lipofectamine RNAiMAX (Invitrogen) in Opti-MEM medium (Invitrogen) following the manufacturer's protocol. The TP53 gene was silenced by using a pool of different siRNAs from Invitrogen targeted against different parts of the mRNA; siRNAs were transfected to a concentration of 0,5 µg/well for 4h. At the end of incubation the medium was replaced with fresh antibiotic-free growth medium. The hENT1 gene was silenced by using Trifecta® RNAi Kit (IDT, Coraville, US) for 48 and 72h following the manufacturer's protocol; in each experiments control cells were transfected with equal amounts of non-specific siRNA control (SCRAMBLE).
Cell Viability Assay
Cell viability experiments were carried out by 3-[4,5- dimethylthiazol-2-yl]-2,5-diphenyltetrazolium bromide (MTT) assay. Briefly, Huh-28 (7.500 cells/well) and SNU-1079 (10.000 cells/well) cells were plated in a 24-well plate in triplicate and allowed to adhere for 24h. Then cells were treated with hENT1 siRNA as above described. After transfection, cells were grown for 96h; at the end MTT was added to each well and cells incubated at 37°C for 4 h. Formazan crystals were then dissolved by DMSO addition. Absorbance was then measured at 570 nm in a spectrophotometer (Thermofisher, USA).
Cell Cycle Analysis by Flow Cytometry
For the analysis of DNA content, Huh-28 and SNU-1079 (4x10⁵ cells) cells were seeded in 25 cm3 flasks and allowed to adhere for 24h. Then cells were treated with hENT1 siRNA as above described for 48 and 72 h. Cells were successively harvested by trypsinization, washed with cold phosphate-buffered saline (PBS) and incubated at 4°C for 16h in the DNA-staining solution (containing 0.1% Triton X-100, 0.1% sodium citrate and 50 μg/ml propidium iodide). At the end of incubation, cells were harvested, washed in PBS and DNA content analysis was performed by FACSAria™ cell sorter (Becton Dickinson, Franklin Lakes, NJ). The CellQuest
program was used to quantify the distribution of cells in each cell cycle phase: G1, S and G2/M.
Western blot analysis
Tissues and cell line proteins were extracted in RIPA Lysis & Extraction Buffer (Gbiosciences, St. Louis, MO, USA) added with complete protease inhibitors cocktail (Roche Diagnostics, Milan, Italy) following manufacturer’s instructions.
In cell lines total cytosolic and membrane protein fractions were extracted using compartmental protein extraction kit (Millipore) according to the manufacturer's instructions. Equal amounts of protein extracts were separated in a 12% SDS-PAGE and transferred onto 0.45-µm-pore-size nitrocellulose (Amersham Biosciences, Buckinghamshire, UK). After blocking with 5% dry milk for 1 hour at room temperature, nitrocellulose membranes were rinsed in TBS-T and were incubated overnight at 4 °C with primary antibodies. The following primary mouse monoclonal antibodies were used: p53 (Novocastra) diluted 1:1000, anti-p21 diluted 1:1000 (Dako, Glodstrup, Denmark) and anti-β-actin (Cell Signaling, Danvers, MA, USA) diluted 1:1000. The following primary rabbit monoclonal antibodies were used: primary antibody rabbit polyclonal anti–hENT1 (GeneTex), anti–[beta]-actin antibody (Cell Signaling, Danvers, MA, USA). Membranes were washed and incubated for 1 h in the presence of specific horseradish peroxidase-labelled secondary antibody. After several washings, the horseradish peroxidase activity was detected using enhanced chemiluminescence kit and was revealed on Hyperfilm-enhanced chemiluminescence films (Amersham, Arlington Heights, IL, USA). ImageJ software (National Institutes of Health, Bethesda, MA, USA) was used to calculate the relative expression of proteins
Establishment and characterization of patient derived xenograft (PDX)
Tumor samples were obtained from 4 patients subjected to surgical resection for ICCA. Biological material was obtained from patients who have signed the informed consent, following institutional review board-approved protocols. We have overall implanted 4 fresh tumor specimens from ICCA patients, all were primary tumors. For PDX establishment, NOD (Non-Obese Diabetic)/ Shi-SCID (severe combined immunodeficient) female mice (4–6 weeks old) (XenTech, Évry, France) were maintained under sterile conditions in
micro-isolator cages at the animal facilities of XenTech. Mice were subcutaneously grafted with a fragment of 4x4 mm of representative tumor; after tumor reached an adequate volume it was explanted and re-implanted in new mice. The expression of biliary markers Cytokeratin (CK) 7, 17, 19, and epithelial membrane antigen (EMA) will be evaluated by immunohistochemical analysis.
Statistical Analysis
Statistical analysis of the continuous variables were expressed as mean (SD) and compared with the Student’s t-test or Mann-Whitney U test. Categorical variables were reported as numbers (percentages) and compared with the Pearson’s chi-square test or the Fisher’s exact test, according to Cochran’s rule.
In view of the small study population, we used propensity score analysis to control for baseline covariates. We defined the propensity score as the probability of a patient expressing membrane hENT1 given a set of possible confounders [89]. To estimate the propensity score we fitted a probit model including age, gender, tumor size and extent (T), regional lymph nodes (N), distant metastases (M), histological grade, microscopic resection margins.
To compare different groups of patients or tumours, the Mann–Whitney test (for continuous variables) or the ANOVA test (for independent variables) was applied. All analyses were carried out with SPSS software for Windows (v. 20).
RESULTS
Analysis of hENT1 expression in intrahepatic cholangiocarcinoma affected
patients
Very little is known about expression and localization of hENT1 in iCCA and normal liver. To better clarify this issue, we analyzed hENT1 mRNA and protein expression in a group of 40 iCCA tissue samples and matched normal livers.
The western blot analysis showed that 28 tumor samples expressed, although in different quantities, hENT1 protein, while only 12 out of the 40 samples analyzed resulted negative for its expression. Notably compared to tumor tissue, the normal liver was found to not express hENT1 in all cases analyzed (Figure 8 A). Normal liver seemed to be negative for hENT1 expression independently from the expression of hENT1 in the corresponding tumor, as demonstrated by TMA immunohistochemistry analysis reported in Figure 8 B. Of note, both normal bile duct (black arrows) and hepatocytes (red arrows) resulted completely negative for hENT1 expression. (Figure 8 B: a, b, c)
Figure 8 Expression of hENT1 in iCCA and matched normal livers. A) Western blot analysis
of hENT1 expression in 40 iCCAs (T) and matched normal livers (N). B) TMA immunohistochemestry of hENT1 in 3 different iCCAs expressing different levels of the
transporter: negative (T12), medium (T24) and high (T7) and matched normal liver (10X). 20X magnification (Figure a, b, c) showing normal bile ducts (black arrows) and hepatocytes (red arrows) completely negative for hENT1 expression.
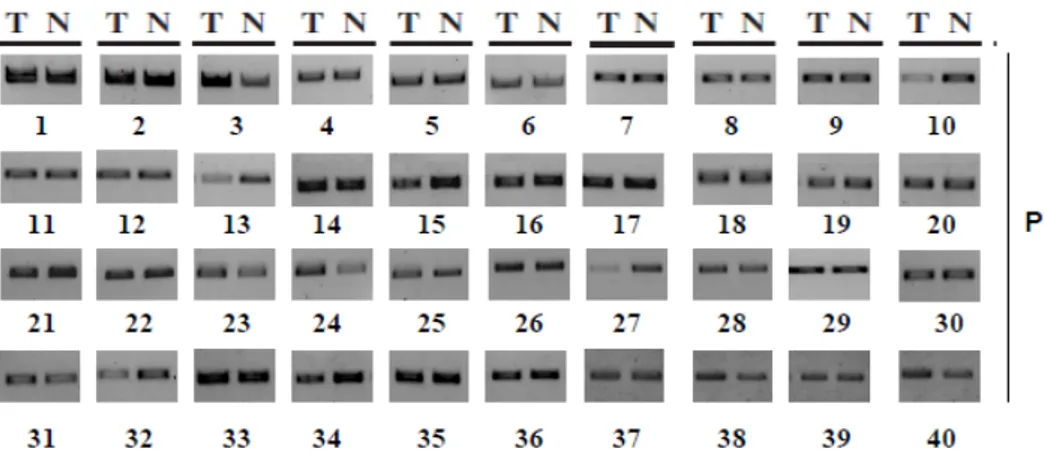
PCR analysis revealed the presence of PWN (one of the most conserved regions in the coding sequence of hENT1 gene in all 40 tumor samples of iCCA and matched normal liver samples, suggesting the existence of hENT1 transcriptional repressing mechanism in normal liver compared to tissues. (Figure 9)
Figure 9 PCR analysis of PWN sequence in iCCA samples.
Immunohistochemistry analysis of hENT1 and Ki67 expression in iCCA
TMA immunohistochemistry analysis for the expression and localization of hENT1 in iCCA tissue samples revealed that 28 patients were positive for hENT1 expression while 12 resulted negative.
Considering the physiological role of hENT1 as nucleosides carrier of the cytoplasmic membrane, we investigated the possible correlation between hENT1 expression and the Ki67 proliferation marker. Out of 40 patients, 27 resulted negative for the expression of hENT1 on cell membrane while 13 resulted positive. The clinic pathological variables between the two groups are reported in Table1. Successively the evaluation of the expression of Ki67 between the two groups demonstrated that independently of hENT1 expression in tumor cells (negative, medium or high) the expression of ki67 was greater in the tumors positive for
hENT1 expressed on the cell membrane. (Figure 10A). Box-plot and statistical contingency analysis showed that the expression of hENT1 on cell membrane was significantly correlated with high percentages of ki67 positive cells (p<0,0001). (Figure 10 B and 10 C)
Notably Roc Curve showed that iCCAs with a percentage of Ki67>15% had specificity of 100% to express hENT1 on the cell membrane. Furthermore, although statistical analysis for tumor size between hENT1 membrane positive and negative groups did not reached a statistical significance, we observed that all tumors with higher tumor size were present in the membrane positive sub-group.
C
0 (0%) 13 (100%)
Membrane hENT-1 positive
< 0.0001 22 (82%)
5 (18%)
Membrane hENT-1 negative
P-value * ki67 < 10%
ki67 ≥10%
0 (0%) 13 (100%)
Membrane hENT-1 positive
< 0.0001 22 (82%)
5 (18%)
Membrane hENT-1 negative
P-value * ki67 < 10%
ki67 ≥10%
Figure 10 Analysis of hENT1 and Ki67 expression in iCCA. A) Expression of Ki67 in three cases of iCCA specimens that express hENT1 differently: negative (T3), positive for the cytoplasm (T15) and positive for cytoplasmatic membrane (T18); detailed are shown at bigger enlargement (a, b, c). B) Box plot analysis of Ki67 expression in iCCAs positive or negative for hENT1 cytoplasmatic membrane. C) Chi-Squared Test showing that all iCCAs with hENT1 on cell membrane have a high percentage of ki67 positive cells
Role of membrane hENT1 in cell growth
To verify the putative correlation between membrane hENT1 and cell proliferation, we firstly evaluated the localization/expression of the transporter in two iCCAs cell lines, Huh-28 and SNU-1079.
Western blot and immunocytochemistry analysis of both cytosolic and membrane fractions are showed in Figure 11. Although both cell lines expressed hENT1 in the cytoplasmic fraction, only Huh-28 cells expressed hENT1 on cell membrane. Both cell lines were chosen for subsequent analysis.
Figure 11 Western blot (A) and immunocytochemistry (B) analysis of hENT1 protein expression in the cytosolic and membrane fraction of iCCA cell lines
In order to test the role of membrane hENT1 in cell growth, Huh-28 and SNU-1079 cells were transiently transfected with siRNA hENT1. As reported in Figure 12 B the silencing of hENT1 in Huh-28 cells was efficient at 72h while in SNU-1079 cells it was efficient at 48h, as shown by qRT-PCR and western blot analysis.
Cell viability assay (Figure 12 C) showed that Huh-28 cell number was significantly reduced after 72h-96h in siRNA hENT1 cells compared to scramble, differently in SNU-1079 cells no effect on cell viability was detected in silenced cells compared to Scramble.
The analysis of cell cycle in Huh-28 cells reported a significant increase of cells in G0/G1 phase and a significant accumulation of cells in Sub-G0 area in silenced cells; instead no evident changes in SNU-1079 cell cycle were.
To establish if the accumulation of cells in Sub-G0 area resulted from apoptotic cascade activation, we analysed the caspase-3 expression in both cell lines. The western blot results
(Figure 12E) demonstrated the expression of cleaved (active) caspases-3 protein in Huh-28 silenced cells after 72h but any activation of caspases-3 was detected in SNU-1079 neither at 48h nor at 72h.
Figure 12 Analysis of hENT1 expression and cell viability in Huh-28 and SNU-1079 cell line after
hENT1 silencing. B) mRNA fold change and protein expression of hENT1; C) Results of cell viability test; D) cell cycle analysis results; E) Valuation of the activation of apoptotic cascades trough caspase-3 expression analysis.
p53 and hENT1
The immunohistochemistry analysis of 120 TMA cores of 40 iCCAs has permitted to observe the expression of hENT1 in iCCAs. Stratifying the 40 iCCAs basing on hENT1 intensity of expression (negative, moderate and high) resulted that 16 iCCA were completely negative, 12 were positive with moderate signal intensity and 12 were positive with high signal intensity. Analysis of mutated p53 of these same iCCAs serial sections revealed a strong correlation between the increase of p53 mutated cells and hENT1 expression (p<0,0001). (Figure 13) Overall, these findings suggest that high hENT1 expression in cholangiocarcinoma tumor cells correlates significantly with high levels of mutated p53 protein.
Figure 13 Analysis of hENT1 and mutated p53 expression in iCCA. A) Expression of
mutated p53 in three representative cases of iCCA specimens expressing hENT1 different hENT1 staining: negative (T3), medium (T11) and high (T27) (magnification 10X) B) Box-plot analysis of % p53 mutated cells in iCCAs according to different hENT1 expression: negative, moderate or high (p <0.0001)
P53 and hENT1 expression in iCCA cell lines
To examine the relationships between the expression of hENT1 and the expression of mutated p53, each protein was measured in two different iCCA cell lines. The Huh-28 cell lines and SNU-1079 were chosen according to the data in the literature [90, 91] and in COSMIC database, which reported a wild-type p53 for SNU-1079 cells and TP53 somatic mutation for Huh-28 cell line. The analysis of the expression of p53, p21/WAF1 (whose expression is directly induced by the p53 wild-type protein) and hENT1 was carried out on both of iCCAs lines.
The results obtained by western blot analysis (Figure 14 A) carried out with a p53 antibody recognizing both wild type and mutated p53, showed that both cell lines express the p53 protein but only SNU-1079 line expresses high levels of p21. These results allowed us to verify that the actual accumulation of p53 in Huh-28 was due to a mutation and not to the protein overexpression and stabilization, confirming the data previously reported.
To establish if the expression of hENT1 could be correlated to mutated p53 protein, both cell lines were transfected transiently using specific siRNA for the p53 protein. The analysis of mRNA conducted after 48h of treatment using qRT-PCR allowed us to verify the effectiveness of silencing. (Figure 14 B)
The quantification of hENT1 mRNA in the same samples demonstrated that, as expected, the expression of the transporter significantly increased in siRNA p53 cells compared to scramble. These results were also confirmed by western blot analysis. (Figure 14 B)
Additionally qRT-PCR analysis carried out treating the cells with Actinomycin-D (a drug able to stabilizes p53 at low concentration) for 8h. The results obtained showed that the mRNA level of p53 in the cells treated with Actinomycin-D results equal to that of the untreated control (Actinomycin stabilizes the p53 protein but it doesn’t increase the transcription of the TP53 gene) while the mRNA of hENT1 decreased of 36% in treated cells compared to the control cells. (Figure 14 C)
This effect was also confirmed at protein level by western blot analysis that showed an increased expression of wt p53 in treated SNU-1079 cells compared to the control. Notably a significant decrease in the expression level of hENT1 was observed. (Figure 14C)
Figure 14 Analysis of p53 and hENT1 expression in iCCA cell lines. A) Western blot
analysis of hENT1, p53 and P21/WAF1 proteins in iCCA cell lines; B) Protein and mRNA change measured after TP53 silencing in SNU-1079 cells; C) Protein and mRNA fold-change measured after treatment with Actinomycin-D in SNU-1079 cells (8nM).
PDX model of iCCA
This preliminary study is aimed at evaluating the feasibility and the reliability of PDX model in iCCA. For this purpose, tumor samples obtained from surgery of iCCAs affected patients were implanted subcutaneously into NOD/SCID mice as previously described in Materials and Methods paragraph.
The characteristics of the patients were summarized in Table 2. Three patients were males and one patient was female with a mean age of 68 years. All the collected samples were primary tumors, which, tested for the presence of HBV and HCV markers, resulted negative.
Three out of four tumors were successfully engrafted in mice at the first generation, after 4 months two tumors reached a volume of 1000 mm3 and were explanted and re-implanted in new mice for a total of four passages for tumor stabilization.
Sample Classification Gender Age HBV/HCV/HIV Tumor Size (cm)
ICC-001 iCCA F 85 NEG 4,6
ICC-002 iCCA M 46 NEG 7
ICC-003 iCCA M 62 NEG 13
ICC-004 iCCA M 79 NEG 3,5
DISCUSSION
There are few data reporting significant biological prognostic markers for iCCA affected patients. There is substantial interest in identifying and validating molecular markers to select patients with a high likelihood of benefiting from specific chemotherapy regimens.
We have previously demonstrated a positive correlation between the expression in tumor cell membrane of hENT1 and response to adjuvant treatment with gemcitabine in patients with iCCA. This data suggests a predictive role of hENT1 in patients with iCCA treated with adjuvant Gemcitabine [56]. Physiologically hENT1 is necessary for the cellular uptake of nucleosides, which have an important role of nutrients and metabolites and are crucial for cells and tissues growth. Recent studies reported as the high intratumoral expression of hENT1 seems to be associated with a worse prognosis in patients with pancreatic cancer [60] and how the expression of the transporter result, in patients affected of carcinoma of the ampulla of Vater, strongly correlated with the marker of cell proliferation, Ki67. [61]
In this study, we aimed to evaluate whether the intratumoral expression of hENT1, besides being a predictor of response to adjuvant chemotherapy with gemcitabine in iCCA may also represent a prognostic factor in this cancer and may be related to the expression of tumor aggressiveness markers such as Ki67 and p53.
The analysis of hENT1 protein expression in iCCA highlighted the presence of hENT1 in tumor tissues but not in the matched normal livers. However, the evaluation of the gene coding for hENT1 revealed the presence of PWN conserved motif in all the samples analysed (iCCAs and matched livers), suggesting the possible existence of a transcriptional regulation in normal liver able to inhibit hENT1 protein expression.
Indeed, in normal conditions liver is silent, with a very slow turnover of hepatocytes and cholangiocytes (life-span: ~200-300 days), for this reason this finding could be plausible considering the physiological role of hENT1, a transporter necessary for nucleosides uptake and consequentially for cell growth. Differently, tumor cells present a high turn over and during cell proliferation hENT1 transporter is necessary for nucleosides uptake.
This study has also permitted to evaluate the role of membrane hENT1 in iCCA cells growth. The immunohistochemistry analysis on 40 patients affected of iCCA revealed that in tumor tissues hENT1 protein could be differently expressed (negative, moderate or high) but surely,
in order to carry out its role of nucleoside transporter, it has to be expressed on cell membrane.
Interestingly, we demonstrate a significant positive correlation between the membrane hENT1 expression and of ki67 score. Actually, tumors with membrane hENT1 result all characterized of high percentage of ki67 and, despite no significativity was reached, higher size (cm) at surgery resection.
This positive correlation indicates that hENT1 protein localization may be correlated with proliferation rate of malignant cells. As a working hypothesis, we propose that membrane hENT1, by allowing nucleosides to enter the cells through the plasma membrane, control DNA synthesis and therefore proliferation activity.
To better investigate the putative role of membrane hENT1 in cell growth we used iCCA cells to explore the expression of the transporter and its function in cell proliferation. Trough western blot analysis and immunocytochemistry, Huh-28 cell line demonstrated to express hENT1 on cell membrane, while SNU-1079 expressed hENT1 exclusively in cytoplasm. The silencing of hENT1 and the resulting loss of the transporter on Huh-28 cell membrane leads to a significantly reduction of cells number starting at 72h due to cell death. Moreover cell cycle analysis showed significant differences in Huh-28 silenced cells compare to scramble, resulted in an increase of cells in G0/G1 phase and a significant increment of cells in sub-g0 area due to induction of apoptosis. Given that, these results only relate to the cell line that expresses hENT1 on cell membrane, leads to infer that the loss of the transporter expressed in cytoplasm do not affect cell growth and viability.
In this regard, it has been reported [90] how the maintenance of balanced deoxynucleotide triphosphate (dNTP) pool results critical for DNA replication and repair; insufficient supply of nucleosides during DNA replication may entail genetic instability of cells till to cause dysfunctional cell proliferation and cell death.
In these terms, hENT1 would represent the intrinsic cellular key to tumor growth, being consequently related to worse prognosis.
hENT1 mRNA expression and protein levels continued to be poorly understood. hENT1 is variably express within normal tissues and malignant cells. Various factors that influence hENT1 expression have been identified, as hypoxia and differentiation status [91, 92]. Considering our findings, hENT1 expression may be influenced also from cell cycle related factors. One of the main characteristics of cancer cells is the uncontrolled proliferation, usually due to the inhibition of cell cycle controls and apoptosis; evaluating that p53 is one of the protein able to control cell proliferation and is founded mutated in the majority of human


![Figure 6 Simplified scheme of the p53 pathway. [69]](https://thumb-eu.123doks.com/thumbv2/123dokorg/8128521.125758/19.892.154.730.355.670/figure-simplified-scheme-p-pathway.webp)