This is an Accepted Manuscript, which has been through the Royal Society of Chemistry peer review process and has been accepted for publication.
Accepted Manuscripts are published online shortly after
acceptance, before technical editing, formatting and proof reading. Using this free service, authors can make their results available to the community, in citable form, before we publish the edited article. We will replace this Accepted Manuscript with the edited and formatted Advance Article as soon as it is available.
You can find more information about Accepted Manuscripts in the author guidelines.
Please note that technical editing may introduce minor changes to the text and/or graphics, which may alter content. The journal’s standard Terms & Conditions and the ethical guidelines, outlined in our author and reviewer resource centre, still apply. In no event shall the Royal Society of Chemistry be held responsible for any errors or omissions in this Accepted Manuscript or any consequences arising from the use of any information it contains.
Accepted Manuscript
Sustainable
Energy & Fuels
Interdisciplinary research for the development of sustainable energy technologies
V
olume 1
| Number x
|
2017
Sustainable Energy & F
uels
Pages
0000–0000
rsc.li/sustainable-energy
Volume 1 Number 1 2017 Pages 1–100
Sustainable
Energy & Fuels
Interdisciplinary research for the development of sustainable energy technologies
This article can be cited before page numbers have been issued, to do this please use: Y. Ma, Y. Ma, G. Giuli, T. Diemant, R. J. Behm, D. Geiger, U. Kaiser, U. Ulissi, S. Passerini and D. Bresser, Sustainable Energy
Supplementary Information
Conversion/alloying lithium-ion anodes – Enhancing the energy density by
transition metal doping
Yanjiao Ma,a,bYuan Ma,a,b Gabriele Giuli,c Thomas Diemant,d R. Jürgen Behm,a,d Dorin Geiger,e Ute Kaiser,e Ulderico Ulissi,a,b Stefano Passerini,a,b,* and Dominic Bresser a,b,*
a
Helmholtz Institute Ulm (HIU), Helmholtzstrasse 11, 89081 Ulm, Germany b
Karlsruhe Institute of Technology (KIT), P.O. Box 3640, 76021 Karlsruhe, Germany c
School of Science and Technology – Geology Division, University of Camerino, Via Gentile III da Varano, 62032 Camerino, Italy
d
Institute of Surface Chemistry and Catalysis, Ulm University, 89081 Ulm, Germany e
Central Facility for Electron Microscopy, Group of Electron Microscopy of Materials Science, Ulm University, 89081 Ulm, Germany
*Corresponding authors: [email protected] ; [email protected]
Sustainable
Energy
&
Fuels
Accepted
Manuscript
Experimental Section
Materials synthesis. Transition metal (TM) doped SnO2, i.e., Fe-doped SnO2 (Sn0.9Fe0.1O2, SFO), Mn-doped SnO2 (Sn0.9Mn0.1O2, SMO), and Co-doped SnO2 (Sn0.9Co0.1O2, SCO), were synthesized by dissolving 0.001 mol of the corresponding transition metal precursor (iron gluconate dehydrate (Aldrich), manganese (II) acetate tetrahydrate (ACROS), or cobalt (II) gluconate hydrate (ABCR)), and 0.03 mol of sucrose (ACROS) in 100 mL deionized water. Subsequently, 0.009 mol of tin(II) acetate (Aldrich) and 20 mL acetic acid (Aldrich) were gradually added. After stirring the solution for 30 min at room temperature, the water was evaporated at 160 °C, while the sucrose started to be thermally decomposed. The resulting solid precursor was calcined for 3 h under air at 450 °C with an increment of 3°C min-1. The pure SnO2 was prepared analogously without adding the transition metal precursor. For the application of the carbon coating, 1.2 g glucose were dissolved in 80 mL deionized water before adding 800 mg of the corresponding active material (SnO2, SFO, SMO, or SCO) under continuous stirring. The obtained suspension was transferred into a stainless steel autoclave (BERGHOF BR-100) and heated at 180 °C for 13 h under stirring (1000 rpm). The precipitate was collected by centrifugation, washed several times with deionized water and ethanol, and dried at 60 °C overnight. Finally, the dry composite was thermally treated at 500 °C for 4 h under argon atmosphere (heating rate: 3°C min-1).
Physicochemical characterization. The crystal structure of the samples was investigated via powder
X-ray diffraction (XRD) using either a Bruker D8 Advance (Cu-Kα1 radiation, λ = 0.154 nm) or an automated Philips Bragg-Brentano diffractometer equipped with a graphite monochromator. For the latter, the long-fine focus copper tube was operated at 40 kV and 25 mA and the patterns were recorded in a 2θ range of 20-145° with a step size of 0.03° and a counting time of 14 s. For the refinement of the XRD data, the program GSAS was used1. The shape of the reflections was modeled with a Pseudo-Voigt function and the FWHM (full width at half maximum) was refined as a function of 2θ taking into consideration the Gaussian as well as the Lorentzian broadening. The refinement was conducted for the space group P42/mnm using the starting atomic coordinates reported by Bolzan et al.2 and an initial value for the isotropic temperature factors (Uiso) arbitrarily chosen as 0.025Å2. The O atom sites were designated as fully occupied, while constraints for fractional occupancies for Sn, Fe, Mn, and Co were used according to the stoichiometry of the synthetized samples. The background was modeled applying a 9-terms polynomial function. This function, the cell parameters, and the scale factor were set as free variables during the refinement. Additional parameters were added for the refinement in the following order: 2θ zero-shift, peak shape, peak asymmetry, atomic coordinates, and isotropic thermal factor. The intensity cut-off for the calculation
of the profile step intensity was initially set to 1.0% of the peak maximum and eventually lowered to
Sustainable
Energy
&
Fuels
Accepted
Manuscript
Nonetheless, these values are presumably too optimistic, since they do not include the potential correlation between different parameters and other potential error sources such as, for instance, the overlapping of reflections. To get an alternative estimation of the accuracy of the thus refined data, we compared the obtained set of parameters applying different refinement strategies on the same set of data. This comparison revealed that a more realistic estimation of the errors bars are approximately ±0.0005 Å for the cell parameters and ±0.005 Å for the selected interatomic distances, while the potential error for the determination of any phase content is ±1 wt%. Employing anisotropic thermal parameters resulted in a slight reduction of all the disagreement indexes reported herein, but the unit cell parameters as well as the individual interatomic distances remained unaffected. In this manuscript, we provide the results obtained using isotropic temperature factors in the refinement procedure. Raman spectra were collected with a 532 nm laser excitation and a power of 20 mW using a Renishaw 2000. Each spectrum was taken as the average of three accumulations with 60 seconds of acquisition. X-ray photoelectron spectroscopy (XPS) measurements were carried out in a PHI 5800 Multi Technique ESCA system (Physical Electronic, USA). The spectra were acquired using monochromatic Al Kα (1486.6 eV) radiation, a take-off angle of 45°, and pass energies at the electron analyzer of 29.35 and 93.9 eV for the detail and survey scans, respectively. The main C1s peak was used for the binding energy calibration and set to 284.8 eV, corresponding to adventitious carbon on the surface of the powder samples. The particle morphology was studied by transmission electron microscopy (TEM, JEOL JEM-3000) and high-resolution transmission electron microscopy (HRTEM, image Cs-corrected FEI Titan 80-300 kV at 300 kV). UV-vis DRS spectra were recorded with a UV-vis spectrophotometer (Shimadzu UV-2600). The specific surface area was determined by means of nitrogen gas adsorption based on the Brunauer-Emmett-Teller (BET) method, utilizing an Autosorb-iQ (Quantachrome). TGA (TA Instruments Q5000) was performed at a heating rate of 5 °C min-1 under O2 atmosphere.
Electrochemical characterization. The overall electrode composition was: 75 wt% active material,
20 wt% conductive carbon (Super C65®, TIMCAL), and 5 wt% sodium carboxymethyl cellulose (CMC, Dow Wolff Cellulosics). For the slurry preparation, CMC was dissolved in ultrapure water (1.25 wt% solution) and subsequently the Super C65 and the active material were added. The resulting mixture was dispersed by planetary ball milling for 2 h. Subsequently, the electrode paste was cast on dendritic copper foil (Schlenk, 99.9 %) with a wet film thickness of 120 µm using a laboratory doctor blade. After drying overnight at room temperature, disc-shaped electrodes (ø = 12 mm) were cut and dried under vacuum at 120 °C for 24 h. The electrode active material mass loading was around 1.5 mg cm-2. The electrochemical performance was evaluated in three-electrode Swagelok-type cells using lithium foil (Rockwood Lithium, battery grade) as counter and reference electrodes. Cells were assembled in an argon-filled glove box (MBraun UNIlab, H2O and O2 content < 0.1 ppm). The electrolyte consisted of a 1M solution of LiPF6 in ethylene carbonate/diethyl carbonate (EC/DEC, 3:7 by volume). Prior to the electrochemical characterization, the cells were allowed to rest for 6 h.
Sustainable
Energy
&
Fuels
Accepted
Manuscript
Cyclic voltammetry (CV) was carried out using a VMP3 potentiostat (BioLogic), applying 0.01 and 3.0 V as reversing potentials. Galvanostatic cycling (GC) tests were performed by means of a battery tester (Maccor 4300), setting the cut-off voltages to 0.01 and 3.0 V vs. Li/Li+. All electrochemical measurements were performed in thermostatic climatic chambers at a temperature of 20 ± 1 °C. It is important to note that the mass of the carbon coating for SnO2-C, SFO-C, SMO-C, and SCO-C was included for the calculation of the specific capacity.
In situ XRD analysis. The in situ XRD experiments were carried out employing a self-designed in situ
cell.3–5 The composition of the eventually obtained electrodes was the same as for those used for the electrochemical characterization described earlier. In this case, however, the electrode paste was cast directly onto the beryllium (Be) disk with a thickness of 250 µm, acting simultaneously as current collector and “window” for X-ray beam. The coated Be electrode was dried at 50 °C under vacuum for 12 h. Lithium foil served as counter and reference electrode, while two layers of glass fiber (GF/D, Whatman) soaked with 500 µL of the electrolyte were used as separator. The in situ cell was allowed to rest for 12 h before starting the measurement. Galvanostatic cycling was performed using a potentiostat/galvanostat (SP-150, BioLogic), applying a specific current of 40 mA g-1 within the 0.01 to 3.0 V voltage range. XRD analysis was carried out in a 2θ range of 20-80° with a time per scan of around 30 min.
Sustainable
Energy
&
Fuels
Accepted
Manuscript
Table S1. Structural parameters, average crystallite size, and disagreement indexes of the conducted
Rietveld refinement for the XRD patterns of SnO2, Sn0.9Co0.1O2, Sn0.9Fe0.1O2, and Sn0.9Mn0.1O2,
employing isotropic temperature factors and isotropic broadening of the reflections (potential errors are provided in brackets).
SnO2 Sn0.9Co0.1O2 Sn0.9Fe0.1O2 Sn0.9Mn0.1O2 a0 (Å) 4.7399(1) 4.7403(1) 4.7392(1) 4.7367(1) c0 (Å) 3.1870 (1) 3.1856(1) 3.1853(1) 3.1836(1) V0 (Å 3 ) 71.601 (2) 71.582(1) 71.503(1) 71.428(1) M-O (2x) 2.0279 2.0199 2.0037 2.029 M-O (4x) 2.0716 2.0764 2.0854 2.068 W Rp 6.63 6.22 6.83 5.73 Rp 5.27 4.77 5.26 4.43 RF2 2.47 2.12 3.51 1.85 RF 1.44 1.14 2.03 1.02 c0/a0 0.6724 0.6720 0.6721 0.6721 W.-H. intercept1 0.0047 0.0124 0.0094 0.0090 W.-H. slope1 0.0017 0.0018 0.0014 0.0025 Crystallite size (nm) 30 11 15 16 1
Fitted intercepts and slope of the Williamson-Hall (W.-H.) plots, obtained by using the refined peak shape parameters.
Sustainable
Energy
&
Fuels
Accepted
Manuscript
Figure S1. XPS survey spectra for (a) SnO2, (b) SFO, (c) SMO, and (d) SCO, confirming the presence
of tin and oxygen in all four samples and, in addition, iron, manganese, and cobalt for SFO, SMO, and
SCO, respectively.
Sustainable
Energy
&
Fuels
Accepted
Manuscript
Figure S2. (a) Raman spectra of SnO2, SFO, SMO and SCO (from top to bottom; same color coding
as for the XRD patterns in Figure 1a; (b) close-up for the A1g band of SnO2, SFO, SMO, and SCO.
Pure SnO2 (Figure S2a, top panel, in black) shows three bands at around 475, 631, 774 cm-1, corresponding to the Eg (translational), A1g (symmetric Sn-O stretching), and B2g (asymmetric Sn-O stretching) vibration mode, respectively, which is in good agreement with previous reports6,7. For the TM-doped samples, two main findings are observed: (i) The intensity maxima of the bands (in particular the A1g band) are slightly shifted to lower wavenumbers, as highlighted by the vertical dashed line in Figure S2a as well as in the close-up, presented in Figure S2b, which is explained by relatively smaller particle size. (ii) The bands are less intense and broadened, which is assigned as well to the decreased particle size and the reduced symmetry of the crystal structure due to the incorporation of the aliovalent TM dopant as well as the presence of oxygen vacancies to ensure charge neutrality8–13. The presence of oxygen vacancies apparently leads to an oxygen content of less than two oxygen per unit formula, which would be reflected in a slightly modified chemical composition, i.e., Sn0.9TM0.1O2-δ, with δ = 0.05 for a trivalent TM and 0.1 for a divalent TM. However, in the absence of a precise determination of the amount of oxygen vacancies, we continue to refer to Sn0.9TM0.1O2 in the manuscript text.
Sustainable
Energy
&
Fuels
Accepted
Manuscript
Figure S3. Ultraviolet-visible (UV-vis) absorption spectra for pure SnO2, SFO, SMO, and SCO; as
inset the corresponding plots for the determination of the band gap.
The band gap values can be determined according to the following equation14: αhν = A (hν - Eg) n/2
, where Eg is the optical energy band gap, hν is the photon energy, α is the absorption coefficient, and A is a proportionality constant; n is equal to 1 for a direct gap and equal to 4 for an indirect gap. The values of Eg for direct and indirect transitions can be obtained by linear relation and extrapolation. For pure SnO2, we determined a band gap of 3.64 eV, which is in good agreement with previous studies15,16. Introducing cobalt into the structure leads to a slight decrease to 3.55 eV (SCO) and incorporating iron and manganese results in a further reduced band gap of 3.48 eV (SFO) and 3.37 eV (SMO). Generally, the finding of a reduced band gap for doped tin oxide is assigned to the introduction of anionic vacancies and the potentially mixed oxidation state of the cations12,13,17–20. This would be in good agreement with the Raman and XPS data. If the decrease in band gap, however, would be solely related to the presence of oxygen vacancies, which we assume are essentially a result of the required charge neutrality, the band gap should decrease in the order SnO2 > SMO > SFO > SCO, i.e., along with the average oxidation state. The different order of SnO2 > SCO > SFO > SMO determined here can, thus, only be explained, if we consider the average size of the cationic dopant (low spin values), which is about 0.69 Å for tetravalent tin, 0.66 Å for cobalt (average oxidation state of <3), 0.65 Å for trivalent iron, and 0.64 Å for manganese (average oxidation state of >3), and its impact on the unit cell volume, which is decreasing in the same order. We, thus, conclude that the governing effect in the present case is the potential overlap of electron orbitals due to the shorter
distance between the cations.
Sustainable
Energy
&
Fuels
Accepted
Manuscript
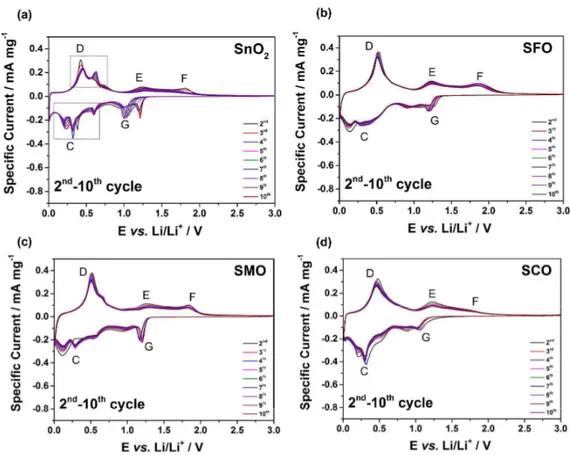
Figure S4. Cyclic voltammograms (2nd to 10th cyclic sweep) for electrodes based on (a) SnO2, (b) SFO,
(c) SMO, and (d) SCO – the first cyclic sweep is presented in Figure 3. In all cases a sweep rate of 0.05 mV s-1 was applied and the reversing voltages were set to 0.01 and 3.0 V vs. Li/Li+.
Following the first cyclic sweep presented in Figure 3, the subsequent CV sweeps reveal several characteristic changes. For pure SnO2 (Figure S4a), the cathodic features (A) and (B) disappear, while a new peak appears at 1.21 V (G), ascribed to the reduction of SnO. The latter, however, shifts to lower potentials before eventually vanishing upon cycling. This shift and vanishing, in combination with the same observation for the corresponding peaks (E) and (F), indicates that the fraction of SnO2 and SnO, formed upon delithiation continuously decreases upon cycling. At the same time, feature (C) and (D) become more distinct during cycling and split up into several peaks, associated with the different alloying and oxide phases, reflecting the formation of larger tin and tin/lithium alloy aggregates21–24, which is effectively suppressed in presence of the transition metal dopants (being in excellent agreement with the in situ XRD results). As a consequence, for TM-doped SnO2, the peaks (G), (E), and (F) appear to be more reversible compared to pure SnO2, while the de-/alloying related features (C) and (D) show less distinct peaks, though this slightly varies between the three samples. SFO (Figure S4b) shows only very broad features, but SMO (Figure S4c) and SCO (Figure S4d) present in addition some more pronounced peaks within this potential range. Generally, however, the TM doping substantially enhances the reversibility of all observed processes.
Sustainable
Energy
&
Fuels
Accepted
Manuscript
Sustainable
Energy
&
Fuels
Accepted
Manuscript
Figure S5. In situ XRD analysis of electrodes based on SnO2 (blue background), SFO (pink
background), SMO (green background), and SCO (yellow background): Panels (a) to (d) present the waterfall diagrams of consecutively recorded XRD patterns (left) and the corresponding galvanostatic dis-/charge profile for the first de-/lithiation cycle (right), all being at the top of the respective column. The scans referring to the different regions, as indicated for the aforementioned dis-/charge profiles
are highlighted by different colors in the waterfall diagram: Region (A) in red, region (B) in blue, region (C) in orange, region (D) in purple, and region (E) in green. Below the waterfall diagrams and the corresponding dis-/charge profiles, close-ups of selected XRD patterns are provided – always in parallel for the four samples (the scale for the y and x axis are always kept constant for all samples to facilitate the comparison among them). Panels (e-h) depict the selected patterns for region (A) for all four electrodes; the given insets show the enlarged y axis between 25.5° and 35°. Panels (i-l) depict the ups of selected XRD patterns for region (B) for all four samples. Panels (m-p) depict close-ups of selected XRD patterns for region (C), panels (q-t) present close-close-ups of selected XRD patterns
for region (D), and panels (u-x) depict close-ups of selected XRD patterns for region (E) for all four samples.
For a detailed analysis of the electrochemical reaction mechanism and the impact of the three dopants, we combined the galvanostatic lithiation and delithiation with XRD (Figure S5). The figure is organized as follows: At the top, the corresponding waterfall diagrams of the recorded XRD patterns are presented in combination with the simultaneously recorded dis-/charge profiles. These are divided in five regions (A) to (E), for which the panels given below present selected patterns – always in parallel for all four samples. Generally, region (A) covers the decrease in voltage from OCV to the onset of the potential plateau. Region (B) covers the potential plateau until the onset of the subsequent sloped profile, which is then referred to as region (C). The charge process is divided in region (D) and (E), while the cut is made when the slope of the potential profile changes.
Focusing on region (A) for SnO2 (Figure S5e; scan 1-4), the evolution of the XRD patterns reveals a slight shift of the cassiterite-related reflections (110), (101), and (200) to lower 2θ values, accompanied by a slight decrease in intensity (as indicated by the arrows in the figure itself as well as in the corresponding inset). Such a shift may be assigned to a minor expansion of the SnO2 lattice, e.g., as a consequence of some lithium ion insertion, while the decrease in intensity may be related to superficial reduction (e.g., the formation of Li2SnO3
25
) – though to a minor extent at such high potentials. A comparison with SFO (Figure S5f), SMO (Figure S5j), and SCO (Figure S5h) indicates that this slight shift and decrease in intensity is more pronounced for the TM-doped samples, following the order SnO2 < SCO < SMO < SFO. As this order is neither the same for the particle size
Sustainable
Energy
&
Fuels
Accepted
Manuscript
(and accordingly the available surface area) nor the determined band gap (i.e., electronic conductivity) nor the oxidation state of the dopant (and, hence, the assumed occurrence of oxygen vacancies), we propose that it is the sum of these characteristics that governs the initial lithium ion insertion and superficial reduction – even though the electronic conductivity appears to play a dominant role. For the following XRD scans corresponding to region (B), pure SnO2 shows a continuous decrease in intensity for all three reflections without any appreciable shift, until the reflections have eventually vanished completely at the end of the potential plateau (Figure S5i; scans 5-17). Concurrently, two new reflections appear at 30.7° and 32.1°, which gradually increase in intensity in the following. These reflections are related to metallic tin (JCPDS Card No. 89-2565), confirming the assignment of the potential plateau to the conversion reaction from SnO2 to Sn0 and Li2O. Essentially the same reaction is observed for SFO (Figure S5j), SMO (Figure S5k) and SCO (Figure S5l), but instead of distinct reflections for the metallic tin phase only a broad “bump” is observed. This suggests that the Sn0 nanograins formed are much smaller in the presence of the TM dopant.
In region (C) for pure SnO2 (Figure S5m; scans 18-50), the Sn0-related reflections vanish again. Furthermore, starting from scan 29 a new reflection appears at around 38.5°, which continuously increases in intensity and slightly shifts to lower 2θ values until it has reached its maximum intensity in the final scan #50. This observation is in good agreement with the formation of the lithium/tin alloy (LixSn with x ≤ 4.4) and an increasing lithium content, causing increasing lattice distances26–28. Similarly, the Sn0-related reflections are decreasing in intensity also for SFO (Figure S5n), SMO (Figure S5o), and SCO (Figure S5p) and a rather broad, new reflection appears at about 38.5°, which is continuously increasing in intensity and shifting to lower 2θ values, indicating that the same reaction occurs also for TM-doped SnO2. Once again, however, the intensity remains generally lower and the reflection is less sharp compared to pure SnO2. Remarkably, this is particularly true for SCO. We may briefly summarize the main findings for the discharge process. Essentially, there are two major findings so far: (i) The presence of the TM dopant substantially decreases the crystallinity and/or particle size of the upon lithiation formed tin and lithium/tin alloy nanograins, while the overall reaction mechanism is the same. (ii) Cobalt appears to favor the nano-crystallinity of these tin phases slightly more than iron and manganese.
For the subsequent delithiation (i.e., charge process) in region (D), the reversed process is observed for pure SnO2 (Figure S5q; scans 51-66). This means that the lithium/tin alloy-related reflection is decreasing in intensity, accompanied by a slight shift to larger 2θ values and the re-appearance of the two reflections corresponding to metallic tin, even though the latter two remain less intense compared to the beginning of region (C). For SFO (Figure S5r), SMO (Figure S5s), and SCO (Figure S5t),
once again the same reaction is observed, but the re-appearance of metallic tin is reflected in a rather
Sustainable
Energy
&
Fuels
Accepted
Manuscript
In region (E), this de-alloying reaction continues for pure SnO2 (Figure S5u; scans 67-80) and, in addition, a new reflection appears at around 33.8°, which indicates the re-oxidation of metallic tin to cassiterite-structured tin oxide. This re-oxidation is further indicated by the appearance of a very broad reflection in the range from 29° to 36°, potentially related to the re-appearance of the (101) reflection. Nevertheless, this re-oxidation remains incomplete, as the Sn0-related reflections do not completely disappear even in the fully charged state (i.e., 3.0 V). As a matter of fact, the reversibly obtained capacity is only 850 mAh g-1, which is substantially lower than the theoretically expected value of 1493 mAh g-1, when considering the alloying and conversion reaction. SFO (Figure S5v), SMO (Figure S5w), and SCO (Figure S5x) show the same trend basically, but no distinct reflections are observed for any of the phases and the re-oxidation is only indicated by the appearance of a very broad reflection in the range from 29° to 36°. The reversibly obtained capacities, however, indicate that the re-oxidation process is significantly enhanced in presence of the TM dopant. For SFO the final charge capacity is 1167 mAh g-1, for SMO it is 1233 mAh g-1, and for SCO even 1337 mAh g-1, which is rather close to the theoretical maxima of 1477, 1478, and 1474 mAh g-1, respectively.
Based on the previous findings we thus assume that the TM dopant forms a continuous percolating network of electronically conductive metallic nanograins, as reported earlier for pure conversion materials29,30. This conductive network favors the occurring electrochemical reactions – both the alloying and conversion – by preventing the formation of relatively large tin and lithium/tin alloy nanoparticles and ensuring the electron transport throughout the whole initial primary particle31. In conclusion, we may summarize the above described findings as follows:
Section A
(OCV to 1.04 V (SnO2) or to 1.08 V (SFO, SMO, SCO); insertion and superficial reduction) Sn1-xTMxO2 + y Li+ + y e- → LiySn1-xTMxO2
Sn1-xTMxO2 + 2z Li+ + 2z e- → z Li2O + Sn1-xTMxO2-z (z < 2)
In fact, if the insertion occurs only at the surface and is accompanied by a partial reduction of the oxide, these two processes may occur simultaneously according to the following reaction mechanism: Sn1-xTMxO2 + (y+2z) Li+ + (y+2z) e- → LiySn1-xTMxO2-z + z Li2O (z < 2)
Section B
(1.04 – 0.73 V (SnO2) or 1.08 – 0.65 V (SFO, SMO) and 1.08 – 0.70 V (SCO); conversion) LiySn1-xTMxO2-z + z Li2O + (4-y-2z) Li
+
+ (4-y-2z) e- → (1-x) Sn0 + x TM0 + 2 Li2O
Section C
(0.73 – 0.01 V (SnO2) and 0.65 – 0.01 V (SFO, SMO) and 0.70 – 0.01 (SCO); alloying) (1-x) Sn0 + 4.4(1-x) Li+ + 4.4(1-x) e- → (1-x) Li4.4Sn
Sustainable
Energy
&
Fuels
Accepted
Manuscript
Section D (0.01-0.83 V; dealloying)* Li4.4Sn → LiwSn + Sn 0 + (4.4-w) Li+ + (4.4-w) e- (0 < w < 4.4) Section E
(0.83-3.0 V; dealloying and re-oxidation)*
For SnO2: LiwSn + Sn0 + Li2O → SnO2-u + Sn0 + Li+ + e- (0 < w < 4.4; 0 < u < 2) For Sn1-xTMxO2: LiwSn + Sn0 + TM0 + Li2O → Sn1-xTMxO2 + Li+ + e- (0 < w < 4.4) or LiwSn + Sn 0 + TM0 + Li2O → SnO2-v + TMvO + Li + + e- (0 < v < 2; v > u)
*These reactions are given in a rather qualitative manner, since the precise fraction of the two tin phases (LiwSn and
Sn0) is not quantifiable from our data. Also, adding many variables will essentially dilute the key message.
For the subsequent charge, i.e., delithiation process, it is assumed that the re-oxidized species are the pure oxides (second equation) rather than a mixed one (first equation) in case of Sn1-xTMxO2, although the final experimental confirmation still needs to be provided.
Sustainable
Energy
&
Fuels
Accepted
Manuscript
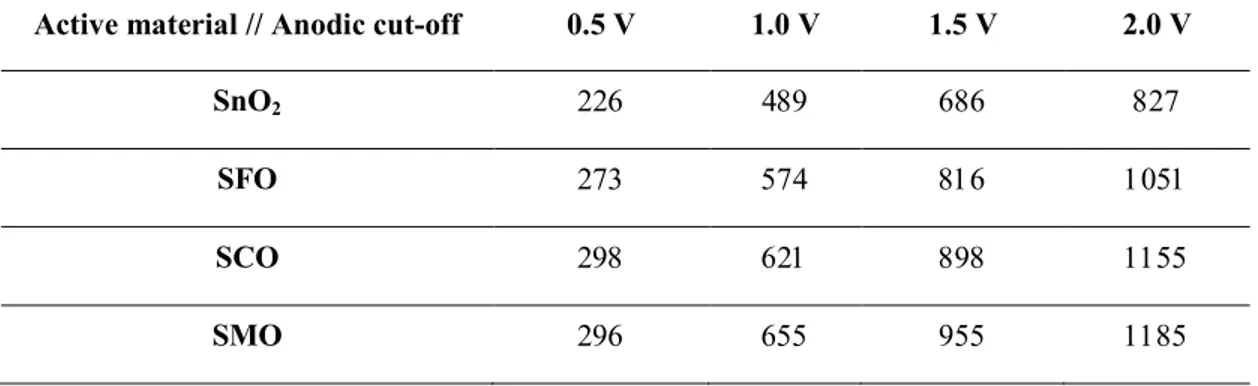
Table S2. Specific capacities (in mAh g-1) for SnO2, SFO, SCO, and SMO as a function of the anodic
cut-off voltage (in V; see also Figure 4c).
Active material // Anodic cut-off 0.5 V 1.0 V 1.5 V 2.0 V
SnO2 226 489 686 827
SFO 273 574 816 1051
SCO 298 621 898 1155
SMO 296 655 955 1185
Table S3. Gravimetric energy densities (in Wh kg-1) for SnO2, SFO, SCO, and SMO as a function of
the anodic cut-off voltage (in V; see also Figure 4d), assuming a theoretical LiNi0.5Mn1.5O4 cathode
with a (constant) discharge potential of 4.7 V and a specific capacity of 140 mAh g-1 (anode/cathode ratio of 1:1 in specific capacity).
Active material // Anodic cut-off 0.5 V 1.0 V 1.5 V 2.0 V
SnO2 374 453 460 454 SFO 403 469 472 461 SCO 411 476 477 463 SMO 411 479 480 472
Sustainable
Energy
&
Fuels
Accepted
Manuscript
Figure S6. TGA curves for the carbon-coated samples (in black) and the corresponding non-coated
sample, serving as reference (in red): (a) SnO2-C and SnO2, (b) SFO-C and SFO, (c) SMO-C and
SMO, and (d) SCO-C and SCO. (e) and (f) Characterization of the carbon-coated samples by (e) Raman spectroscopy and (f) XRD (from top to bottom: SnO2-C (in black), SFO-C (in red), SMO-C
(in blue), and SCO-C (in pink); (f) as reference given in the bottom: JCPDS Card No. 01-077-0447).
The carbon content for the coated samples (denoted as SnO2-C, SFO-C, SMO-C, and SCO-C) was about 16 wt% in all cases (Figure S6a-6d), which has been proven to be a suitable amount of carbon for improving the electrode performance32. The Raman spectra (Figure S6e) show essentially the same
features for all four samples, i.e., the characteristic D- and G-band at around 1350 cm-1 and 1585 cm-1,
Sustainable
Energy
&
Fuels
Accepted
Manuscript
carbon4,35. The obtained XRD patterns (Figure S6f) do not reveal any significant difference compared to those obtained for the non-coated samples (Figure 1a) – apart from a slightly increased crystallinity, presumably, due to the additional thermal treatment to carbonize the glucose precursor.
Sustainable
Energy
&
Fuels
Accepted
Manuscript
Figure S7. Galvanostatic cycling of electrodes based on SnO2 (in black), SFO (in red), SMO (in blue),
and SCO (in pink): (a) Constant current cycling for all four samples at 100 mA g-1, plotting the specific dis-/charge capacity and coulombic efficiency vs. the cycle number (1st cycle not shown); (b) The corresponding dis-/charge profiles for the 10th, 20th, 30th, 40th, and 50th cycle (from top left to bottom right: SnO2, SFO, SMO, and SCO); (c) Comparison of the rate capability (specific capacity vs.
applied specific current; logarithmic scale) – the given capacity values are averaged over 10 cycles
applying the same current; (d) The corresponding dis-/charge profiles for the 5th cycle for each dis-/charge rate (from top left to bottom right: SnO2, SFO, SMO, and SCO).
Sustainable
Energy
&
Fuels
Accepted
Manuscript
Figure S8. Cyclic voltammograms (10 continuous cyclic sweeps) of (a) SnO2-C, (b) SFO-C,
(c) SMO-C, and (d) SCO-C (sweep rate: 0.05 mV s-1; reversing voltages: 0.01 and 3.0 V vs. Li/Li+).
Sustainable
Energy
&
Fuels
Accepted
Manuscript
References
1 A. C. Larson and R. B. Von Dreele, Gen Struct Anal Syst Rep LAUR, 1994, 86–748.
2 A. A. Bolzan, C. Fong, B. J. Kennedy and C. J. Howard, Acta Crystallogr. B, 1997, 53, 373–380. 3 Y. Ma, Y. Ma, D. Bresser, Y. Ji, D. Geiger, U. Kaiser, C. Streb, A. Varzi and S. Passerini, ACS
Nano, , DOI:10.1021/acsnano.8b03188.
4 D. Bresser, E. Paillard, R. Kloepsch, S. Krueger, M. Fiedler, R. Schmitz, D. Baither, M. Winter and S. Passerini, Adv. Energy Mater., 2013, 3, 513–523.
5 Y. Ma, Y. Ma, D. Geiger, U. Kaiser, H. Zhang, G.-T. Kim, T. Diemant, R. J. Behm, A. Varzi and S. Passerini, Nano Energy, 2017, 42, 341–352.
6 P. S. Peercy and B. Morosin, Phys. Rev. B, 1973, 7, 2779.
7 X. Mathew, J. P. Enriquez, C. Mejía-García, G. Contreras-Puente, M. A. Cortes-Jacome, J. A. Toledo Antonio, J. Hays and A. Punnoose, J. Appl. Phys., 2006, 100, 073907.
8 A. Azam, A. S. Ahmed, S. S. Habib and A. H. Naqvi, J. Alloys Compd., 2012, 523, 83–87. 9 J. Kaur, J. Shah, R. K. Kotnala and K. C. Verma, Ceram. Int., 2012, 38, 5563–5570.
10 A. Bouaine, N. Brihi, G. Schmerber, C. Ulhaq-Bouillet, S. Colis and A. Dinia, J. Phys. Chem. C, 2007, 111, 2924–2928.
11 K. Srinivas, M. Vithal, B. Sreedhar, M. M. Raja and P. V. Reddy, J. Phys. Chem. C, 2009, 113, 3543–3552.
12 P. Chetri, B. Saikia and A. Choudhury, J. Appl. Phys., 2013, 113, 233514.
13 W. Ben Haj Othmen, B. Sieber, H. Elhouichet, A. Addad, B. Gelloz, M. Moreau, S. Szunerits and R. Boukherroub, Mater. Sci. Semicond. Process., 2018, 77, 31–39.
14 T. P. Gujar, V. R. Shinde, C. D. Lokhande, R. S. Mane and S.-H. Han, Appl. Surf. Sci., 2005, 250, 161–167.
15 M. Batzill and U. Diebold, Prog. Surf. Sci., 2005, 79, 47–154.
16 K.-M. Li, Y.-J. Li, M.-Y. Lu, C.-I. Kuo and L.-J. Chen, Adv. Funct. Mater., 2009, 19, 2453–2456. 17 Y. Yan, F. Du, X. Shen, Z. Ji, X. Sheng, H. Zhou and G. Zhu, J. Mater. Chem. A, 2014, 2, 15875–
15882.
18 S. Samson and C. G. Fonstad, J. Appl. Phys., 1973, 44, 4618–4621.
19 N. Li, K. Du, G. Liu, Y. Xie, G. Zhou, J. Zhu, F. Li and H.-M. Cheng, J. Mater. Chem. A, 2013, 1, 1536–1539.
20 H. Wang, K. Dou, W. Y. Teoh, Y. Zhan, T. F. Hung, F. Zhang, J. Xu, R. Zhang and A. L. Rogach,
Adv. Funct. Mater., 2013, 23, 4847–4853.
21 I. A. Courtney and J. R. Dahn, J. Electrochem. Soc., 1997, 144, 2943–2948.
22 I. A. Courtney, W. R. McKinnon and J. R. Dahn, J. Electrochem. Soc., 1999, 146, 59–68. 23 R. Retoux, T. Brousse and D. M. Schleich, J. Electrochem. Soc., 1999, 146, 2472–2476.
24 C.-M. Wang, W. Xu, J. Liu, J.-G. Zhang, L. V. Saraf, B. W. Arey, D. Choi, Z.-G. Yang, J. Xiao, S. Thevuthasan and D. R. Baer, Nano Lett., 2011, 11, 1874–1880.
25 G. Ferraresi, C. Villevieille, I. Czekaj, M. Horisberger, P. Novák and M. El Kazzi, ACS Appl.
Mater. Interfaces, 2018, 10, 8712–8720.
26 I. A. Courtney and J. R. Dahn, J. Electrochem. Soc., 1997, 144, 2045–2052. 27 O. Mao, R. A. Dunlap and J. R. Dahn, J. Electrochem. Soc., 1999, 146, 405–413. 28 I. A. Courtney, R. A. Dunlap and J. R. Dahn, Electrochimica Acta, 1999, 45, 51–58.
29 F. Wang, R. Robert, N. A. Chernova, N. Pereira, F. Omenya, F. Badway, X. Hua, M. Ruotolo, R. Zhang, L. Wu, V. Volkov, D. Su, B. Key, M. S. Whittingham, C. P. Grey, G. G. Amatucci, Y. Zhu and J. Graetz, J. Am. Chem. Soc., 2011, 133, 18828–18836.
30 L. Li, F. Meng and S. Jin, Nano Lett., 2012, 12, 6030–6037.
31 D. Bresser, S. Passerini and B. Scrosati, Energy Env. Sci, 2016, 9, 3348–3367.
32 Y. Ma, Y. Ma, U. Ulissi, Y. Ji, C. Streb, D. Bresser and S. Passerini, Electrochimica Acta, 2018,
277, 100–109.
33 Y. Ma, H. Wang, S. Ji, J. Goh, H. Feng and R. Wang, Electrochimica Acta, 2014, 133, 391–398. 34 Y. Ma, H. Wang, H. Feng, S. Ji, X. Mao and R. Wang, Electrochimica Acta, 2014, 142, 317–323.
Sustainable
Energy
&
Fuels
Accepted
Manuscript
ToC
Carefully selecting the transition metal dopant in consideration of its redox potential allows for further increased energy and power densities.