14
thQuantitative InfraRed Thermography Conference
1 License: https://creativecommons.org/licenses/by-nd/4.0/deed.en
Periodic thermal behavior of walls: an experimental approach
by G. Ferrarini*, P. Bison*, A. Bortolin*, G. Cadelano*, F. Peron**
* ITC-CNR, Corso Stati Uniti 4, 35127, Padova, Italy, [email protected]**IUAV, FisTec Lab, Via Torino 153, 30172, Venezia, Italy
Abstract
The need for testing methods that could verify the performance of building components is continuously increasing, as it is mandatory to reduce the overall energy need of the buildings. This work provides a method that determines the dynamic behavior of walls. The time-shift due to the thermal and physical properties of the component is measured using infrared thermography. A case study on a typical wall sample is proposed, validating the technique.
1. Introduction
The impact of the building sector on the overall energy consumption in Europe is a major issue. The European union is trying to increase energy efficiency in building both advancing the knowledge through research [1] projects and enforcing standards and regulations. A key issue in this fields is the assessment of the thermal performance of building components. The targeted energy savings that are estimated during the design phase of a building could be obtained only if the actual performances of the built structure correspond to the theoretical ones. The goals of measuring building components are therefore two: giving accurate input data to the design models and guaranteeing a correct installation on-site. A key element of the building, from an energy standpoint, is the building envelope [2], that should provide a separation capable of minimizing the influence of the outer environment [3]. In this perspective, the building envelope is usually considered as a thermal barrier, referring to steady state conditions, and the thermal transmittance is the key indicator of its performance [4]. However, the walls play a crucial role also in transient thermal conditions, as the dynamic characteristics of walls play a key role in reducing the energy demand and guaranteeing an adequate level of thermal comfort [5,6]. While several standardized tests for the measurement of thermal transmittance are available both in laboratory and on site, the measurement of dynamic properties has been neglected. Recently, Ferrarini et al. [7] proposed a method for the quantification of the time shift for a wall sample. The method is based on infrared thermography (IRT) [8], that since long time is a valid technique for the survey of buildings and the measurement of their thermal properties [9,10]. In this work, the thermographic method is adapted to the simultaneous testing of two wall specimens.
2. Materials and methods 2.1. Theoretical background
The wall of a building, especially in the summer season, is impacted by a periodic thermal stimulation, with a period equal to 24 hours. The thermal behavior of the wall structure could be described by the following Eq. (1), the one-dimensional heat equation:
𝜕
2𝑇(𝑥, 𝑡)
𝜕𝑥
2=
1
𝛼
𝜕𝑇(𝑥, 𝑡)
𝜕𝑡
( (1)where T is the temperature at position x, t is the time, and α is the thermal diffusivity [m2s-1]. The thermal
diffusivity is defined by Eq. (2);
𝛼 =
𝑘
𝜌𝑐
𝑝( (2)
where k is the thermal conductivity [W m-1 K-1], ρ is the density [kg m-3] and cp is the specific heat [J kg-1 K-1].
Several methods are available to analyze this problem in order to obtain useful indications on the wall behavior, such as using the Laplace transform in order to build up the transfer matrix of a multilayer wall [7]. One of the most relevant analyses is proposed by the ISO 13786 standard [11], that suggest to use the mathematical methods to determine some key parameters of the wall, such as the periodic thermal transmittance, the decrement factor, and the time shift. In this
10.21611/qirt.2018.028
14
thQuantitative InfraRed Thermography Conference, 25 – 29 June 2018, Berlin, Germany
2
work, the focus is on the time shift, as it represents a quantity that gives a quick interpretation of the thermal phenomena and allows an easy comparison between different kinds of specimens. The time shift is defined [11] as the period of time between the maximum amplitude of a cause and the maximum amplitude of its effect, such as the difference between the surface temperatures on two opposite sides of a wall when on side receives a thermal stimulation. This parameter is measurable with a thermographic setup, as described in the following section. While several configurations of the measurement could be selected [7], a very effective one uses a single thermal camera and a thermal mirror. The extension of the method to the measurement of multiple samples is proposed in this work.
2.2. Experimental setup
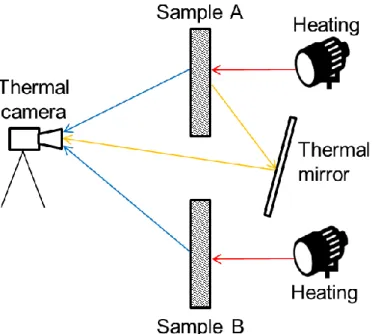
The experimental setup consists in a thermal stimulation system and a data acquisition system. The thermal source of the experimental setup are 2 lamps (1 kW nominal power each) that are controlled with a customized software in order to provide a synchronized output. Each lamp delivers a sinusoidal heating on the back surface of the specimen. The thermal wave has an amplitude equal to the 60% of the lamp power and a period equal to 24 hours. The data acquisition system is based on a FLIR SC660 thermal camera (spectral response 7.5μm - 13μm, NETD <30 mK, 640 x 480 pixel). The camera is set in the middle of the front surfaces of the specimens. The field of view of the camera includes also a thermally reflective mirror that is positioned in such a way to allow looking at the back surface of the specimen. The experimental setup is depicted in the following figure 1.
Fig. 1. Scheme of the experimental setup, where the lamps provide the sinusoidal thermal stimulus and the
thermal camera measures the temperature evolution on different walls.
Two walls, named respectively specimen A and specimen B, are tested in this work. The walls are constructed with identical materials, layered as described in table 1, and have a front surface close to 1 m2. The thermal properties
listed in table 1 are reference values obtained from the datasheet of the manufacturers. The insulation layer is the sum of two slabs (0.12 m and 0.02 m) and the only difference between specimen A and specimen B is the presence of a thin (<0.15 mm) aluminum layer put as an adhesive contact between the insulation panels.
Table 1. Layers of the wall specimens, listed from the inner to the outer side. The outer side is heated.
Material Thickness [m] Thermal conductivity [W m-1 K-1]
Density [kg m-3] Specific heat [J
kg-1 K-1] Plaster 0.015 0.8 1600 1000 Hollow bricks 0.25 0.312 800 840 EPS Insulation 0.12+0.02 0.032 20 1450 Plaster 0.005 0.8 1600 1000
10.21611/qirt.2018.028
14
thQuantitative InfraRed Thermography Conference, 25 – 29 June 2018, Berlin, Germany
3
3. Results
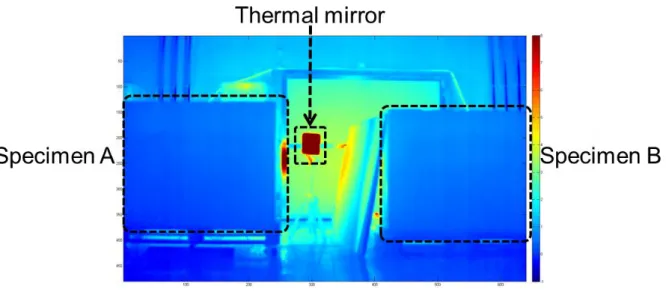
The specimens were placed inside a wide industrial building. The experiment lasted for 7 days, corresponding to 7 cycles of the heating signal, that had a period of 24 hours. The thermal camera recorded the temperature evolution on the specimens at a 0.5 Hz framerate, obtaining a thermal sequence of 680 images. The following figure 2 is one of the thermal images acquired during the test, where the positions of the specimens and of the thermal mirror has been highlighted.
Fig. 2. Thermal image obtained during the experiment. The position of the specimens and of the thermal mirror
is highlighted.
The calculation of the time shift was performed on the last 4 periods The environmental temperature was subtracted from the recorded temperatures of the specimens and of the thermal mirrors. The corrected temperature oscillations were fitted with a sinusoidal model, obtaining the profiles of figure 3.
Fig. 3. Temperature variations of the specimens during the last 4 periods of the experiment after the reference
subtraction and fitting process.
The time shift was calculated as the absolute value of the difference between t1 and t2, the times corresponding
to the peak temperature values respectively on the hot and cold side of the specimen. The use of similar specimen and the synchronization of the thermal stimulus allows to consider the cold side temperature of one specimen a reference for
10.21611/qirt.2018.028
14
thQuantitative InfraRed Thermography Conference, 25 – 29 June 2018, Berlin, Germany
4
both specimens. The calculation was performed selecting multiple times a single period in different regions of the dataset. The mean values and the standard deviations were taken as the time shift values, obtaining respectively 10.5 h ± 5% for Specimen A and 10.2 h ± 5% for Specimen B.
4. Conclusions
The work investigates a method for the analysis of the thermal behavior of building walls. The proposed
approach could be used for multiple wall samples, allowing a quite fast verification of performances of wide surfaces both during the industrial production and at the construction site. Future work will investigate different specimens and also different thermal stimuli.
ACKNOWLEDGEMENTS
This work was partially supported by the European Union within the ECOSHOPPING (Energy efficient & Cost competitive retrofitting solutions for Shopping buildings) FP 7th Project (Reference 609180).
REFERENCES
[1] Ecoshopping, European FP7th Project., (2016). http://ecoshopping-project.eu/ (accessed May 5, 2016).
[2] O. Guerra Santin, L. Itard, H. Visscher, The effect of occupancy and building characteristics on energy use for space and water heating in Dutch residential stock, Energy and Buildings. 41 (2009) 1223–1232. doi:10.1016/j.enbuild.2009.07.002.
[3] M. Ozel, K. Pihtili, Optimum location and distribution of insulation layers on building walls with various orientations, Building and Environment. 42 (2007) 3051–3059. doi:10.1016/j.buildenv.2006.07.025.
[4] P.G. Cesaratto, M. De Carli, A measuring campaign of thermal conductance in situ and possible impacts on net energy demand in buildings, Energy and Buildings. 59 (2013) 29–36. doi:10.1016/j.enbuild.2012.08.036.
[5] E. Kossecka, J. Kosny, Influence of insulation configuration on heating and cooling loads in a continuously used building, Energy and Buildings. 34 (2002) 321–331. doi:10.1016/S0378-7788(01)00121-9.
[6] C. Di Perna, F. Stazi, A.U. Casalena, M. D’Orazio, Influence of the internal inertia of the building envelope on summertime comfort in buildings with high internal heat loads, Energy and Buildings. 43 (2011) 200–206. doi:10.1016/j.enbuild.2010.09.007.
[7] G. Ferrarini, P. Bison, A. Bortolin, G. Cadelano, Thermal response measurement of building insulating materials by infrared thermography, Energy and Buildings. 133 (2016) 559–564. doi:10.1016/j.enbuild.2016.10.024.
[8] X. Maldague, Theory and practice of infrared technology for nondestructive testing, Wiley, 2001.
[9] A. Bortolin, G. Cadelano, G. Ferrarini, P. Bison, F. Peron, X. Maldague, High-resolution survey of buildings by lock-in IR thermography, lock-in: Thermosense: Thermal Infrared Applications XXXV, 2013: pp. 870503-870503–9. doi:10.1117/12.2016592.
[10] G. Cadelano, P. Bison, A. Bortolin, G. Ferrarini, F. Peron, M. Girotto, M. Volinia, Monitoring of historical frescoes by timed infrared imaging analysis, Opto-Electronics Review. 23 (2015) 102–108.
[11] ISO 13786:2017 Thermal performance of building components -- Dynamic thermal characteristics -- Calculation methods, 2017.