Adsorption pathways of Halon 1113 on TiO2 Nano-Powder: Structures, Energetics
and Vibrational Properties from DRIFT Spectroscopy and Periodic Quantum Chemical Calculations
Nicola Tasinato1, Daniele Moro, Paolo Stoppa, Andrea Pietropolli Charmet, Piero Toninello and
Santi Giorgianni
Dipartimento di Scienze Molecolari e Nanosistemi, Università Ca‘ Foscari Venezia, Calle Larga S. Marta 2137, I-30123 Venezia, Italy.
Abstract
Among atmospheric trace gases, halogenated organics represent potential hazardous compounds as they actively contribute to global warming and also to ozone depletion if containing Cl or Br atoms. Photodegradation over titanium dioxide (TiO2) is a very appealing technology for removing environmental pollutants from the air, the adsorption interaction being the first step of the whole reaction pathway. In the present work the adsorption of halon 1113 (chlorotrifluoroethene), a compound used by industry and detected in the atmosphere, on a commercial TiO2 nano-powder isinvestigated experimentally by in situ DRIFT spectroscopy and theoretically through periodic ab initio calculations rooted in DFT. The spectra of the adsorbed molecule suggest that the anchoring to the surface mainly takes place through F atoms. Theoretically, five adsorption configurations for the molecule interacting with the anatase (1 0 1) surface are simulated at B3LYP level and for eachof them, structures, binding energies and vibrational frequencies are derived. The interplay between theory experiments shows the coexistence of different adsorption configurations, the foremost ones featuring the interaction of one F atom with a fivefold coordinated Ti4+ of the surface. These two adsorption models, which mostly differ for the orientation of the adsorbate with respect to the surface, feature a binding energy of -10.9 and -9.8 kcal mol-1 according to dispersion corrected DFT calculations. The favorable adsorption interaction appears as an important requirement toward the application of titanium dioxide technologies for the photocatalytic degradation of halon 1113.
Keywords: Titanium dioxide, Chlorotrifluoroethene, atmospheric pollutants, DFT modeling, infrared spectroscopy, surface chemistry.
1 Corresponding author.
E-mail: [email protected]; Phone: +39 041 2348598; Fax: +39 041 2348594
Address: Università Ca' Foscari Venezia, Dipartimento di Scienze Molecolari e Nanosistemi, Dorsoduro 2137, I-30123 Venezia (Italy).
2 1. Introduction
The growing concerns of scientific communities and international politicians about climate changes and environmental degradation related to the human activities have even more highlighted the requirements for a deeper knowledge of atmospheric chemistry and physics as well as the needs for the development of eco-sustainable technologies to limit the human's environmental impact.
During the last years halogen-containing molecules have received a great deal of attention because of their alarming connection with stratospheric ozone depletion and global warming (e.g. Refs. 1-10 and references therein). Among halogenated organic compounds, chlorotrifluoethene (F2C=CFCl, halon 1113) is a molecule of industrial relevance mainly employed for the production of polymers and copolymers. Plastic materials containing polychlorotrifluoroethene (PCTFE) have unique properties concerning their mechanical and thermal stability as well as their chemical resistance. Further, they show a very low permeability to liquids and gases and excellent electrical properties. Therefore, such polymers are employed in a variety of fields among which there are cryogenic applications, valves and seals, compressors and pumps, films for food and pharmaceutical packaging. Halon 1113 is also historically famous for being the first fluorinated ethene used for the preparation of commercial fluoro-plastics, PCTFE being produced on an experimental scale in 1934. Subsequently, its first application came for military needs: the chemists working in the SAM Laboratories of the Manhattan Project at Columbia University demonstrated that PCTFE could be employed to contain the highly corrosive uranium hexafluoride used in gaseous plant enrichment of uranium-235. Since then, PCTFE, that has been commercially available with the name ‘Kel-F‘ in the early 1950s [11].
On the other hand, it has been demonstrated that, despite their thermal stability, the thermolysis of chlorofluoropolymers releases several substances among which halon 1113 can occur [12]. Recently, this compound has been discovered for the first time in air samples by gas chromatography coupled to mass spectrometry detection [13]. Once in the atmosphere, this pollutant is a potential source of chlorine atoms, which in turn, enter in the catalytic destruction of stratospheric ozone. Very recently
the vibrational properties of this molecule have been the subject of a detailed investigation carried out by coupling Fourier Transform Infrared (FTIR) spectroscopy to high level ab initio calculations employing the CCSD(T) method [14].
In this context, eco-sustainable solutions to remove gas phase pollutants from the atmosphere are strongly required. A very attractive strategy is the heterogeneous photo-catalysis over semiconductor surfaces, such as titanium dioxide (TiO2). TiO2 is wide bandgap semiconductor, whose application in photo-catalytic processes (but also in photo-voltaic and water splitting devices) relies on its optoelectrical properties. Upon absorption of photons with energy larger than the band gap (about 3.0 – 3.2 eV), an electron – hole pair is created. The charge carriers might migrate to the surface, where they react with adsorbed species and ultimately lead to their complete decomposition into simpler molecules [15-19]. Application of this process has led to the development of self-cleaning cements and coating.
In order to improve the efficacy of a catalysts toward one molecule or a family of compounds, it is recommended to gain insights into the chemistry and the chemical physics of the complex processes underlying the reaction mechanism. Hence, the individual steps involved in the reaction pathway should be carefully investigated, the adsorption being the first one. In fact, the interaction of the target molecule with the surface may lead to a variation of its structure, with consequent activation of some bonds, e.g. through their weakening [20-22].
Infrared (IR) spectroscopy is a well established technique to obtain experimental information about molecular structures and interactions, and DRIFT spectroscopy, in particular, is imposing itself as a prominent method to probe surface chemistry. During the last years, it has become the most effective technique for studying the processes taking place at the gas-solid interface [23-29]. Very recently it has been shown that this technique can be efficiently employed to study the adsorption of fluorinated organic pollutants on titanium dioxide [30]. An even deeper knowledge about the structural, energetic and spectroscopic properties of molecules adsorbed on surfaces can be achieved by coupling experiments to molecular simulations. First-principles calculations complement the experimental data
4
through the theoretical evaluation of geometrical parameters, interactions energies and vibrational frequencies, thus allowing the interpretation of the experimental results at an atomistic level. The interplay between experiments and quantum chemical simulations can be considered as the war horse for dissecting the chemical-physical properties underlying the adsorbate-substrate systems, and surface processes in general [31-38]. Within this scenario, the aim of the present work is the understanding of the adsorption dynamics of halon 1113 on titanium dioxide, in order to provide the chemical-physical picture of the adsorbate-substrate interaction at the microscopic scale. To this end the adsorption of F2C=CFCl on TiO2 is investigated by coupling experimental DRIFT spectroscopy to periodic quantum chemical calculations rooted in density functional theory (DFT). The fundamental vibrations of the adsorbed molecule are assigned through the analysis of the DRIFT spectra, and the comparison with the vibrational frequencies of the gas phase molecule provides experimental indications about the interactions sites of the ad-structure. The most likely absorption configurations are simulated at B3LYP level in order to compute adsorption energies and vibrational frequencies of the adsorbed molecule. Theoretical predictions are then faced with the experimental evidences in order to obtain a thorough picture of the interaction between F2C=CFCl and TiO2. The work is structured as follow: experimental and computational details are described in Section 2 and 3, respectively; results are presented and discussed in Section 4 and finally conclusions are addressed in Section 5.
2. Experimental Details
DRIFT spectra of F2C=CFCl (UCAR, 99% purity) adsorbed on TiO2 nano-powder, were recorded in the medium IR region by using a Bruker Vertex 70 FTIR spectrometer equipped with a HgCdTe detector, a globar source and a KBr beamsplitter. The Harrick Scientific Praying Mantis diffuse reflectance accessory, which was mounted inside the sample compartment of the spectrometer, was fitted with a stainless steel high temperature reaction chamber (Harrick Scientific HVC-DRP-5). The
chamber is enclosed by a dome with three windows, two of which are made of KBr for letting the IR radiation to be transmitted, whereas the third one, made of quartz, can be employed to view or UV irradiating the sample. The temperature inside the reaction chamber can be set through the sample stage which is temperature controlled by a cartridge heater (attached to the Harrick Scientific ATC-024-1 controller) and a thermocouple. A water cooling jacket, connected to water inlet/outlet, controls the temperature of the outer surface of the chamber and windows during high temperature operations, so that the sample stage is thermally isolated from the outer chamber wall. The reaction chamber is equipped with three gas ports for evacuating, pressurizing or flowing the gas through the sample. These were connected to a stainless steel vacuum line employed for gas handling. The vacuum line was supplied with both a rotary and a diffusive pump, and the latter was in turn backed by a second rotary pump. Pressure measurements were performed by using two capacitance vacuum gauges (Alcatel model ARD 1002 and 1003 with a full scale range of 100 and
10 mbar, respectively), each with a quoted manufacturer‘s full scale accuracy of 0.15%. The obtained reflectance spectra, having a resolution of 4 cm-1, were the result of the Fourier transformation of 128 co-added interferograms.
Since titanium dioxide does not transmit the IR radiation below about 1000 cm-1, mainly because of the strong absorptions due to Ti—O stretching, the TiO2 nano-powder (Degussa P25, 80% anatase and 20% rutile) were diluted with KBr, which represents an optically non-interfering matrix and further it minimizes the unwanted effects due to specular reflection [39]. The measurements were carried out by using different concentrations of TiO2, ranging from 10% to 100% (w/w), albeit, as expected, in the latter case the signal-to-noise ratio below 1100 cm-1 became too low. In order to make the experiments reproducible, and hence to expose different amounts of F2C=CFCl (in the range 240 – 1250 Pa) to TiO2 surfaces with the same acid/base features and adsorption sites, the solid substrate was treated at high temperature (400 ◦C) under dynamic vacuum for 2 hours and then it was re-oxidized with a mixture of O2/N2. The treated surface was used as background for the recording of
6
the spectrum of the adsorbed gas. Besides to the spectra of adsorbed F2C=CFCl, those of the free molecule were also recorded.
3. Molecular Modeling
Periodic ab initio calculations were performed with the Crystal suite of programs [40-42],adopting DFT and specifically the B3LYP hybrid generalized gradient approximation (GGA) functional[43,44]. The TiO2 substrate was modeled as the anatase (1 0 1) surface with a 12-atomic layers slab cut from the optimized bulk [45]. As usual, this surface was selected since it is the anatase most stable surface and hence it should be the most exposed surface available for the adsorption. The Ti and O ions were described by means of the 86-51G* and 8-411G contractions, respectively [46], whereas the 6-31G(d') basis set[47] was employed for the F2C=CFCl molecule.
In the periodic calculations, the Hamiltonian matrix was diagonalized at 10k points within the first Irreducible Brillouin zone (IBZ) adopting the Monkhorst-Pack net sampling [48]. The level-shifting (0.3 Ha) method was employed, and the Fock/KS matrix at a given iteration was mixed with 30% of the previous one [40].
For each of the different interaction configurations (see later) taken into account for modeling the adsorption of F2C=CFCl on TiO2, geometry optimization was carried out first, and then, at the optimized structure harmonic vibrational frequencies were calculated at the G point of the IBZ through analytic evaluation of the Hessian matrix [49,50]. Further, single point energy calculations were performed at the obtained equilibrium structures by adopting the larger TZV basis set of Ahlrichs [51] for the F2C=CFCl molecule, keeping the 86-51G* and 8-411G basis sets for describing the surface atoms. In order to lighten the notation, from now on, only the basis set employed for the molecule will be indicated when referring to the model chemistry.
During the last years it has been deeply demonstrated that DFT is unable to account for dispersion correlation effects (see e.g. Refs. [52-58] and references therein) which are of fundamental relevance
to correctly describe the energetic of molecular complexes, chemical reactions in general, and hence of adsorption processes as well [59,60]. Therefore to include the dispersion contributions, the energies computed at B3LYP/TZV level were corrected by using the additive atom pairwise dispersion correction scheme, developed by Grimme [61] and implemented in the Crystal 09 code. This implementation actually corresponds to the DFT-D2 variant [62] and hence these calculations are denoted B3LYP-D2/TZV in the following of the paper. The adsorbate-substrate binding energy was computed as
DEads =EC2F3Cl@TiO2 –
(
EC2F3Cl +ETiO2)
(1)
where EC2F3Cl@TiO2 represents the energy of the ad-structure, while ETiO2 and EC2F3Cl are the energies of
the bare surface and the gas phase molecule, respectively. For B3LYP/6-31G(d') calculations, energies are to be intended as pure electronic, while for B3LYP-D2/TZV computations they include dispersion contribution as well. Actually the binding energy can be expressed as the sum of the interaction and distortion energies. The former gives information about the strength of the resulting adsorbate-substrate system, and the latter, which is always positive, represents the energy loss due to the geometrical distortions induced by molecule – surface interaction. It is a well known fact that, the incompleteness of the basis set causes the basis set superposition error (BSSE), a purely mathematical artefact which leads to a fictitious lowering of the ad-structure energy [63].
As a consequence the BSSE was corrected for by means of the counterpoise method worked out by Boys and Bernardi [64].
4. Results and Discussion
8
4.1. DRIFT spectra of F2C=CFCl adsorbed on nano-powdered TiO2.
The vibrational spectrum of an adsorbed molecule generally differs from that of the non-interacting species, the stronger the interaction the more pronounced the variation. Hence IR spectroscopy can be exploited to obtain experimental information related to the strengthen variation of molecular bonds through an analysis of the shift of the corresponding absorptions, thus furnishing useful indications about the most likely anchor points.
From a spectroscopic point of view, chlorotrifluoroethene (Figure 1) is a planar asymmetric rotor belonging to the Cs symmetry point group. It has 12 normal modes of vibrations, which can be
classified, in terms of symmetry species, as either A' (n1 – n 9) or A" (n 10 – n 12) symmetry, as reported in Table 1. For the purpose of the present discussion the attention is focused on the vibrations lying above 1000 cm-1 (n 1 - n 4), as the region below this threshold cannot be accessed because of the TiO2 cutoff.
The differential spectra of F2C=CFCl adsorbed on TiO2 at increasing adsorbate loadings are presented in Figure 2, together with the spectrum of the free molecule recorded under analogous experimental conditions. The strong absorption feature at 1794 cm-1 is readily assigned to the n
1 band of the adsorbed molecule, which undergoes a red shift of 6 cm-1 with respect to the free gas. On the opposite side of the spectrum, the 1053 cm-1 absorption certainly correlates to the n 4 vibration, that is located at 1060 cm-1 in the free molecule. These two bands originate from the C=C stretching (n
1) and CF2 symmetric stretching (n4) vibrations, respectively. Quite surprisingly, the region between 1100 and 1400 cm-1 appears rather complex, with different absorption peaks arising from the ad-molecule, and just two normal modes (n2 and n3) left for the free gas phase chlorotrifluoroethene. Tentatively the signals at 1181, 1215 and 1283 cm-1 can be ascribed to the n 3 vibration, that corresponds to the C—F stretching which is located at 1216 cm-1 in the free molecule. In an analogous way, the absorptions at 1321, 1334 and 1379 cm-1 might relate to the n
2 fundamental band, lying at 1334 cm-1 for the free F
it is clear that these two stretching vibrations undergo the largest frequency shifts, suggesting that the interaction with TiO2 mainly takes place through the F atoms, the fact that they are split into more than one band in the adsorption spectra, can be due to the concomitant presence of different adsorption configurations or to different adsorption sites on the surface. In order to get more insights into the adsorption process, the experimental observations need to be complemented by molecular modeling, as it will be illustrated in the following paragraphs.
At this point one may wonder whether the 1215 and 1334 cm-1 bands actually belong to the adsorbed molecule or they are spurious signatures of the gas phase compound. To this end, it must be noted that all the differential spectra derived under different conditions of surface composition (i.e. TiO2/KBr ratio) and F2C=CFCl pressure do show these absorptions. Another important fact to take into account is that the interaction with the titanium dioxide surface changes the shape of the absorption bands. This is well illustrated in Figure 3, where the spectrum of the free chlorotrifluoroethene is superimposed to that recorded for the F2C=CFCl atmosphere over the TiO2 surface. The latter spectrum brings two pieces of information as it is the result of the superposition of the absorptions of the free- and adsorbed molecules. Besides to the signals arising only from the adsorbed molecules, which are clearly visible (see arrows), it is interesting to note the evident change in the relative intensity of the P and R branches of the n2 and n3 bands. This highlights the presence of the absorptions due to the ad-molecules underneath those, much stronger, of the free gas, which indeed become very clear in the differential spectra of Figure 2. In a similar way, it is evident also the major change in intensity shown by the n 1 band, also illustrated in Figure 3.
4.2. DFT modeling of F2C=CFCl adsorption on TiO2 anatase.
In simulating the adsorption of F2C=CFCl on the anatase (1 0 1) surface, five interaction configurations have been considered mainly on the basis of the results coming from experimental
10
DRIFT spectra; they are reported in Figure 4 and labelled as models MI – MV. The starting structures have been devised mainly on the basis of the experimental observations, which suggest that the main interactions take place through the F atoms, the corresponding stretching frequencies (in particular n2 and n3) being related to the foremost shifts. This is also in accord with our previous experience [38, 65-67], which indicated that in halogenated ethenes the preferred anchor point is the F atom that interacts with five-fold coordinated Ti ions of the surface. Based on these considerations, the F2C=CFCl has been set on the top of the anatase (1 0 1) by exposing the different F atoms to a five-fold Ti ion, as well as considering different orientations of the molecule with respect to the surface. In addition, the unrelaxed geometry of model MIV has been arranged to feature adsorption through the Cl atom, in order to sound this possibility. As it will be shown below, optimization of this structure has led to the molecule moving away from the surface.
The main structural parameters obtained for the F2C=CFCl molecule adsorbed on the surface according to configurations MI – MV are listed in Table 2 together with those of the free molecule (the experimental structure is also reported [68]). The corresponding binding energies computed at B3LYP/6-31G(d'), B3LYP/TZV and B3LYP-D2/TZV levels of theory are reported in Table 3, while harmonic frequencies and intensities obtained for the adsorbed molecule at the B3LYP/631G(d') level are reported in Table S.1 of the supplementary material; atom displacements of each normal mode are illustrated in Figure S.1 - S.6 (prepared by means of the Moldraw software [69,70]) for the free molecule and the five interaction models, respectively. In order to limit the length of the paper, the following discussion focuses only on the main features of the most important adducts.
According to model MI, which is predicted to be the most stable one with a binding energy of -45.6 kJ mol-1 (B3LYP-D2/TZV), the halon 1113 interaction takes place by means of the CF2 moiety of the molecule, and in particular the F atom in cis to chlorine. The distance between this F atom and the fivefold coordinated Ti4+ ion of the surface is 2.20 Å, while the second fluorine facing to the surface is about 0.9 Å further apart (see O—F1 distance). As a consequence of this anchoring, the corresponding C—F bond length elongates by about 0.04 Å, the F1Cˆ1C2 angle increases of 3°, while
that F2Cˆ1C2 decreases by 2°. This model also features the additional interaction of the Cl atom with
an under-coordinated oxygen, as highlighted by the lengthening of the C—Cl bond length of nearly 0.07 Å.
The second most stable adsorption configuration, with a binding energy of -41.0 kJ mol-1, is MV, in which the anchoring point is still the CF2 moiety, but now the C=C axis is almost perpendicular to the surface and the anchoring is through the F atom in trans position to Cl. Here the C—F1 bond length increases by 0.03 Å, the F1Cˆ1C2 and F2Cˆ1C2angles become tighter and looser by 2°,
respectively, while the remaining geometrical parameters undergo only minor changes; F1, which is the atom closest to the surface, is at a distance of 2.24 and 2.83 Å from the under-coordinated Ti and O atoms, respectively.
Interaction models MII and MIII yield very similar binding energies of -27.6 and -30.5 kJ mol-1, respectively, the adsorption configuration involving the molecular plane nearly perpendicular to the surface with the C=C double bond slightly tilted with respect to it (see Figure 4). In both of them F2C=CFCl is adsorbed on TiO2 through one F atom which is linked to a Ti4+ site, albeit for
MII the anchoring moiety is the CF2 group whereas the CFCl side is involved in the case of MIII. The latter also features an additional stabilizing Cl···O dispersion interaction. Indeed, if not dispersion corrected, the two adsorption configurations show closer binding energies, differing by only 1.3 kJ mol-1. Accordingly to these ad-structures, the most important structural distortions of halon 1113 are, in MII, the lengthening of the F1—C1 bond length (~ 0.03 Å), the shortening of the F3—C2 one (~ 0.01 Å), and a looser F2Cˆ1C2 angle (2°). In model MIII, the bond angles show variations less than 2°,
while the F3—C2 and C—Cl bond lengths respectively move from 1.35 Å and 1.72 Å in the free F2C=CFCl to 1.38 Å and 1.70 Å in the adsorbed molecule. The two adducts also give very similar distances between chlorotrifluoroethene and titanium dioxide: the Ti—F bond length, referring to the F atom closest to the surface, is 2.24 Å in both cases, and even the distance between the second F
12
directed toward the surface and the O atom is 2.94 Å for both models. Finally, the MIV adsorption configuration simulates chlorotrifluoroethene engaged with the surface by means of the Cl atom, the molecular plane being perpendicular to the surface and the C=C axis nearly parallel to it. This model has the weakest binding energy (-17.2 kJ mol-1), with molecule – surface distances not smaller than 3 Å; as a consequence the F2C=CFCl molecule shows minor structural adjustment.
Before moving to the comparison between theoretical and experimental results, a comment about dispersion interactions seems appropriate. As expected, their contribution to the binding energy amounts to several kJ mol-1, and it represents the foremost driving force for the adsorption of chlorotrifluoroethene on titanium dioxide. Indeed, if dispersion correlation is not accounted, as in B3LYP/TZV, much weaker (by about 35 kJ mol-1) binding energies are predicted for models MI and MV, and even the molecule results unbound in MII – MIV. It is also worth noticing the subtle error compensation between the dispersion interactions and the BSSE. Inspection of the energy contributions reveals that stabilizing dispersion correlations amount from -25 to -37 kJ mol-1 depending on the structure considered, while the destabilizing BSSE ranges from 15 to 34 kJ mol-1, hence the two effects nearly cancel out when both are considered. Nevertheless, if only the BSSE correction is applied then interaction energies result much weaker. This is very clear by watching at the binding energies obtained at B3LYP/6-31G(d') level: CP corrected binding energies are small (14 kJ mol-1 for model MI), while when the correction is omitted the energetics become closer to the B3LYP-D2/TZV ones, with deviations on the order of 10 kJ mol-1 (to be compared with the ca. 27 kJ mol-1 if only BSSE is taken into account). This error compensation between the fictitious stabilizing contribution arising from the BSSE and the destabilization due to the missing dispersion correlation is one of the main reasons of the popularity gained over the years by the B3LYP/6-31G* model chemistry, for which "under certain circumstances, the fortuitous error compensation can yield acceptable results", as recently demonstrated by Grimme and co-workers [71].
4.3. Interplay between experiment and theory.
Summarizing the results of Section 4.1, the DRIFT spectrum of adsorbed chlorotrifluoroethene shows that the normal modes n1 (stretching C=C) and n4 (symmetric stretching CF2) are blue shifted by about 7 cm-1 with respect to the gas phase molecule. Conversely major shifts can be appreciated in the n 2 and n 3 spectral regions. The former band (asymmetric stretching CF2) appears to be shifted to either 1321 cm-1 or 1379 cm-1, corresponding to differences of -13 and 45 cm-1 from free F2C=CFCl; the latter (stretching C—F ) may be thought to be red shifted by up to 35 cm-1, giving rise to the absorption at 1181 cm-1. As a first picture, these observed shifts suggest that the interactions of F2C=CFCl with the titanium dioxide substrate should involve either the CF2 or CF moieties of the molecule, the corresponding bonds being mainly concerned in the n 2 and n 3 vibrations. Further, by considering that with few exceptions the observed shifts are small, it can be supposed that the molecule does not strongly bind to the surface and this speculation well reconcile with a calculated binding energy of 46 kJ mol-1 at most. At this point the experimental input must be complemented by means of quantum chemical calculations in order to achieve a more thorough picture of the adsorption process.
In order to compare the vibrational frequencies computed at B3LYP/6-31G(d') level for the halon 1113 molecule adsorbed on the anatase (1 0 1) surface to the experimental DRIFT spectra, the theoretical values should be corrected for the anharmonicity of the potential. For such large systems, a full anharmonic calculation is a daunting task, and one usually resorts to the use of scaling factors. Nevertheless, if the scale factor for B3LYP/6-31G* model chemistry (0.9613) is employed [72,73], the corrected frequencies are in worse agreement with the experimental values, than the uncorrected (purely harmonic) ones, already for the free molecule. This worsening is rooted in the small anharmonic constants of chlorotrifluoroethene [14], which are badly recovered by the scale factor suitable for the level of theory employed. In order to circumvent this problem, the harmonic vibrational frequencies of the adsorbed molecule have been scaled by using ―ad hocǁ scaling factors, obtained by requiring that the scaled vibrational frequencies computed for the free molecule reproduce the experimental ones. In a similar way, the computed harmonic intensities have been corrected for the anharmonicity by using the scale factors obtained by comparing the intensities at
14
B3LYP/6-31G(d') level with those from CCSD(T)/cc-pVTZ computations [14]. The rationale for the latter choice is that, due to band overlaps, experimental absorption cross sections of the gas phase compound cannot be obtained for every fundamental vibration, but anharmonic intensities computed at CCSD(T)/cc-pVTZ provided a very good agreement to the experimental counterparts over the same spectral range [14]. The resulting anharmonic vibrational frequencies and intensities of chlorotrifluoroethene adsorbed on anatase (1 0 1) according to the different adsorption pathways previously discussed are reported in Table 4.
The theoretical frequencies calculated for the 1 band for the different interaction configurations span a restricted frequency range, of only about 20 cm-1. If one takes into account the typical width of a chlorotrifluoroethene vibrational band, all the predicted frequencies collapse in a unique absorption peaking at c.a. 1812 cm-1, a value which is in very good agreement with the one at 1794 cm-1 observed experimentally. Clearly, this vibration cannot be diagnostic for the assignment of a precise ad-structure, on the other hand, taking into account the obtained adsorption energies allows one to discard the adsorption model MIV, as it yields the weakest interaction with the surface. Moving to the band observed at 1053 cm-1, even if the n4 frequency predicted by MI is closer to the experimental value, it should be considered that also MII and MV provide similar outcomes, which, as in the case on the n1 band, end in a unique peak at 1040 cm-1, again in favourable accord with experiment. Interestingly, according to the ad-structure MIII the n4 vibration is expected at 1083 cm-1, though in the DRIFT spectra no strong absorptions can be easily identified in this region. This fact nicely agrees with the fact that at least two models, MI and MV, contribute to the band observed at 1053 cm-1, both characterized by the strongest absorption energies, and hence they are expected to give a major contribution to the final spectrum. This is well illustrated in Figure 5, which compares the simulated spectra to the experimental one: as it can be seen, the band predicted at 1083 cm-1 has a much weaker intensity than that at 1040 cm-1, supporting the fact that the former is not clearly discernable experimentally.
Concerning the complex spectral region between 1100 and 1400 cm-1, the broad band measured at 1181 cm-1 only reconciles with the n
3 vibration of the adsorption configuration MIII, which is predicted at 1126 cm-1, i.e. red shifted by 90 cm-1 with respect to the free molecule. If on the one side, theory correctly provides a red shift for this vibration, as observed experimentally, on the other, its frequency is underestimated about 55 cm-1. This difference is somewhat regular for the stretching vibration involving the F atoms engaged with the TiO2 surface, as it will be pointed out shortly later in the text.
According to the adsorption configurations MI and MV, the n3 band of adsorbed F2C=CFCl is calculated at 1218 and 1223 cm-1, respectively, both of them well correlating to the band observed at 1215 cm-1 in the DRIFT spectra. By watching at the predicted intensities, the MI model is expected to give the main contribution, albeit caution must be paid in comparing theoretical and experimental intensities, as calculations refer to the absorption cross section, while the DRIFT technique measures the Kubelka-Munk reflected light. This seems also to be the likely explanation for the large experimental intensity of the n1 band compared to that, medium to low, predicted by the DFT simulations for the various models.
The adsorption models MI and MV also seem to explain the peak measured at 1283 cm-1: in fact, they calculate the n2 vibration at 1277 and 1285 cm-1, respectively, red shifted by about 50 cm1 with respect to that of F2C=CFCl in the gas phase. On the other hand, by watching at the observed intensities, it is more plausible to match these theoretical values with the bands observed at 1321 and 1334 cm-1, which therefore can be assigned to the n
2 band of the MI and MV ad-structures, respectively. It is worth noticing that the predicted separation between these two absorptions (8 cm1) nicely reconciles with the measured one (13 cm-1). It appears that theoretical calculations underestimate this C—F stretching frequency by about 40 cm-1, as previously pointed out for the n4 band of MIII, this behaviour being somewhat systematic in the modeling of halogenated organics adsorbed on TiO2 [30,45]. The same also holds for the band observed at 1379 cm-1 that only after
16
comparison to the theoretical outcomes can be assigned as the n2 vibration of F2C=CFCl adsorbed on the surface according to model MIII, and calculated at 1348 cm-1. To a first approximation, the mentioned underestimation implies that theory features a stronger F—Ti interactions between F2C=CFCl and the anatase (1 0 1) surface than the experimental one, resulting in lower C—F stretching frequencies, as a consequence of the reduction of the corresponding force constant. This fact, already observed for CH2F2 [30], was expected and it can be understood if one considers that the atomistic simulations neglect the thermal effects, referring to a static configuration, while measurements are actually carried out on ensemble averages.
At this point, the weak absorption feature measured at 1283 cm-1 may be addressed as the n
2 band of model MII, as it is predicted as the strongest band of F2C=CFCl in this absorption configuration which, it should be recalled, has a binding energy of -27.6 kJ mol-1. In any case, this ad-structure is expected to give only a minor contribution in comparison to models MI, MV and, to a minor extent, MIII and possibly the 1283 cm-1 adsorption may arise form the presence of different sites available for the adsorption in the TiO2 nano-powder.
In conclusion, the comparison between theory and experiment shows that at least three different models coexist for the adsorption of F2C=CFCl over the TiO2 photocatalyst. On the other hand, as it can be observed in the spectral simulations reported in Figure 5, models MI and MV account for the most important absorptions observed experimentally, in agreement with the fact that they also provide the strongest binding energies. Actually, the two adsorption configurations, both involving the anchoring by means of one F atom, are quite similar and they differ mostly for the orientation of the molecule with respect to the surface.
5. Conclusion
The present investigation dealt with a combined experimental and theoretical study on the adsorption of F2C=CFCl (halon 1113), an atmospheric pollutant arising from the thermolysis of fluorinated polymers, over titanium dioxide. Experimentally, vibrational spectra of the adsorbed molecule have been recorded by means of DRIFT spectroscopy in conjunction with the use of an environmental chamber for controlling the reaction atmosphere over the surface. The analysis of the recorded spectra has led to the evidence that the main interaction pathway between the molecule and the TiO2 nano-powder involve the F atoms, indeed C—F stretching vibrations undergo the main frequency shifts with respect to the free gas phase F2C=CFCl. Theoretically, the molecular adsorption has been simulated by means of periodic quantum chemical calculations adopting the hybrid B3LYP exchange-correlation functional. In particular, five adsorption configurations have been considered, differing for the anchoring moiety and molecular orientation, and for each of them structures, vibrational frequencies and intensities as well as adsorption energies have been determined. The interplay between theory and experiment has led to the conclusion that the observed spectrum is actually the result of the ensemble average of three adsorption models. The two most important ones feature the F2C=CFCl molecule anchored to the TiO2 surface by means of one F atom interacting with an under-coordinated (fivefold) Ti4+ ion of the surface, and they mostly differ for the orientation of the molecule with respect to the surface. These two adsorption configurations have also shown a similar binding energy, about -46 and -41 kJ mol-1 respectively, which are largely dominated by dispersion contributions as highlighted by dispersion corrected B3LYP-D2 calculations.
The relevance of the present results may be cast in the field of heterogeneous photocatalys, as the favourable adsorption of F2C=CFCl on the TiO2 surface is a fundamental requirement for the molecule photodegradation, operated by the semiconductor charge carriers, to take place. The outcomes of the investigation also show that the synergism between DRIFT spectroscopy and quantum chemical molecular modeling is able to provide important insights into the adsorption of atmospheric pollutants over semiconductor surfaces, and that dispersion interactions are fundamental driving forces for the adsorption process.
18 Acknowledgments
The High Performance Computing department of the CINECA Supercomputer Centre and the SCSCF ("Sistema per il Calcolo Scientifico di Ca' Foscari") facility are gratefully acknowledged for the utilization of computer resources (grants n. HP10CVN2S9 and HP10CVEVP7). This work has been supported by MIUR through PRIN 2012 funds for project STAR (Spectroscopic and
computational Techniques for Astrophysical and atmospheric Research), and PRIN 2009 funds for
project SPETTRAA (Molecular Spectroscopy for Atmospherical and Astrochemical Research:
Experiment, Theory and Applications) and by University Ca' Foscari Venezia (ADiR funds). N.T.
thanks University Ca' Foscari Venezia for his post-doctoral position.
Supplementary Material
Table S.1: harmonic vibrational wavenumbers and intensities for F2C=CFCl adsorbed on TiO2 anatase (1 0 1) obtained at B3LYP/6-31G(d') level. Figures S.1 - S.6: Vibrational normal modes of free and adsorbed F2C=CFCl.
References
[1] T.J. Wallington, O.J. Nielsen, in: A. H. Neilson (Ed.), The Handbook of Environmental Chemistry, Springer-Verlag, Berlin, 2009, vol. 3N, pp 85-102.
[2] D. McNaughton, E.G. Robertson, D. Thompson, T. Chimdi, M.K. Bane, D. Appadoo, Anal. Chem. 82 (2010) 7958-7964.
[3] M. Baasandorj, G. Knight, V.C. Papadimitru R.K. Talukdar, R. Ravishankara, J.B. Burkholder, J. Phys. Chem. A 114 (2010) 4619-4633.
[4] J. Ljubić, A. Sablić, J. Phys. Chem. A 106 (2002) 4745- 4757.
[5] S. Sekušak, K.R. Liedl, A. Sablić, J. Phys. Chem. A 102 (1998) 1583-1594.
[6] Z. Bousseta, F. Kwabia Tchana, H. Aroui, J. Mol. Spectrosc. 308-309 (2015) 33-40.
[7] N. Tasinato, A. Turchetto, C. Puzzarini, P. Stoppa, A. Pietropolli Charmet, S. Giorgianni, Mol. Phys. 112 (2014) 2384-2396.
[8] E. Canè, M. Villa, F. Tarroni, F. Tamassia, A. Pietropolli Charmet, N. Tasinato, P. Stoppa, S. Giorgianni, Mol. Phys. 112 (2014) 1899-1909.
[9] A. Pietropolli Charmet, P. Stoppa, N. Tasinato, S. Giorgianni, V. Barone, M. Biczysko, J. Bloino, C. Cappelli, I. Carnimeo, C. Puzzarini, J. Chem. Phys. 139 (2013) 164302.
[10] N. Tasinato, P. Stoppa, A. Pietropolli, S. Giorgianni, A. Gambi, J. Quant. Spectrosc. Radiat. Transfer 113 (2012) 1240-1249.
[11] B. G. Willoughby, in Banks, R.E. (Ed.), Preparation, Properties and Industrial Applications of Organofluorine Compounds, John Wiley & Sons, Chichester, 1982, pp. 201-234.
[12] D.A. Ellis, S.A. Mabury, J.W. Martin, D.C.G. Muir, Nature 412 (2001) 321-324. [13] L.C. Laube, A. Engel, Atmos. Chem. Phys. 8 (2008) 5143-5149.
[14] N. Tasinato, A. Pietropolli Charmet, P. Stoppa, S. Giorgianni, A. Gambi, Chem. Phys. 397 (2012) 55-64.
[15] M. R. Hoffman, S.T. Martin, W. Choi, Chem. Rev. 95 (1995) 69-96. [16] A. L. Linsebigler, G. Lu, J.T. Yates Jr., Chem. Rev. 95 (1995) 735-758. [17] U. Diebold, Surf. Science Reports, 48 (2003) 53-229.
[18] X. Chen, S.S. Mao, Chem. Rev. 107 (2007) 2891-2959.
[19] C. Dette, M.A. Pérez-Osorio, C.S. Kley, P. Punke, C.E. Patrick, P. Jacobson, F. Giustino, S.J. Jung, K. Kern, Nano Lett.14 (2014) 6533-6538.
[20] M. Patel, F.F. Sanches, G. Mallia, N.M. Harrison, Phys. Chem. Chem. Phys. 16 (2014) 21002-21015.
[21] R. Wanbayor, P. Deák, T. Frauenheim, V. Ruangpornvisuti, Comp. Mat. Sci. 58 (2012) 2430. [22] S. Pirillo, I. López-Corral, E. Germán, A. Juan, Appl. Surf. Sci 286 (2012) 79-85.
[23] A. Drochner, G.H. Vogel, in: R. Schäfer, P.C. Schmidt, (Eds.), Methods in Physical Chemistry, Wiley, Weinheim (2012) pp. 445-475
[24] P.R. Griffiths, J.A. de Haseth, Fourier Transform Infrared Spectrometry, John Wiley & Sons, New York (1986) pp. 536-563.
20
[25] K.W. van Every, P.R. Griffiths, Appl. Spectrosc. 45 (1991) 347-359.
[26] I. Tankov, W.H. Cassinelli, J.M.C. Bueno, K. Arishtirova, S. Damyanova, Appl. Surf. Sci. 259 (2012) 831-839.
[27] J. Couble, P. Gravejat, E. Gaillard, D. Bianchi, Appl. Catal. A-Gen. 371 (2009) 99-107. [28] C.F. Windisch Jr., P.K. Thallapally, B.P. McGrail, Spectrochim. Acta A 74 (2009) 629–634. [29] A. Navajas, G. Arzamendi, F. Romero-Sarria, M.A. Centeno, J.O. Odriazola, L.M. Gandía,
Catal. Commun. 17 (2012) 189-193.
[30] J. Scaranto, D. Moro, N. Tasinato, P. Stoppa S. Giorgianni, Spectrochim. Acta A 136 (2015) 1614-1620.
[31] K. Westermark, S. Tingry, P. Persson, H. Rensmo, S. Lunell, A. Hangfeldt, H. Siegbahn, J. Phys. Chem. B 105 (2001) 7182-7187.
[32] C.E. Zubieta, L.F. Fortunato, P.G. Belelli, M. Ferullo, Appl. Surf. Sci. 314 (2014) 558-563. [33] A. Pedone, G. Prampolini, S. Monti, V. Barone, Chem. Mat. 23 (2011) 5016-5023.
[34] A.G. Schneider, T. Bredow, L. Schomborg, C.H. Rüscher, J. Phys. Chem. A 118 (2014) 7066-7073.
[35] J. Liu, Q. Liu, P. Fang, C. Pan, W. Xiao, Appl. Surf. Sci. 258 (2012) 8312-8318. [36] X. Zhang, Q. Chen, W. Hu, J. Zhang, Appl. Surf. Sci. 286 (2013) 47-53.
[37] T.R. Esch, I. Gadaczek, T. Bredow, Appl. Surf. Sci. 288 (2014) 275-287.
[38] J. Scaranto, G. Mallia, S. Giorgianni, C.M. Zicovich-Wilson, B. Civalleri, N.M. Harrison, Surf. Sci. 600 (2006) 305-317.
[39] J.M. Olinger, P.R. Griffiths, Appl. Spectrosc. 47 (1993) 687–694.
[40] (a) R. Dovesi, V.R. Saunders, C. Roetti, R. Orlando, C.M. Zicovich-Wilson, F. Pascale, B. Civalleri, K. Doll, N.M. Harrison, I.J. Bush, Ph. D‘Arco, M. Llunell, CRYSTAL06 User's Manual; CRYSTAL - Theoretical Chemistry Group: Torino, Italy, 2006; (b) CRYSTAL09 User's Manual; CRYSTAL - Theoretical Chemistry Group: Torino, Italy, 2009.
[41] R. Dovesi, B. Civalleri, R. Orlando, C. Roetti, V.R. Saunders, Rev. Comput. Chem. 21 (2005) 1-125.
[42] R. Dovesi, R. Orlando, B. Civalleri, C. Roetti, V.R. Saunders C.M. Zicovich-Wilson, Z. Kristallogr. 220 (2005) 571-573.
[43] A.D. Becke, J. Chem. Phys. 98 (1993) 5648-5652.
[44] C. Lee, W. Yang, R.G. Parr, Phys. Rev. B 37 (1988) 785-789.
[45] J. Scaranto D. Moro, N. Tasinato, P. Stoppa, A. Pietropolli Charmet, S. Giorgiannni, Vib. Spectrosc. 65 (2013) 142-146.
[46] http://www.crystal.unito.it/Basis_Sets.
[47] G.A. Petersson, A. Bennett, T.G. Tensfeldt, M.A. Al-Laham, W.A. Shirley, J.A. Mantzaris, J. Chem. Phys. 89 (1988) 2193-218.
[48] H.J. Monkhorst, J.D. Pack, Phys. Rev. B 8 (1976), 5188-5192.
[49] F. Pascale, C.M. Zicovich-Wilson, F. Lopez, B. Civalleri, R. Orlando, R. Dovesi, J. Comput. Chem. 25 (2004) 888-897.
[50] C.M. Zicovich-Wilson, F. Pascale, C. Roetti, V.R. Saunders, R. Orlando, R. Dovesi, J. Comput. Chem. 25 (2004) 1873-1881.
[51] A. Schäfer, C. Huber, R. Ahlrichs, J. Chem. Phys. 100 (1994) 5829-5835. [52] S. Grimme, WIREs Comput. Mol. Sci. 1 (2011) 211-228.
[53] J. Klimeš, A. Michaelides, J. Chem. Phys. 137 (2012) 12090.
[54] L.A. Burns, A. Vázquez-Mayagoita, B.G. Sumpter, C.D. Sherrill, J. Chem. Phys. 134 (2011) 084107.
[55] O.A. Vydrov, T.J. Van Voorhis, J. Chem. Phys. 133 (2010) 244103.
[56] (a) Y. Zhao, D.G. Truhlar, Theor. Chem. Acc. 120 (2008) 215-241; (b) J. Chem. Theor. Comput. 4 (2008) 1849-1868.
[57] N. Tasinato, S. Grimme, Phys. Chem. Chem. Phys. 17 (2015) 5659-5669.
[58] N. Tasinato, A. Turchetto, P. Stoppa, A. Pietropolli Charmet, S. Giorgianni, J. Chem. Phys. 142 (2015) 134310.
[59] M. Delle Piane, S. Vaccari, M. Corno, P. Ugliengo, J. Phys. Chem. A 118 (2014) 58015807. [60] M. Delle Piane, M. Corno, P. Ugliengo, P. J. Chem. Theory Comput. 9 (2013) 2404-2415. [61] S. Grimme, J. Antony, S. Ehrlich, H.A. Krieg, J. Chem. Phys. 132 (2010) 154104.
[62] S. Grimme, J. Comput. Chem. 27 (2006) 1787-1799. [63] P. Hobza, J. Šponer, Chem. Rev. 99 (1999) 3247-3276. [64] S.F. Boys, F. Bernardi, Mol. Phys. 19 (1970) 553-566.
[65] J. Scaranto, A. Pietropolli Charmet, P. Stoppa, S. Giorgianni, J. Mol. Struct. 741 (2005) 213219.
[66] J. Scaranto, A. Pietropolli Charmet, S. Giorgianni, J. Phys. Chem. C 112 (2008) 9443-9447. [67] J. Scaranto, P. Stoppa, A. Pietropolli Charmet, S. Giorgianni, Mol. Phys. 107 (2009) 237244. [68] R.G. Stone, W.H. Flygare, J. Mol. Spectrosc. 32 (1969) 233-241.
22
[70] P. Ugliengo "MOLDRAW: A Program to Display and Manipulate Molecular and Crystal Structures", Torino (2006) available on the web at: "http:www.moldraw.unito.it.
[71] H. Kruse, L. Goerigk, S. Grimme, J. Org. Chem. 77 (2012) 10824-10834. [72] http://cccbdb.nist.gov/
[73] J.P. Merrick, D. Moran, L. Radom, J. Phys. Chem. A 111 (2007) 11683-11700.
Figure Captions
Figure 1. Structure and labeling of atoms of the F2C=CFCl molecule.
Figure 2. (a) Vibrational spectrum of gas phase F2C=CFCl between 900 and 2000 cm-1 showing the relevant fundamental vibrations. (b) Differential DRIFT spectra of F2C=CFCl adsorbed on TiO2 in the 900 - 2000 cm-1 region, obtained using different loadings of F
2C=CFCl: (1) 343 Pa; (2) 653 Pa; (3) 1245 Pa. The solid substrate is composed of 50% TiO2 nano-powder and 50% KBr. The relevant absorptions are indicated.
Figure 3. Comparison of the band shapes and intensities in the free (dash dotted line) and adsorption (solid line) spectra of F2C=CFCl under the same experimental conditions. Inset: a magnified view of the 4 band region. The absorptions due to the adsorbed molecule are indicated by the arrows, note the change in the intensities in correspondence of the 1, 2 and 3 vibrations.
Figure 4. Interaction configurations (MI – MV) considered for the ab initio modeling of the adsorption of F2C=CFCl on the TiO2 anatase (1 0 1) surface.
Figure 5. (a) Computed vibrational spectra of F2C=CFCl adsorbed on TiO2 anatase (1 0 1) and comparison to the experimental spectrum (b). In panel (a) the lower trace refers to the spectrum obtained from the weighted average of models MI, MIII and MV, while in the upper trace only the adsorption models MI and MV are considered. The asterisk denotes the band at 1283 cm-1, see text for discussion.
24
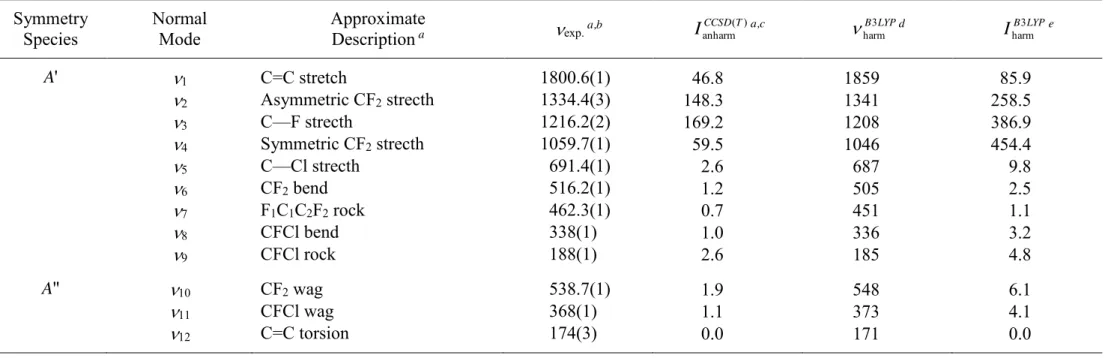
Table 1. Approximate description, experimental wavenumbers (cm-1), theoretical anharmonic and harmonic intensities (km mol-1) of gas phase
F2C=CFCl normal modes of vibration
Symmetry Species
Normal Mode
Approximate
Description a exp. a,b
) ( anharmCCSDT I a,c B3LYP harm d IB LYP 3 harm e A' 1 C=C stretch 1800.6(1) 46.8 1859 85.9 2 Asymmetric CF2 strecth 1334.4(3) 148.3 1341 258.5 3 C—F strecth 1216.2(2) 169.2 1208 386.9 4 Symmetric CF2 strecth 1059.7(1) 59.5 1046 454.4 5 C—Cl strecth 691.4(1) 2.6 687 9.8 6 CF2 bend 516.2(1) 1.2 505 2.5 7 F1C1C2F2 rock 462.3(1) 0.7 451 1.1 8 CFCl bend 338(1) 1.0 336 3.2 9 CFCl rock 188(1) 2.6 185 4.8 A" 10 CF2 wag 538.7(1) 1.9 548 6.1 11 CFCl wag 368(1) 1.1 373 4.1 12 C=C torsion 174(3) 0.0 171 0.0 a From Ref. [14].
b Figures in parentheses represent experimental uncertainties in the units of the last significant digits. c Anharmonic intensities computed at CCSD(T)/cc-pVTZ level.
d Harmonic wavenumbers computed at B3LYP/6-31G(d') level. e Harmonic intensities computed at B3LYP/6-31G(d') level.
Table 2. Main structural parameters of F2C=CFCl in the gas phase and adsorbed on anatase (1 0 1) computed at B3LYP/6-31G(d') level a
Gas phase F2C=CFCl F2C=CFCl @ TiO2 anatase (1 0 1)
Exp. b CCSD(T)/cc-pVTZ c B3LYP/6-31G(d') MI MII MIII MIV MV
C1=C2 1.310 1.332 1.330 1.326 1.328 1.331 1.330 1.327 F1—C1 1.323 1.314 1.331 1.366 1.356 1.322 1.333 1.36 F3—C2 1.328 1.313 1.348 1.344 1.335 1.377 1.348 1.341 F2—C1 1.328 1.330 1.330 1.366 1.321 1.328 1.322 1.321 Cl—C2 1.700 1.709 1.719 1.786 1.719 1.699 1.726 1.714 2 1 1CˆC F 125.0 123.4 123.3 126.4 121.5 124.6 122.6 121.2 2 1 2Cˆ C F 123.6 123.9 123.9 121.7 126.3 122.5 124.4 126.1 3 2 1Cˆ F C 124.5 120.3 120.3 119.5 121.6 119.2 120.6 120.4 Cl Cˆ C1 2 123.3 123.8 124.3 125.1 122.7 126.0 125.1 123.7 Ti F1 3.537 2.243 3.789 5.895 2.243 Ti F2 2.203 3.791 5.416 4.224 3.642 Ti C1 3.163 3.480 3.542 4.987 3.266 Ti C2 4.133 4.584 4.088 4.667 4.248 Ti F3 5.252 4.369 2.235 5.804 4.475 Ti Cl 4.621 6.151 4.800 3.266 5.754 O F1 3.151 2.942 2.938 4.872 2.827 O F2 2.748 3.426 4.996 3.003 3.371 O C1 2.883 3.727 3.780 4.096 3.370 O C2 3.544 3.992 3.751 4.750 3.971 O F3 4.341 3.267 2.877 5.597 4.110 O Cl 4.033 5.484 3.827 3.054 5.283
a Bond lengths and angles in Å and deg, respectively b From Ref. [68].
26 Table 3. Interaction energies (kJ mol-1) for the adsorption of F
2C=CFCl on anatase (1 0 1) according to the different ensemble configurations
Adsorption configuration E B3LYP/6-31G(d') E(CP) B3LYP/6-31G(d') a E B3LYP/TZV E(CP) B3LYP/TZV b EdispCP B3LYP-D2/TZV c
MI -56.1 -13.8 -42.7 -8.8 -45.6
MII -45.2 -1.7 -27.2 4.6 -27.6
MIII -46.0 -3.3 -28.5 2.5 -30.5
MIV -14.2 3.8 -6.3 7.9 -17.2
MV -50.2 -9.2 -37.2 -4.6 -41.0
a Counterpoise corrected interaction energy at B3LYP/6-31G(d') level. b Counterpoise corrected interaction energy at B3LYP/TZV level.
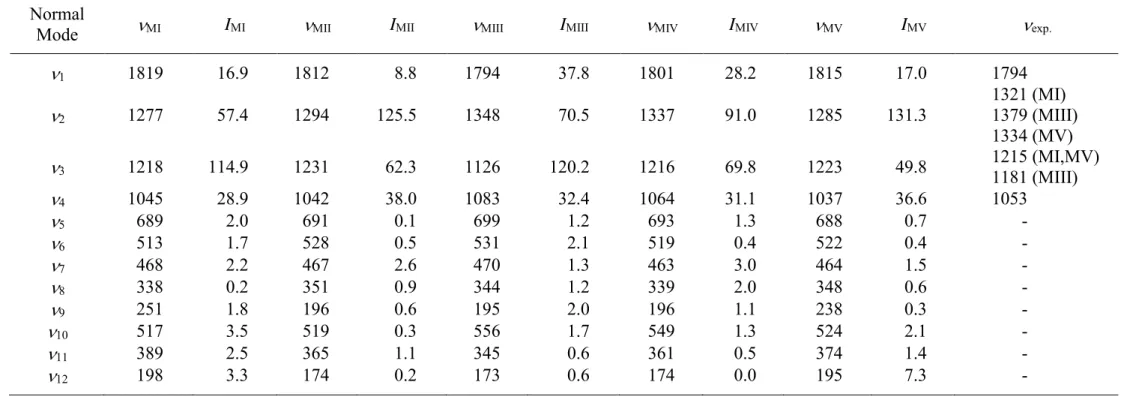
Table 4. Vibrational wavenumbers (cm-1) and intensities (km mol-1) for F
2C=CFCl adsorbed on TiO2 anatase (1 0 1) obtained at B3LYP/6-31G(d')
level and relation to DRIFT measurements of halon 1113 adsorbed on TiO2 nano-powder
Normal
Mode MI IMI MII IMII MIII IMIII MIV IMIV MV IMV exp.
1 1819 16.9 1812 8.8 1794 37.8 1801 28.2 1815 17.0 1794 2 1277 57.4 1294 125.5 1348 70.5 1337 91.0 1285 131.3 1321 (MI) 1379 (MIII) 1334 (MV) 3 1218 114.9 1231 62.3 1126 120.2 1216 69.8 1223 49.8 1215 (MI,MV) 1181 (MIII) 4 1045 28.9 1042 38.0 1083 32.4 1064 31.1 1037 36.6 1053 5 689 2.0 691 0.1 699 1.2 693 1.3 688 0.7 - 6 513 1.7 528 0.5 531 2.1 519 0.4 522 0.4 - 7 468 2.2 467 2.6 470 1.3 463 3.0 464 1.5 - 8 338 0.2 351 0.9 344 1.2 339 2.0 348 0.6 - 9 251 1.8 196 0.6 195 2.0 196 1.1 238 0.3 - 10 517 3.5 519 0.3 556 1.7 549 1.3 524 2.1 - 11 389 2.5 365 1.1 345 0.6 361 0.5 374 1.4 - 12 198 3.3 174 0.2 173 0.6 174 0.0 195 7.3 -