9.0 Abstract
This paper aims to assess the impact of ageing on household portfolios in Italy and hence ultimately on fi nancial markets. To this end, the analysis is carried out in two steps. First, the dimension of population ageing in Italy is assessed by means of both historical and forecast data on the structure of Italian population. Second, based on data taken from the Bank of Italy Survey of Household Income and Wealth (SHIW) over the last decade, we analyse the average household portfolio in relation to demographic characteristics. The main fi ndings are: fi rst, Italy turns out to be one of the countries most affected by ageing; second, fi nancial choices of Italian households are sensi-bly affected by age. Thus, the exceptional ageing in Italy might have relevant consequences on the Italian fi nancial market.
9.1 Introduction
Ageing can sensibly affect fi nancial markets, since elderly people usually have lower saving rates and higher average risk aversion. Thus, ageing is going to bring about a progressive evolution of fi nancial needs and invest-ment requireinvest-ments, which may in turn translate into changes in prices and returns of existing fi nancial instruments and in the need for new ones. A lively debate on the fi nancial effects of ageing is ongoing among both academ-ics and practitioners and has originated a vast literature constituted by both theoretical and empirical contributions. The latter in particular have sensibly increased over the last few years, also fostered by the increasing availability of suitable survey-datasets. Furthermore, a particular strand of this empirical literature has recently focussed on the effects that ageing may have on fi nan-cial asset returns and portfolio allocations: see, among others, Yoo (1994), Poterba (2001, 2004), Davis and Li (2003) and Ameriks and Zeldes (2004).
These works are far from being homogeneous with regards to both the methodology used and the results obtained. As for the methodology, the empirical investigations are carried out using different approaches, which in the present paper are grouped into three main categories and are addressed as follows: (i) the “explorative approach”, which analyses and interprets trends in survey data; (ii) the “econometric approach”, which runs time-series or panel data analyses; and (iii) the “simulation approach”, which performs empirical simulations on suitably structured overlapping-generation models. As for the results, while some authors report signifi cant effects of ageing on
Marianna Brunetti and Costanza Torricelli
brunetti.indd 180
fi nancial markets (e.g Yoo, 1994), others fi nd only a weak, if any, relation-ship between demographic and fi nancial variables (e.g. Poterba 2001, 2004). Moreover, up to date empirical studies analyse the Italian case only rarely and quite marginally and this despite Italy is, together with Japan, one of the countries where the ageing phenomenon is more accentuated.
Based on the latter observation, the specifi c aim of this paper is to asses the impact of ageing on household portfolio allocation in Italy. To this end, the analysis is carried out in two steps.
First, the ageing in Italy is analysed by means of both historical and forecast data on the structure of Italian population. More specifi cally, the phenomenon of ageing is described using data on the evolution of median age as well as dependency ratios over the last fi fty years. In addition, data on birth, mortality and immigration rates are employed to better identify the main causes of the demographic evolutions occurred in Italy.
Second, the effects that the demographic characteristics of Italian house-holds may have on their fi nancial portfolios are studied. We follow Guiso and Jappelli (2001) and employ data taken from subsequent issues of the Bank of Italy Survey of Households Income and Wealth (SHIW). Our analyses differ from the previous one by Guiso and Jappelli (2001) in three extents: fi rst, we consider a subsequent period of time; second, we propose a risk-classifi cation of fi nancial assets and third, we refi ne the analyses by separating households by both age-classes and Net Wealth quartiles, thereby testing the robustness of age-effect on fi nancial choices.
The paper is structured as follows. In the next section the main stylized facts about ageing in Italy are analysed and discussed at a comparative level with respect to the rest of the world and in particular with Europe. The inves-tigation over the effects of ageing on household portfolios in Italy is presented in section 9.3. The fi nal section concludes.
9.2 Population ageing around the world and in Italy
Although population is a world-wide phenomenon, its size sensibly differs across countries. The fi rst step of our research assesses the magnitude of the phenomenon in Italy with respect to other developed countries and in par-ticular to the European ones. Data are taken from two international databases, namely those provided by United Nations (UN), for the comparison with the major world-regions, and Eurostat, used instead for the analyses specifi cally focussed on Italy1.
The changes in the population age-structure can be assessed by means of different measures, which can either relate only to the demographic structure
1 Data are available on the United Nation Population Division website: http://esa.un.org/unpp/ and on the Eurostat website: http://epp.eurostat.cec.eu.int/
brunetti.indd 181
of the population, and are thus univocally defi ned, or depend also on institu-tional factors (e.g. pension systems) beside the demographic ones. As for the former type of measure, the most widespread ones are: the median age, the average age and the life expectancy at birth. As for the latter, the most well known is probably the old-dependency ratio that is the relative amount of retired people to the working-age population.
9.2.1 A comparative analysis
The comparative analysis of the demographic evolution occurring in Europe and in the rest of the world is performed using data over the period 1950-2050 and taken from the UN demographic dataset2. In particular,
here we focus on the following demographic measures: (i) median age; (ii) life-expectancy; and (iii) old-dependency ratio, defi ned as the ratio of aged 65 or more to aged 15-64. Main fi ndings are summarised in Figure 9.1 and in table 9.1.
Figure 9.1 Old-dependency ratio from 1950 to 2050: major world-regions.
Data Source: United Nations Population Prospects.
2 Both UN and Eurostat databases provide several demographic “projections variants”, obtained combin-ing different hypotheses on fertility, mortality and net migration rates. Data used in the followcombin-ing analyses refer to the variants refereed to as the most likely for the future in the two databases, namely “Constant-fertility” for UN and “Baseline” for Eurostat.
brunetti.indd 182
Table 9.1 Past, present and future demographic measures: major world-regions
World-Zone Years Median Age ExpectancyLife Old-dependency ratio
Africa 1950 19 38.4 6 2005 18.9 50 6 2050 18.6 65.3 8 Asia 1950 22 41.4 7 2005 27.7 68.7 10 2050 32.8 76.9 23 Europe 1950 29.7 65.6 13 2005 39 74.3 23 2050 50.1 80.7 51 Latin America 1950 20.2 51.4 7 2005 25.9 72.9 10 2050 33.1 79.4 25 North America 1950 29.8 68.8 13 2005 36.3 78.2 18 2050 40 82.7 33 Oceania 1950 28 60.4 12 2005 32.3 75 15 2050 35.9 80.5 28 Japan 1950 22.3 63.9 8 2005 42.9 82.8 30 2050 56.2 88.3 77
Data Source: United Nations Population Prospects.
The most severe population ageing is being experienced by Japan and Europe: in both countries median age and old-dependency ratios have increased much more than in the rest of the world. We thus restrict our atten-tion to these two areas and we disaggregate the analysis for the 25 countries of the European Union to further focus on the case of Italy. For reasons of space we report only the old-dependency ratio: Table 9.2 ranks countries according to the value expected for this demographic indicator in 20503.
3 Similar tables made according to other demographic measures (available upon request) are consistent with table 9.2
brunetti.indd 183
brunetti.indd 184
Table 9.2 Old-dependency ratios.
Country 1950 2005 2050 Country 1950 2005 2050 Japan 8 30 77 Lithuania 15 23 52 Italy 13 30 75 Malta 10 20 52 Spain 11 24 72 Belgium 16 27 50 Czech Republic 12 20 64 France 17 25 48 Slovenia 11 22 64 Estonia 17 24 47 Austria 16 25 58 Finland 11 24 47 Greece 11 27 57 Netherlands 12 21 45 Portugal 11 25 57 Sweden 15 26 44 Slovakia 10 17 57 Ireland 18 16 43 Latvia 18 25 55 United Kingdom 16 24 40 Poland 8 18 55 Cyprus 10 18 38 Germany 14 28 54 Denmark 14 23 38 Hungary 11 22 53 Luxembourg 14 21 36
Data Source: United Nations Population Prospects.
Two observations are in order. First, the process of population ageing seems to be quite strong in several of the new EU members, especially Slov-enia and Czech Republic4. Second, Italy is the sole country whose projections
are as high as Japan’s.
In fact, Italy is fi rst together with Japan for the future value of median age, which by 2050 is expected to attain the value of 56.2 in both countries. The same holds for old-dependency ratio, whose value is second only to Japan. As for life expectancy in 2050, Italy (85.1) is third after Japan (88.3) and Sweden (85.5), whereby the latter already experiences one among the highest life expectancies in Europe.
In sum, two separate conclusions can be drawn. First, Europe emerges together with Japan as one of the world areas most affl icted by population ageing. Second, within Europe Italy defi nitely emerges for the strength of the undergoing transformations of its age-structure.
9.2.2 What is peculiar in Italy?
4 A huge debate is currently ongoing on the population ageing in the Eastern European countries and on the policy implications that it may have on the whole European Union. See, among others, Kucera et al. (2000) and the studies performed within the research program “Demographic & Social Change in Eastern Europe” carried out by the Department of Development Sociology of Cornell University, the Demography and Geodemography Department of the Charles University of Prague and the Department of Sociology of the University of Bucharest in Romania together with the Universities of Central Florida and Kansas State and the Echo Survey Sociological Research Institute (Hungary).
brunetti.indd 185
In order to better understand the peculiarity of the Italian case we analyse in deeper details the following features:
1) the past and future dynamics median age, life expectancy and old-dependency ratio;
2) the distribution of different age-classes over the entire population at different points in time, namely 1950, 1975, 2005, 2025 and 2050. Initially, the standard three age-classes are considered, i.e. young, middle-aged and old, whereby the defi nitions of each category are as in the previous section. Then, the population age-structure and its evolution are further detailed and twenty 5-year age-classes are considered rather than the three macro-classes considered so far.
3) the factors that typically underlie demographic transitions, i.e. fertility, mortality and migration. The trend of each factor is observed over the last 50-year period, in order to see if and to what extent each element has a role in the Italian ageing. Note that for this point we turned to Eurostat dataset as it supplies more detailed demographic measures.
As for the fi rst point, Table 9.3 reports the past (1950), the current (2005) and the projected future values (2050) for Italian median age, life expectancy at birth and old-dependency ratio.
Table 9.3 Main demographic measures for Italy, 1950-2050.
Demographic Measure 1950 2005 2050 Median Age 29 42.3 56.2 Life Expectancy 66 80.6 85.1 Old-dependency Ratio 13 30 75
Data Source: United Nations Population Prospects.
Since the mid of last century Italian median age has risen from 29 to 42.3 years and a similar increase is expected to occur by 2050, when it is projected to reach 56.2 years. Analogously, life expectancy has also increased (on aver-age three months every year) and a further enhancement is estimated over the next 50-year period. The most remarkable change has been recorded by the old-dependency ratio, jumped from 13 in 1950 to 30 in 2005 and expected to more than double by 2050 when, according to UN projections, in Italy there will be around 75 retired every 100 working people.
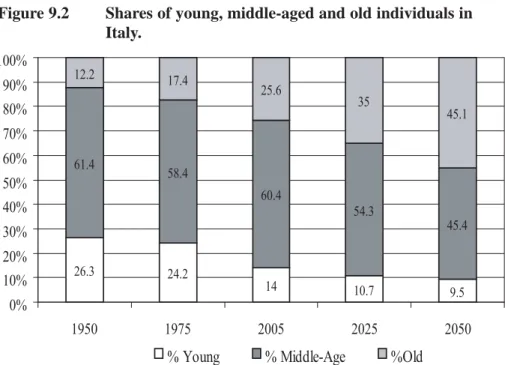
As for the dynamics of different age classes, the dramatic Italian demo-graphic evolution is highlighted by Figure 9.2, where the shares of young, middle-aged and old people over the entire Italian population are plotted at fi ve different points in time, two in the past (1950 and 1975), one current (2005) and two in the future (2025 and 2050).
brunetti.indd 186
During the last 50 years, the share of middle-aged has remained almost unchanged while young people have decreased by more than 10 percentage points. Conversely, the proportion of elderly has undergone a progressive enlargement, raising from the 12.2% of the total Italian population of 1950 to the 25,6% reached in 2005. The projections for the next 50-year period point towards a further enhancement of the phenomenon. The working-age popula-tion is likely to shrink more and more relatively to inactive individuals and in particular to elderly people: the greying population is enlarging up to 35% in 2025 and to more than 45% by 2050, when they will be nearly as numerous as middle-aged people.
Figure 9.2 Shares of young, middle-aged and old individuals in Italy.
Data Source: United Nations Population Prospects.
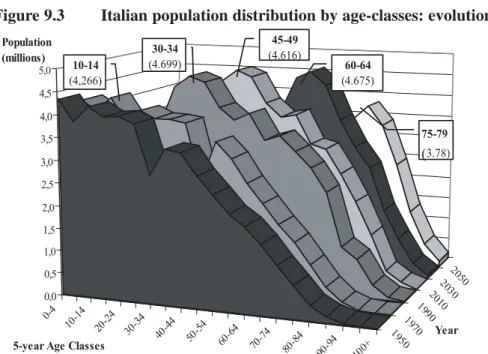
Figure 9.3 represents the Italian demographic evolution more in details as smaller age-classes, of 5 years each, are used. The distribution of Italian population is represented at various points in time, namely 1950, 1960, 1990, 2010, 2030 and 2050. The baby boom, occurred in Italy during the 1960s, is clearly visible as the population peak, which represents the baby boom-ers generation, moves as a wave: in 1970s it corresponds to the very young (around 10-14 years old) part of the population, at the beginning of the new century it represents the middle-aged (30-34) and late-middle-aged (45-49) and at the end of 2050s those aged around 75-79: thus, up to the mid of this century the baby boomers will still represent the most conspicuous age-class
brunetti.indd 187
of the population, being almost 4 million people.
Figure 9.3 Italian population distribution by age-classes: evolution.
Data Source: United Nations Population Prospects.
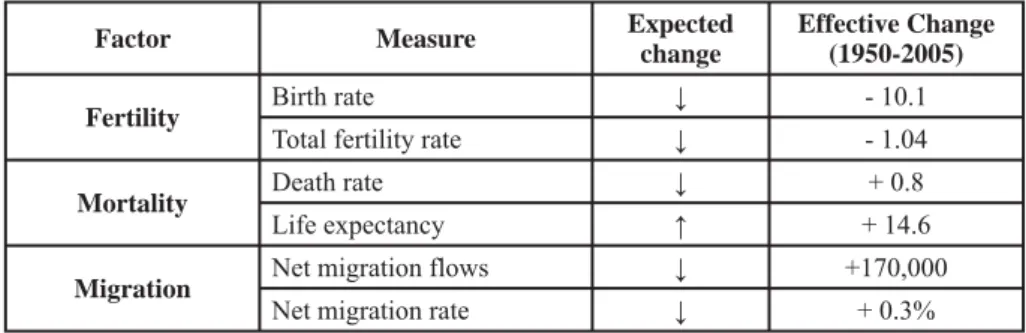
Finally, in order to single out the major causes of this exceptional demo-graphic transition, we examine the three main factors that drive demodemo-graphic changes: i.e. fertility, mortality and migration fl ows. In fact, population age-ing might stem from a relative decrease in fertility, a relative lower mortality (i.e. greater longevity) and/or a relative decline in the net migration. The directions that each factor is expected to take to lead to population ageing are summed up in the third column of Table 9.4.
In order aim to clarify which among them has played the major role in the Italian ageing experience, the historical evolution of each factor is observed over the last 50-year period (15-year for migration) by means of different measures. More specifi cally, fertility is assessed by means of birth rate (ratio of births to average population) and total fertility rate (average number of children born to a woman), mortality by means of life expectancy and death rate (ratio of deaths to average population) and migration fl ows by net migra-tion (difference between immigrants and emigrants) and net migramigra-tion rate (net migration to country population)5.
5 Others measures could have been considered. Fertility measures include the absolute number of births and the net (gross) reproduction rate, i.e. the average number of daughters that would be born to a woman subjected to the current fertility and (neglecting) mortality conditions. Similarly, mortality can be assessed by means of the absolute number of deaths. Here, we select relative rather than absolute and complete rather
brunetti.indd 188
Table 9.4 Factors underlying ageing: theoretical and effective changes.
Factor Measure Expected change
Effective Change (1950-2005) Fertility Birth rate ↓ - 10.1
Total fertility rate ↓ - 1.04 Mortality Death rate ↓ + 0.8 Life expectancy ↑ + 14.6 Migration Net migration flows ↓ +170,000
Net migration rate ↓ + 0.3%
Note: data for migration refer to the period 1985-2000 only. Source: authors’ computations on Eurostat Demographic Database.
Figure 9.4 plots the evolution of absolute number of (live) births and of the birth rate from 1950 to 2005. Both births and birth rate follow an “s” pattern. First, a peak is highlighted between 1955 and late 1960s, which clearly denotes the baby boom occurred in Italy after the Second World War. Immediately after, there is a substantial drop which makes the birth rate more than halve before stabilizing around the current level of 8.2. A very similar pattern is followed by the total fertility rate (see Figure 9.5). According to the expectations, all the indicators examined point towards a substantial decline in fertility.
Figure 9.4 Absolute number of births and birth rate in Italy, 1950-2005.
Note: values for births are on the left scale; those for birth-rate are on the right-hand-side one. Data Source: Eurostat Demographic Database.
than partial measures (e.g. reproduction rates consider the number of daughters only).
brunetti.indd 189
Figure 9.5 Total fertility rate in Italy, 1950-2005.
Data Source: Eurostat Demographic Database.
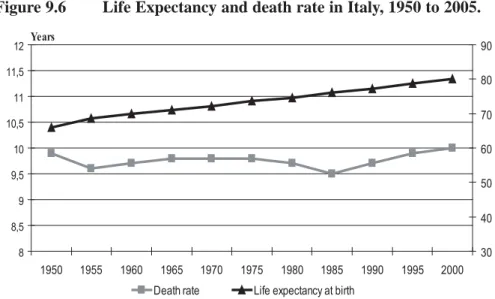
Figure 9.6 plots life expectancy and the death rate in Italy over the period 1950-2005. While the latter has only slightly increased Both increased over the last 50 years (by 0.8 percentage points), life expectancy has risen form the 66 years that a newborn in 1950 was expected to live to the current 80.6 years, thereby more than offsetting the negative effects that the death rate increase could have had on population ageing.
Figure 9.6 Life Expectancy and death rate in Italy, 1950 to 2005.
Data Source: Eurostat Demographic Database.
brunetti.indd 190
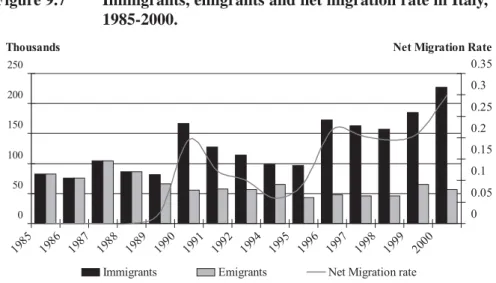
Finally, the number of immigrants, the number of emigrants and the net migration rate over the period 1985-2000 are plotted in Figure 9.7. While the number of emigrants has remained almost unchanged, the number of immi-grants has progressively increased, reaching more than 200,000 units. As a result, net migration fl ows have boosted from around zero in the late 1980s to more than 170,000 net migrants recorded in 2000. As a consequence, net migration rate jumped from zero to 0.3.
Figure 9.7 Immigrants, emigrants and net migration rate in Italy, 1985-2000.
Note: values for immigrants and emigrants (columns) can be read on the left scale; those for the net migrants (line) on the right-hand-side one.
Data Source: Eurostat Demographic Database.
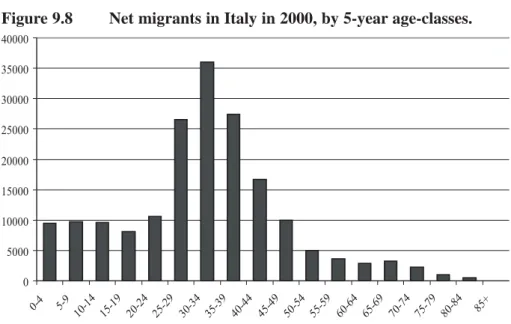
The distribution of immigrants and emigrants by 5-year age-group has been examined for each year of available data (from 1989 to 2000 included). However, since the distribution seems to remain unchanged across all years, in what follows we report only the results referred to the most recent data, i.e. 2000.
As reported in Figure 9.7, net migration typically occurs during work-ing-age: in effect, in 2000 the most conspicuous group of net migrants was aged between 35 and 39 years, and more than 68.5% of all net migrants were between 25 and 50. According to this evidence, the increase in net migration fl ows recorded in Italy in the last years has mitigated the effects of population ageing by widening the working-age population6.
6 The mitigating effect that an increased net migration has on population ageing is only temporary. As time goes by in fact immigrants grow older and join the domestic retired population. Additionally, evidence sug-gests that immigrating households tend to adapt their fertility choices to those of the destination country, thereby cancelling out the initial dampening effect on ageing. On this issue and specifi cally for Italian case see, among others, Martire and Zincato (2005) and reference therein.
brunetti.indd 191
Figure 9.8 Net migrants in Italy in 2000, by 5-year age-classes.
Data Source: Eurostat Demographic Database.
To sum up, in the last 50-year period (restricted to a 15-year period for migration) in Italy: net migration fl ows have sensibly increased, mortality has undergone only a small decline (death rate has increased but life expectancy has also considerably lengthened) and fertility has recorded a signifi cant drop. Based on this evidence, the reduced fertility is thus recognised as the main determinant for the unique Italian population ageing.
9.3 Ageing and portfolio choices of Italian Households
In this section we present some evidence on the relationship between demographic dynamics and household fi nancial portfolio in Italy. To this end, we fi rst frame our analysis within the existing literature and then we illustrate methodology, dataset and results.
9.3.1. The approach and the literature
In order to test the relationship between demographic changes and house-hold fi nancial portfolio three different approaches are in principle possible: (i) the “explorative approach”, in which trends in survey data are analysed and interpreted; (ii) the “econometric approach”, which essentially runs time-series or panel data analyses; and (iii) the “simulation approach”, which car-ries out empirical simulations on suitably structured overlapping-generation models. In this paper we take the fi rst approach to depict what has changed so
brunetti.indd 192
far in the fi nancial portfolios of Italian households and whether these changes can be traced back to demographic factors.
The literature on the issue is not yet vast and, as far as we know, Guiso and Jappelli (2001) is the only empirical contribution specifi cally focussed on the Italian case. As a fi rst step, the authors provide a detailed account of Italian household portfolio evolution since the beginning of 1990s, using data from the 1989, 1991, 1993, 1995, 1998 editions of the Bank of Italy Survey of Household Income and Wealth. Next, they try to depict the primary deter-minants of its composition. The authors group the various fi nancial assets in three main categories: safe (e.g. bank accounts), fairly safe (e.g. T-Bills and similar) and risky (e.g. stocks, long-term government bonds and mutual funds) and use this classifi cation in both the “explorative” and the “economet-ric” analyses. As for the former, they observe the trends of the portfolio shares invested in each category along the period under analysis and report that the composition of Italian household portfolio has dramatically changed. More specifi cally, the share of safe and fairly safe assets has reduced from 45.7% to 25% while that of risky assets is higher than ever before: at the beginning of 1990s stocks represented around 16% of total fi nancial wealth while at the end of the decade they represented around 47%. According to the authors, several “macroeconomic” circumstances may have taken part in these chang-es: the decline in short-term bond nominal yield coupled with the increase of equities returns that characterize the entire 1990s, the liberalization of capital market which encouraged international diversifi cation starting from 1989, the birth of mutual funds in 1984 and the privatisation in 1992 which most likely boosted market capitalization, as well as the social security reforms which fostered the development of life insurances and pension funds. Neverthe-less, specifi c household features, such as wealth, education and age may also have affected these changes in portfolio allocation. Guiso and Jappelli (2001) thus focus on the 1989-1995 period and study whether or not these factors played a role in determining the riskier portfolio allocation. They distinguish between the decision concerning whether or not to hold risky assets, referred to as “participation decision”, and the (subsequent) one regarding the fi nal portfolio allocation, named “allocation decision”. The authors report that that age, wealth and education may actually have determined the participation decision. As for age in particular, they report hump-shaped profi le: the share of people investing in risky assets increases from around 15% of the young (i.e. those aged less than 30) to almost 20% of the middle-aged (between 30 and 59 years old) and then falls once again to around 10% for the 60-69 and to less than 7% for the over-70s. Conversely, the decision concerning the fi nal portfolio allocation seems to be affected by none of these factors. The authors turn then to an econometric analysis based on both cross-sectional and panel data. Both descriptive and regression analyses prove that age, together with
brunetti.indd 193
wealth and education, may have a substantial infl uence on the choice concern-ing whether or not to invest in risky assets, while once this decision is taken these factors only slightly affect the fi nal portfolio allocation7.
9.3.2 Methodology
Data span over the 1995 – 2004 decade and are taken from the Histori-cal Archive of the Bank of Italy Survey of Household Income and Wealth (HA-SHIW). Among other things, the dataset offers a detailed picture of the fi nancial portfolio held by the interviewed households, as it provides the amounts (expressed in Italian lira until 2000 and in Euro thereafter) invested in a variety of fi nancial assets.
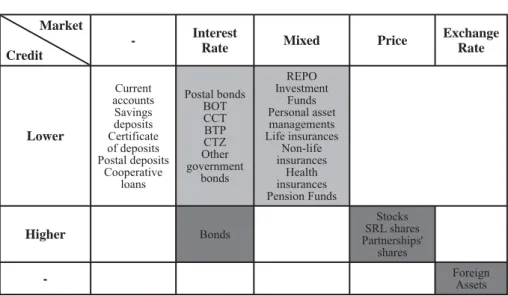
In order to allow a better comparability across time, we translate amounts into percentages. Furthermore, all the assets are grouped into different classes according to their risk profi les, in order to avoid reporting residual items separately and to allow thus a clearer exposition. In the risk classifi cation, the focus is centred on two kinds of risks only, namely credit risk and market risk.
As for the former, we distinguish two different levels. Specifi cally, the “Lower” level is assigned to fi nancial assets issued by both the domestic sov-ereign (i.e. Italian government) and by banks, securities fi rms and coopera-tives, based on the always more stringent supervising regulations introduced by the Basel II Accord and of the several security provisions provided for by the law specifi cally aimed to make banks and fi nancial systems as safe as possible. The “Higher” level is instead associated to all the assets issued by the remaining agents, basically corporations. Foreign activities are treated separately as the amounts provided by the HA-SHIW are not distinguished by resided and non-residents issuers, so that a more precise credit-risk clas-sifi cation for these assets is not possible.
As far as market risk is concerned, three main forms are considered, i.e.: • Exchange-rate risk, concerning the foreign activities only
• Interest-rate risk, associated with all bonds securities • Price risk, associated to stocks and shareholdings
7 Guiso and Jappelli (2001) argue that participation costs, such as minimum investment requirements, transaction and information costs are quite substantial in Italy and may thus interpret these results. Par-ticipation costs do not directly change with age; however, only investors who are holding risky assets for a relatively long time will actually face them. Conversely, those who need more liquid assets, i.e. those with a higher probability of liquidating risky assets, will be more reluctant to buy. As a consequence, households with short-term liquidity needs are less likely to buy assets that require fi xed entry costs. Typi-cally, households with liquidity needs are either those young facing liquidity constraints or high income variability, or those retired, who face uninsured health risks. In sum, health risk and credit market imperfec-tions, which single out retired and young households respectively, may be at the base of the hump-shaped participation.
brunetti.indd 194
In addition, a fourth market-risk category, referred to as “mixed”, is cre-ated for those kinds of investments where bonds (interest-rate risk) and stocks (price risk) are mixed together (see Table 9.5).
Table 9.5 Financial assets classifi cation, by credit and market risk
Market Credit
- Interest
Rate Mixed Price
Exchange Rate Lower Current accounts Savings deposits Certificate of deposits Postal deposits Cooperative loans Postal bonds BOT CCT BTP CTZ Other government bonds REPO Investment Funds Personal asset managements Life insurances Non-life insurances Health insurances Pension Funds Higher Bonds Stocks SRL shares Partnerships' shares - Foreign Assets
Note: Shaded cells indicate comparable risk-profiles: light grey denotes safer assets, more intense grey indicates fairly safe assets and dark grey gathers the risky ones.
Six main fi nancial-asset groups beside cash are thus identifi ed8:
1. DEPOSITS: lower credit risk and no market risk
2. GOVERMENT BONDS: lower credit risk and interest-rate risk 3. CORPORATE BONDS: higher credit risk and interest-rate risk 4. MANAGED INVESTMENTS: lower credit risk and mixed market-risk
5. STOCKS: higher credit risk and price-risk 6. FOREIGN ASSETS: exchange-rate risk
Two observations are in order. First, in the following analyses values for life-insurances and pension funds will be presented separately, as the focus of this study makes their single evolutions particularly interesting. Second,
8 This classifi cation is only indicative as it neglects all the other forms of risk that actually characterize fi nancial assets, such as liquidity risk. On the other hand, a more rigorous classifi cation was not possible because of lack of information. As an example, the risk profi les of government bonds may be high or low depending, among other things, on their time-to-maturity. The data however do not provide any information about the duration of these instruments, so that all government bonds have to be placed in the same risk-class. Nevertheless, this simplifi cation seems consistent with the perceptions of the majority of households, which typically associate a comparable level of risk to all government bonds.
brunetti.indd 195
following Guiso and Jappelli (2001) fi nancial assets will be in some cases further grouped in three risk-categories: “clearly safe”, “fairly safe” and “risky”. Differently from the previous study, clearly safe assets include cash and deposits, fairly safe assets include government bonds and managed investments and risky assets comprise corporate bonds, stocks and foreign activities (see Table 9.5)9.
The survey data analysis will thus be articulated into three phases. As a fi rst step, the evolution of the average portfolio of Italian households is observed across all the fi ve waves considered. The aim of this fi rst step is twofold: on one hand, it will highlight the main features of the average Italian household portfolio and in particular its low degree of diversifi cation. On the other, it allows examining whether and to what extent the average allocation of fi nancial wealth has actually changed over the last decade.
In order to depict a possible age-effect on Italian household portfolio, the households are then divided into six age-classes (<30, 30-39, 40-49, 50-59, 60-69 and >70) and for each of them the average portfolio is exam-ined. The placement in the age-classes is made according to the age of the head-of-the-household10.
Household fi nancial choices are affected by many other elements beside age: among these, the overall economic condition certainly plays a focal role. Based on this observation, we further refi ne the analysis in Guiso and Jappelli (2001) by dividing the households into both age-classes and Net Wealth (NW) quartiles, whereby NW is defi ned as the sum of real and fi nancial activities net of the fi nancial liabilities11. In this way, the robustness of the age-effect
on household fi nancial portfolio is tested even under different economic conditions. In addition, the top 5% richest households are separately studied, in order to see whether the age-effect persists also in extremely favourable economic conditions. Dividing the households into quartiles has a twofold utility. On one hand, it keeps the grouping comparable across time, without requiring adjustments for infl ation or for the shift Italian lira - Euro occurred in the middle of the decade under analysis. On the other, it creates four groups with the same sample numerousness, so that statistics computed on household average fi nancial portfolios are all equally statistically signifi cant. In sum, the last step of our analysis consists in examining the average portfolio
composi-9 Further details on the fi nancial asset risk-classifi cation are reported in Appendix.
10 According to the HA-SHIW, the head of the household could be either: the person who is the “most responsible of the fi nancial and economic choices of the household” (“declared” defi nition), the person who earns the highest income (“income” defi nition), or the person who represents the reference point to establish the relationships among all members of the household (“Eurostat” defi nition). Here, the fi rst defi nition is preferred as it is probably the most appropriate for the analyses performed.
11 Alternatively, the “household income” could have been used, defi ned as the sum of the personal in-comes of all the members, including capital and labour income as well as public transfers. Nevertheless, including real activities as well as eventual liabilities, the NW defi nitely provides a more complete measure of the actual economic condition of the household.
brunetti.indd 196
tion of all the interviewed households divided by age-classes and net wealth quartiles and to observe their evolution across the last decade.
The data presented in this phase of the study can be read in three directions (see Figure 9.9): (i) if read “vertically”, the data highlight the differences in fi nancial allocations of households belonging to the same age-class but to different NW quartiles; (ii) reading the data “horizontally” allows depicting the possible effect of age on the composition of household fi nancial portfolio, since the compositions are compared across different age-classes but compa-rable economic conditions; (iii) fi nally, reading the data “transversally” across the SHIW waves might highlight whether the average portfolio allocation of households of the same age-class and net wealth quartile has modifi ed or not, depicting in this way a possible time-effect. This intertemporal reading can be particularly interesting as it might reveal “indirect” effects of ageing, e.g. those induced by the several radical reforms brought to the social security system during the last decade and called for by the striking ageing of the Ital-ian population.
Figure 9.9 SHIW data: effects depicted by different reading directions.
9.3.3 Main results
9.3.3 The Italian household average portfolio in 1995-2004
As a fi rst step, the survey data are used to determine the average portfolio of Italian households in each of the fi ve waves available in the HA-SHIW for the decade 1995-2004. From this preliminary inspection it immediately emerges the scarce degree of diversifi cation of Italian household portfolios: during all the decade in fact Italian households hold on average more than 70% of their fi nancial wealth in cash and deposits (see Figure 9.10).
brunetti.indd 197
Figure 9.10 Average Household Portfolio by SHIW wave.
Source: own elaborations on HA-SHIW data.
This peculiarity was already mentioned by Guiso and Jappelli (2001), who for the 1989-1995 period reported that “the portfolios of Italian households
span few assets. A large fraction of the sample holds very few types of fi nan-cial instruments and tends to concentrate wealth in safe assets”. This
obser-vation is thus confi rmed also for the decade 1995-2004 (see Table 9.6)12. Table 9.6 Households holding liquidity only, by SHIW wave.
1995 1998 2000 2002 2004 Households in sample: 8,126 7,146 7,993 8,011 8,012 Of which holding:
Cash only: (14.25%)1158 (12.24%)875 (16.49%)1318 (16.98%)1360 (16.05%)1286 Cash and deposits: 3291
(40.49%) (44.31%)3167 (48.38%)3867 (53.96%)4323 (53.98%)4325
Data Source: HA-SHIW.
Table 9.7 reports the average shares invested by Italian households in each fi nancial-asset category as from the waves available between 1995 and 2004.
12 Ameriks and Zeldes (2004) perform similar analyses on US household portfolio and discard those units with such a low degree of diversifi cation. As the limited diversifi cation is a typical feature of Italian households’ portfolios, in this study all households are kept into the sample in order to get the outline of the average portfolio as realistic as possible.
brunetti.indd 198
Table 9.7 Average household portfolio by SHIW, various editions. Financial Assets 1995 1998 2000 2002 2004 Cash 21.75 18.15 22.20 22.57 21.12 Deposits 50.41 59.80 52.45 54.90 58.41 Government bonds 17.51 7.43 7.29 5.88 5.88 Corporate bonds 0.83 1.54 1.72 2.07 2.10 Stocks 1.14 2.40 3.49 3.19 2.61 Managed Investments 4.20 6.95 8.22 7.46 6.78 Life-Insurances 3.14 2.67 2.88 2.65 1.79 Pensions Funds 0.97 0.91 1.49 0.99 1.03 Foreign Activities 0.10 0.14 0.25 0.29 0.28 Total 100.0 100.0 100.0 100.0 100.0
Note: for each asset group, the table reports the share over total financial assets. Shares are computed as weighed averages using sample weights as from HA-SHIW.
Several observations are here in order. First, the share of cash has remained almost unchanged over the entire decade (around one fi fth of the average portfolio). By contrast, the incidence of government bonds has dras-tically reduced: in 2004 their share was only one third of the average value observed a decade before. Most likely, this change can be ascribed to the dras-tic reduction of Italian government bonds yields: in 1995 yields on short-term and long-term government bonds were respectively 10.7% and 12.7%, four years later they were respectively 2.7 and 3.7 and, after a fi rst recover around 2000-2001, both kept gradually decreasing during all the following years(see Figure 9.11). On the other hand, investments in corporate bonds have progres-sively increased, especially starting from 1998. The privatization process in this case might have played an important role: although started in 1992, in effect, the peak of privatizations occurred at the end of 1990s13.
13 For more details on the Italian major privatizazion see, among others, Goldstein (2003).
brunetti.indd 199
Figure 9.11 Mib30 and Government Bonds Yields over 1995-2005.
Note: values for Mib30 (left scale) are in index points while government yields (right scale) are percentages.
Data Source: Datastream
Survey data also prove that the average investment in stocks has under-gone several changes, which in large part occurred according with the major market fl uctuations of the last decade. Stock share has progressively increased until 2000, up to more than doubling in 5-year time, and then it has shrunk again, along with the contraction of Italian stock market (see Mib30 trend in Figure 9.11).
The same holds for managed investments, whose share increased from 4.2% in 1995 to 8.22% in 2000 and then shrunk back to 6.78% in 2004, although their weight has overall increased during the last decade.
As far as precautionary savings are concerned, survey data highlight how the share invested in life-insurances has progressively reduced (from 3.14% in 1995 to 1.79% in 2004). The average share of pension funds shows instead a particular increase around 2000: in fact, although they were introduced by the Dini Reform in 1995, they were enforced by appropriate laws only a couple of years later. Nevertheless, the launch of this form of complementary social security does not seem to have worked particularly well in Italy: after the initial increase, the pension fund share has reduced back to around 1%, i.e. the very same value recorded in the year of their introduction. Furthermore, although during the last decade the gap between life insurances and pension
brunetti.indd 200
funds has progressively thinned, the former are still somehow preferred with respect to the latter.
9.3.3.2 The average portfolio by age
Tables 9.8 to 9.12 report the average Italian household fi nancial portfolios by age-class for every wave available for the last decade in the HA-SHIW.
Table 9.8 Average portfolio by age-class, 1995.
<30 30-39 40-49 50-59 60-69 >70 Cash 19.18 18.06 16.17 17.08 24.28 32.67 Deposits 58.45 52.55 50.20 51.59 47.18 48.96 Government bonds 11.01 15.35 18.59 18.96 21.05 14.98 Corporate bonds 0.84 0.65 0.94 0.99 0.92 0.62 Stocks 0.32 1.04 1.11 2.06 1.00 0.64 Managed Investments 5.01 5.75 5.62 4.67 3.52 1.57 Life-Insurances 3.53 4.97 5.48 3.51 1.57 0.38 Pension funds 1.66 1.59 1.73 0.96 0.42 0.11 Foreign Activities 0.00 0.04 0.17 0.16 0.06 0.08 100.00 100.00 100.00 100.00 100.00 100.00
Table 9.9 Average portfolio by age-class, 1998.
<30 30-39 40-49 50-59 60-69 >70 Cash 16.78 12.27 13.70 14.93 20.62 27.47 Deposits 67.09 62.02 61.08 59.81 56.31 58.67 Government bonds 3.23 5.42 7.43 7.82 9.26 7.79 Corporate bonds 2.49 1.84 1.54 1.42 2.06 0.86 Stocks 0.94 2.83 2.79 3.12 2.31 1.43 Managed Investments 4.93 8.73 7.85 8.79 7.47 3.13 Life-Insurances 3.79 4.57 4.04 3.04 1.48 0.52 Pension funds 0.76 2.05 1.42 0.87 0.41 0.08 Foreign Activities 0.00 0.28 0.15 0.21 0.07 0.06 100.00 100.00 100.00 100.00 100.00 100.00 brunetti.indd 201 brunetti.indd 201 01.03.2007 17:09:3301.03.2007 17:09:33
Table 9.10 Average portfolio by age-class, 2000. <30 30-39 40-49 50-59 60-69 >70 Cash 26.03 18.02 20.09 21.02 22.68 27.04 Deposits 47.28 55.31 53.40 50.64 50.83 53.34 Government bonds 5.61 5.93 6.65 8.04 8.64 7.30 Corporate bonds 0.93 1.92 1.80 1.91 2.30 1.00 Stocks 5.09 4.00 3.96 4.08 2.95 2.38 Managed Investments 9.02 8.38 8.19 9.61 8.86 6.28 Life-Insurances 3.11 3.83 3.90 2.88 2.33 1.77 Pension funds 2.38 2.30 1.71 1.52 1.22 0.77 Foreign Activities 0.56 0.31 0.31 0.30 0.18 0.11 100.00 100.00 100.00 100.00 100.00 100.00
Table 9.11 Average portfolio by age-class, 2002
<30 30-39 40-49 50-59 60-69 >70 Cash 26.77 18.86 16.87 19.14 21.54 33.17 Deposits 57.45 58.13 56.73 52.99 55.61 51.54 Government bonds 3.43 3.97 4.42 7.09 7.48 6.76 Corporate bonds 1.65 1.64 2.04 2.81 2.24 1.76 Stocks 1.15 4.09 4.19 3.59 3.61 1.29 Managed Investments 4.49 6.72 9.03 10.26 7.92 4.48 Life-Insurances 4.32 4.37 4.59 2.66 0.97 0.71 Pension funds 0.74 1.83 1.61 1.28 0.30 0.17 Foreign Activities 0.00 0.39 0.52 0.18 0.33 0.12 100.00 100.00 100.00 100.00 100.00 100.00
Table 9.12 Average portfolio by age-class, 2004.
<30 30-39 40-49 50-59 60-69 >70 Cash 22.37 15.91 19.36 16.29 22.22 29.00 Deposits 66.41 63.96 58.85 57.96 54.40 56.07 Government bonds 2.27 3.80 4.87 7.39 6.11 7.42 Corporate bonds 1.04 1.80 1.88 2.34 3.09 1.80 Stocks 0.27 1.97 3.43 3.16 3.58 1.62 Managed Investments 4.32 7.12 7.28 8.68 8.83 3.63 Life-Insurances 1.25 3.64 2.42 2.16 1.08 0.27 Pension funds 2.07 1.60 1.62 1.28 0.51 0.11 Foreign Activities 0.00 0.20 0.28 0.73 0.17 0.08 100.00 100.00 100.00 100.00 100.00 100.00 brunetti.indd 202 brunetti.indd 202 01.03.2007 17:09:3301.03.2007 17:09:33
With no exception, the average shares invested in each asset category vary across the age-classes according with the risk-attitude changes suggested by the life-cycle theory. More specifi cally, the shares invested in the safest assets (i.e. cash and deposits) are particularly high for both very young and very old households: the former having not yet accumulated wealth enough to afford a more diversifi ed portfolio, the latter preferring less risky and more liquid assets to fi nance their retirement consumption. In addition, as households grow older the weights of government bonds tend to increase constantly, proving that older generally prefer fairly safe rather than risky assets.
Conversely, the path followed by corporate bonds across the age-classes is humped-shaped: their shares are smaller in both young- and older-household portfolios and higher in those of middle-aged. The age-effect is even more evident when even riskier fi nancial activities are considered, namely stocks and foreign assets. The latter in fact appear in the fi nancial portfolios of mid-dle-aged household only. Similarly, the shares invested in stocks are almost negligible in younger-household portfolios, peak instead in those of late-mid-dle-age households, and shrink once again when the households reach the retirement age. The sole exception occurs in 2000, when the highest share invested in stocks does not belong to middle-aged rather to households aged 30 or less. The exceptional boom experienced by the Italian stock market in those years may have fostered the investments in these kinds of assets both at a general level and specifi cally for very young households.
Especially in the last years, managed investments seem to be the invest-ment preferred by any age-class. They in fact provide a good compromise for the younger households and their typical trade-off between a higher risk-tolerance and a lower level of available wealth. On the other hand, the high diversifi cation that they offer makes them quite appealing also to middle-aged households. Overall their shares gradually decrease only with the retirement age and in three out of fi ve waves (i.e. 1990, 2000 and 2004) their average shares reduce substantially only in the very last age-class.
Life insurances and pension funds are particular forms of managed invest-ments. Their specifi c precautionary motive however affects substantially their distribution across the different age-classes: their weights are in fact larger for young and middle-aged households and lower for older ones, who receive from rather than pay out contributions to these instruments. Besides, the pre-dominance of life insurances on pension funds is generally maintained: with the sole exception of households aged 30 or less in 2004 life insurance shares can be from 2 to 5 times those of pension funds, although the gap between the two forms of precautionary savings has signifi cantly reduced in the last years.
In sum, the data provide evidence in favour of the life-cycle theory over the whole past decade. Risky assets are in fact preferred by middle-aged
brunetti.indd 203
investors while older households tend to disinvest risky fi nancial instruments, abandon specifi cally focussed managed investments, such as life insurances and pension funds, and turn to less risky assets, such as government bonds and liquidity. Thus, despite the numerous changes occurred in the last decade (e.g. the reduced profi tability of both government bonds and deposits or the big fl uctuations of the Italian stock market), the fi nancial choices of Italian households seem to have kept consistent with the life-cycle theory, thereby proving the very important effect of age on the household fi nancial choices.
Our results are not directly comparable with Guiso and Jappelli (2001). In fact, when analysing the age-effect on portfolio the authors pool 1989-95 data and focus on risky assets sorted according to their classifi cation. Neverthe-less, the conclusion drawn is fully consistent with what observed by Guiso and Jappelli (2001), who report that “Over the life cycle the unconditional share of risky assets has a hump-shaped profi le”.
Combining this conclusion with the facts on Italian population ageing presented in the previous section, for the next decades one may expect a pro-gressive but substantial shift from risky assets towards safer ones.
9.3.3.3 The average portfolio by age and Net Wealth
The last step of our study aims to take into account one of the aspects that, besides age, most signifi cantly affect the fi nal household portfolio: its overall economic situation, here measured by means of the Net Wealth (NW).
Tables 9.13 and 9.14 report the average household portfolios by net wealth quartile and age-classes for 1995 and 2004 wave respectively14.
As expected, NW plays a focal role in household portfolio choices. The average fi nancial portfolio of households below the fi rst NW quartile has quite low degrees of diversifi cation and riskyness. In 1995, at all age-classes more than 80% of fi nancial wealth was held in pure liquidity, i.e. cash and deposits. The remaining 20% was invested mainly in government bonds and, to a lesser extent, in managed investments and precautionary savings, i.e. life insurance and pension funds. The same holds for 2004, whereby the only difference is that managed investments (around 3-4% depending on the age-class) tend to prevail on government bonds (2-3%). Riskier activities such as corporate bonds, stocks and foreign activities generally remain outside these portfolios. Most likely, the fi nancial choices of households in the fi rst NW quartile are mainly shaped by the fi nancial constraints they face, which force them towards very safe and liquid fi nancial activities.
Turning households falling within the two central quartiles, both the aver-age degree of diversifi cation and riskyness progressively increase. In both
14 The intermediate waves have also been examined and generally lead o very similar conclusions. Miss-ing tables are available upon request.
brunetti.indd 204
waves reported the aggregate share of cash and deposits reduces of around 10 percentage points. Conversely, both government and corporate bonds become more relevant: note however that while in 1995 government bonds were also the 18-20% of the total fi nancial wealth, in 2004 they merely reach 6-8%.
The incidence of managed investments also increases in the intermedi-ate household portfolios, reaching for younger households peaks of 8% in 1995 and of 11% in 2004. Besides, the weight of the precautionary savings increases too: in both waves in fact, the aggregate share of life insurances and pension funds increases by a couple of percentage points with respect to the fi rst quartile. Nevertheless, two important differences arise comparing data for 1995 and those for 2004: fi rst, the gap between the average shares of life-insurances and pension funds has generally reduced; second, the aggre-gate share of these two forms of complementary social security has overall reduced (from around 6-7% in 1995 to no more than 3-4% in 2004).
The highest degrees of diversifi cation and riskyness are displayed by the portfolios of households above the third quartile. Financial resources are in this case drained from totally safe activities, i.e. cash and deposits, and directed instead towards riskier activities, such as stocks, whose shares for the fi rst time go beyond the 2%. Yet, managed investments are those that generally increase the most moving upward across NW, reaching for richer households also 10-14% of the total fi nancial wealth. Finally, note that the relative weights of life insurances and pension funds turn back to be unbal-anced: across the whole decade in fact richer households seem to prefer life-insurances to pension funds.
Guiso and Jappelli (2001) also examined the wealth-effect on portfolio. However, they sort households into wealth (fi nancial plus non-fi nancial activ-ities) rather than NW quartiles. Accordingly, they include into the portfolio also non-fi nancial assets. On the other hand, they focus only on the effect of wealth, while in this step of our analysis portfolios are examined distinguish-ing by both NW quartile and age-class. Hence, a straight comparison is not really feasible. Yet, the evidence found is qualitatively consistent: fi nancial allocation is affected by the level of wealth and, in particular, the wealthier the household, the riskier and more diversifi ed the portfolio.
The “horizontal” reading of the data highlights how, despite the observed discrepancies due to different economic conditions, age can still have a rel-evant effect on the allocation of household fi nancial wealth (see Figures 9.12 and 9.13).
brunetti.indd 205
Table 9.13 Average portfolio by Net Wealth quartile and age-class, 1995. Data Source: HA-SHIW.
Quartile Assets <30 30-39 40-49 50-59 60-69 >70 Below 1st Cash 28,19 35,84 35,26 41,60 47,23 47,37 Deposits 61,21 50,43 49,53 48,04 41,24 46,89 Government bonds 5,29 5,02 5,73 3,94 8,01 5,03 Corporate bonds 0,00 0,29 0,00 0,17 0,00 0,00 Stocks 0,00 0,07 0,20 0,85 0,37 0,00 Managed Investments 1,96 1,53 2,00 2,21 0,72 0,61 Life-Insurances 2,68 5,59 4,90 2,55 1,79 0,10 Pension funds 0,67 1,23 2,38 0,63 0,64 0,00 Foreign Activities 0,00 0,00 0,00 0,00 0,00 0,00 Between 1st and 2nd Cash 18,86 14,81 19,67 24,77 32,38 36,51 Deposits 44,02 54,31 52,62 52,79 50,07 45,32 Government bonds 18,51 17,82 16,86 14,72 13,65 15,35 Corporate bonds 3,58 0,60 0,15 1,36 1,27 0,78 Stocks 0,36 1,13 0,13 0,14 0,16 0,69 Managed Investments 8,55 4,82 2,50 1,66 1,07 1,19 Life-Insurances 2,80 5,11 6,77 4,10 1,33 0,15 Pension funds 3,32 1,31 1,31 0,47 0,07 0,02 Foreign Activities 0,00 0,08 0,00 0,00 0,00 0,00 Between 2nd and 3rd Cash 10,17 10,14 11,55 12,25 14,27 18,42 Deposits 67,80 55,81 52,75 57,45 56,51 59,19 Government bonds 9,99 19,74 20,67 19,57 24,07 18,92 Corporate bonds 0,13 0,84 1,12 0,65 0,47 0,18 Stocks 0,67 1,07 1,06 1,88 0,30 0,70 Managed Investments 4,81 5,93 6,21 3,16 2,70 1,38 Life-Insurances 4,53 4,62 5,05 3,47 1,02 0,59 Pension funds 1,89 1,85 1,54 1,40 0,65 0,41 Foreign Activities 0,00 0,00 0,06 0,17 0,01 0,22 Above 3rd Cash 2,85 6,35 5,01 5,48 7,63 7,13 Deposits 57,77 49,33 47,84 50,12 43,54 49,56 Government bonds 20,45 21,97 27,38 27,92 35,65 34,97 Corporate bonds 0,00 1,06 1,05 1,13 1,65 1,36 Stocks 1,03 2,15 1,79 2,82 1,45 1,38 Managed Investments 10,42 12,61 9,75 7,76 7,48 3,73 Life-Insurances 5,27 4,11 4,82 3,55 1,98 1,61 Pension funds 2,20 2,29 1,81 1,07 0,41 0,17 Foreign Activities 0,00 0,13 0,55 0,15 0,21 0,09 brunetti.indd 206 brunetti.indd 206 01.03.2007 17:09:3401.03.2007 17:09:34
Table 9.14 Average portfolio by Net Wealth quartile and age-class, 2004. Data Source: HA-SHIW.
Quartile Assets <30 30-39 40-49 50-59 60-69 >70 Below 1st Cash 29.32 25.82 35.48 35.06 45.34 38.65 Deposits 59.40 61.40 55.52 55.31 47.49 56.18 Government bonds 3.07 1.82 1.76 2.80 1.99 3.07 Corporate bonds 0.00 1.18 0.29 0.03 1.16 0.14 Stocks 0.00 1.39 0.64 0.24 0.54 1.17 Managed Investments 3.94 4.32 4.09 3.29 2.38 0.70 Life-Insurances 0.87 3.05 1.43 2.34 0.76 0.04 Pension funds 3.39 0.99 0.80 0.84 0.34 0.06 Foreign Activities 0.00 0.03 0.00 0.09 0.00 0.00 Between 1st and 2nd Cash 16.60 9.75 18.17 20.74 26.71 35.30 Deposits 73.26 75.42 63.64 61.85 55.68 54.10 Government bonds 0.63 2.89 3.81 7.45 4.89 7.10 Corporate bonds 2.40 1.20 1.80 0.67 2.83 0.60 Stocks 0.12 1.24 1.26 0.50 1.29 0.97 Managed Investments 4.23 5.22 6.02 5.52 7.08 1.76 Life-Insurances 1.84 2.07 3.30 1.51 1.13 0.09 Pension funds 0.92 2.18 1.60 1.50 0.18 0.04 Foreign Activities 0.00 0.02 0.40 0.25 0.22 0.04 Between 2nd and 3rd Cash 21.89 9.48 15.77 12.70 15.82 24.38 Deposits 72.17 63.48 61.50 64.89 60.45 59.04 Government bonds 0.26 6.92 7.06 6.78 6.93 8.30 Corporate bonds 0.52 1.54 1.96 2.43 2.73 2.11 Stocks 1.28 1.50 2.75 2.52 4.18 0.71 Managed Investments 2.97 11.03 6.05 6.86 7.64 4.71 Life-Insurances 0.09 3.53 2.34 2.24 1.15 0.44 Pension funds 0.82 1.95 2.17 1.48 0.94 0.23 Foreign Activities 0.00 0.58 0.39 0.10 0.17 0.09 Above 3rd Cash 13.17 13.27 7.80 6.80 10.13 12.12 Deposits 72.50 54.41 56.12 53.82 56.00 58.83 Government bonds 1.94 4.80 6.37 11.13 9.10 11.78 Corporate bonds 0.09 4.59 2.98 4.24 4.44 4.90 Stocks 0.00 3.50 8.75 4.89 5.60 3.44 Managed Investments 7.98 10.63 12.70 14.36 12.91 7.75 Life-Insurances 3.08 6.60 2.97 2.42 1.00 0.83 Pension funds 1.23 1.76 1.87 1.16 0.63 0.09 Foreign Activities 0.00 0.45 0.44 1.19 0.19 0.27 brunetti.indd 207 brunetti.indd 207 01.03.2007 17:09:3501.03.2007 17:09:35
Figure 9.12 Asset shares grouped by riskyness, by NW quartiles and
age-class, 1995
Below 1st quartile
Between 1st and 2nd quartile
Between 2nd and 3rd quartile
Above 3rd quartile
Source: own elaborations on HA-SHIW.
brunetti.indd 208
Figure 9.13 Asset shares grouped by riskyness, by NW quartiles and
age-class, 2004
Below 1st quartile
Between 1st and 2nd quartile
Between 2nd and 3rd quartile
Above 3rd quartile
Source: own elaborations on HA-SHIW.
brunetti.indd 209
In both waves and regardless of the NW quartile, the aggregate share of the cash and deposits (safe assets) undergoes a decline during the middle-age, when resources are generally drained from safer assets to fi nance riskier and more rewarded investments. As from the retirement age-class (60-69) however the weights of safe assets progressively increase. Consistently, the aggregate shares of riskier activities, such as corporate bonds, managed investments, stocks and foreign activities display a humped-shaped pattern. On the other hand, the average shares held in government bonds gradually increases along with the age-class, substantiating the stronger preference of these assets by older rather than younger households.
A separate situation arises instead for the top 5% richer households (see Table 9.15 and Figure 9.14). Their average portfolio does not refl ect the pre-dictions of life-cycle theory. As the household grows older cash, deposits and government bonds reduce rather than increase. Furthermore, corporate bond share behaves irregularly: in 1995 they literarily boost in the portfolios of households aged 70 or more, and in 2004 they fi rst drop between the fi rst and second age-class and then progressively increase along with age. In addition, the shares of managed investments and stocks remain quite high during the whole life-cycle and do not signifi cantly shrink with the retirement age.
Figure 9.14 Top 5% households: asset shares grouped by riskyness
across age-classes.
1995
2004
Source: own elaborations on HA-SHIW.
brunetti.indd 210
Table 9.15 Top 5% richer households: average portfolio of by age-class in 1995 and 2004. 1995 <30 30-39 40-49 50-59 60-69 >70 Cash 1.11 3.87 5.64 3.68 1.80 2.34 Deposits 51.76 50.21 37.13 41.23 29.72 39.85 Government bonds 24.75 20.67 21.66 27.55 40.48 31.41 Corporate bonds 0.00 0.34 7.61 2.18 1.90 7.44 Stocks 0.00 3.65 6.90 7.45 8.18 5.32 Managed Investments 11.92 14.03 11.23 12.12 14.51 12.33 Life-Insurances 10.45 6.83 7.66 3.77 2.81 0.38 Pension funds 0.00 0.40 1.90 1.10 0.35 0.03 Foreign Activities 0.00 0.00 0.28 0.93 0.25 0.90 2004 <30 30-39 40-49 50-59 60-69 >70 Cash 3.00 1.93 3.67 3.55 6.84 2.45 Deposits 49.79 54.21 53.07 44.55 41.49 43.72 Government bonds 23.89 8.74 8.42 6.61 8.72 17.39 Corporate bonds 17.18 1.82 5.82 5.99 6.06 9.62 Stocks 1.38 11.19 10.04 14.45 11.19 9.05 Managed Investments 1.87 11.42 14.53 16.75 23.31 16.93 Life-Insurances 0.20 9.67 2.09 2.49 1.87 0.10 Pension funds 2.68 1.02 2.25 1.42 0.16 0.51 Foreign Activities 0.00 0.00 0.10 4.19 0.36 0.22
Data Source: HA-SHIW
Most likely, for these households the net-wealth effect more than over-comes that of age on fi nancial assets allocation. As highlighted by Table 9.16 in fact the NW of these households is extremely high: falling within the top 5% in 1995 (2004) meant have a NW of almost ITL 950m (EUR 700,000).
Table 9.16 Net wealth quartiles boundaries, by SHIW wave.
Quartile 1995 1998 2000 2002 2004 I 29.871.950 41700 50.500 23.000 30.500 II 157.993.890 181.232.370 197.204.440 108.500 138.026,37 III 335.224.250 353.075.000 380.000 215.814,76 262.813,22 Top 5% 936.125.840 1.005.278.240 1.100.100 589.965,62 689.105,05
Note: values up to 2000 are expressed in Italian lira while those for 2002 and 2004 are in Euro. Data Source: HA-SHIW.
brunetti.indd 211
In sum, with the sole exception of top 5% richer households, for which most likely fi nancial choices are mainly shaped by net-wealth rather than age, the average composition of Italian household portfolios seems to be signifi cantly infl uenced by age. Furthermore, the evidence suggests a double robustness of this result. On one hand, age-effect on fi nancial asset allocation is maintained even under signifi cantly different economic conditions, as it is observed across all the Net Wealth quartiles examined. On the other, it has endured through time despite the numerous changes occurred on the Italian fi nancial market during the last decade, since the infl uence of age on the aver-age portfolio is revealed by all the waves considered.
9.4 Conclusions
This paper focuses on the dynamics of population ageing in Italy and on its impact on the household portfolio allocation, with the fi nal aim to provide indications about the evolutions that the Italian fi nancial markets may face in the years to come. The analysis has been carried out in two steps.
First, we examined the phenomenon of ageing in Italy and its main causes. It turned out that Italian population is undergoing the most pronounced age-ing in the world after Japan (projections for 2050 point towards the amazage-ing picture of 75 retired every 100 working people) and that it probably stems from a drop in fertility.
Based on this, we turned to the effects that ageing might have on the average portfolio of Italian households. As in Guiso and Jappelli (2001) data are taken from fi ve waves of the Bank of Italy SHIW. As highlighted in the paper, this study differs from Guiso and Jappelli (2001) in three extents: (i) a subsequent period of time is considered; (ii) a different risk-classifi cation of fi nancial assets is proposed; and (iii) the analysis is refi ned by separating households into age-classes and Net Wealth quartiles at a time, thereby test-ing the robustness of age-effect on fi nancial choices under different economic conditions. Going throughout the average portfolio allocation it emerged that several changes occurred over the period 1995-2004: government bond share reduced while corporate bonds have generally increased, especially since 1998. Most likely, the reduction of Italian government bonds yields on one hand and the privatization process on the other might be at the basis of these portfolio adjustments. Besides, while the incidences of stocks and managed investments have in large part oscillated according to the major market fl uc-tuations of the last decade, life-insurances and pension funds have recorded constant but opposite trends: the former have shrunk in favour of the latter, thereby reducing (but not annulling) the gap between the two forms of com-plementary social security.
Examining the average portfolio by age-classes it turned out that the
brunetti.indd 212
average shares invested in each asset category tend to be consistent with the risk-attitude changes suggested by the life-cycle theory. Middle-aged house-holds hold riskier portfolios, while older ones tend to disinvest risky fi nancial instruments and turn to safer assets, such as government bonds and liquid-ity. Thus, the fi nancial choices of Italian households remained signifi cantly affected by age despite the numerous changes occurred between 1995 and 2004. Although the results obtained here are not directly comparable with that reported by Guiso and Jappelli (2001), a comparison with their results is in order. On the whole, the evidence found is qualitatively consistent, although a few differences in the average allocations emerge. Generally, in fact, Guiso and Jappelli (2001) report shares for cash remarkably lower than ours (up to 10 percentage points); on the contrary, they generally report as higher life-insurances shares.
Finally, the average portfolio is further examined dividing the Italian households by both age-classes and NW quartiles, in order to take into account also the infl uence that the overall economic condition of the house-hold has on its fi nancial choices, which was already observed by Guiso and Jappelli (2001). With the sole exception of extremely rich households (i.e. top 5% richer ones), the age-effect seems to persist even under signifi cantly dif-ferent economic conditions. We thus conclude that the age-effect on fi nancial choices seems to be robust to both different economic situations and to the market changes occurred during the decade under analysis.
Combining this conclusion with the facts on Italian population ageing, we expect for the next decades several changes on the Italian fi nancial market. In particular, it is likely a progressive but substantial shift from risky assets, such as stocks and corporate bonds, towards safer ones, i.e. managed investments, government bonds and deposits.
Unfortunately, a more precise forecast on what is going to happen can not be obtained from this kind of analyses. Probably, an “econometric” approach, such as that taken by Poterba (2004) or Davis and Li (2003) would be more appropriate to complete our analysis. In fact, it could help to assess quantita-tively the relationship between demographic and household portfolios changes and thus to estimate how the projected demographic structures might modify future fi nancial asset returns. This issue is thus left to further research.
Acknowledgements
The authors would like to thank for helpful comments and suggestions Massimo Baldini, Giuseppe Marotta and participants of the 26th SUERF Col-loquium. Authors acknowledge fi nancial support from MIUR.
brunetti.indd 213
References
Ameriks J., and S. Zeldes, (2004), “How Do Household Portfolio Shares Vary with Age?”, Columbia Business School Working Paper, available at http://www2.gsb.columbia.edu/faculty/szeldes/Research/
Basel Committee on Banking Supervision (2004), “International Convergence of Capital Measurement and Capital Standards: A Revised Framework”, available at http://www.bis.org/publ/bcbs128.pdf
Bloom D.E., and D. Canning, (2004), “Global Demographic Change: Dimensions and Economic Significance”, NBER Working Paper 10817. Börsch-Supan, A., (2004), “Global Aging: Issues, Answers, More Questions”,
University of Michigan, Retirement Research Center, Working Paper 84. Bosworth, B. P., R.C. Bryant and G. Burtless (2004), “The Impact of Aging on
Financial Markets and the Economy: A Survey”, The Brookings Institution Economic Studies
Brooks, R., (2000), “What Will Happen to Financial Markets When the Baby Boomers Retire?”, IMF Working Paper 00/18.
Brooks, R., (2002), “Asset-Market Effects of the Baby Boom and Social-Security Reform”, American Economic Review, 92, 402-406.
Brugiavini, A., and Galasso V. (2003), “The Social Security Reform Process in Italy: Where do We Stand?”, Working Papers N° 52, Michigan Retirement Research Centre, University of Michigan.
Cutler D., J. Poterba, L. Sheiner and L. Summers, (1990), “An Aging Society, Opportunity Or Challenge?”, Brookings Papers on Economic Activity, 1, 1-56.
Davis E. P., and C. Li, (2003), “Demographics and Financial Asset Prices in the Major Industrial Economies”, Brunel University-West London Working Paper, available at http://www.zen13767.zen.co.uk/demog-assetp8.pdf Fornero, E., and E. Luciano, (2004), Developing an Annuity Market in Europe,
Edward Elgar, Cheltenham, UK Northampton.
Geanakoplos, J., M. Magill and M. Quinzii (2004), “Demography and the Long-run Predictability of the Stock Market”, Brookings Papers on Economic Activities, 1, 241–325
Goldstein, A., (2003), “Privatization in Italy 1993-2002: Goals, Institutions, Outcomes, and Outstanding Issues”, CESifo Working Paper N° 912. Gonand, F., (2005), “The Aggregate and Structural Impact of Ageing on
Financial Markets: Some Quantitative Assessments”, Financial Market Trends, 89, 127-151.
Goyal, A., (2004), “Demographics, Stock Market Flows, and Stock Returns”, Journal of Financial and Quantitative Analysis, 39, 115-142.
Guiso, L., and T. Jappelli, (2001), “The Portfolio of Italian Households”, in Household Portfolios, Luigi Guiso, Michalis Haliassos and Tullio Jappelli
brunetti.indd 214
(eds), MIT Press Cambridge, 2001.
Kucera, T., O. Kucerova, O. Opara and E. Schaich, (2000), “New Demographic Faces of Europe: The Changing Population Dynamics in Countries of Central and Eastern Europe”, Springer, Heidelberg.
Martire F., and D. Zincato, (2005), “Le famiglie straniere: analisi dei dati censuari del 2001 sui cittadini stranieri residenti”, Contributi Istat, 19, available at http://www.istat.it/dati/pubbsci/contributi/Contr_anno2005. htm#top
Miles, D., (1999), “Modelling the Impact of Demographic Change upon the Economy”, Economic Journal, 109, 1–36.
Oliveira Martins J., F. Gonand, P. Antolin, C. De la Maisonneuve and K.Y. Yoo, (2005), “The Impact of Ageing on Demand, Factor Markets and Growth”, OECD Economics Department Working Paper 420.
Poterba, J. M., (2001). “Demographic Structure and Asset Returns”, Review of Economics and Statistics, 83, 565-584.
Poterba, J. M., (2004), “The Impact of Population Aging on Financial Markets”, NBER Working Paper 10851.
Visco, I., (2002), “Ageing Populations: Economic Issues and Policy Challenges”, in Economic Policy for Aging Societies, Siebert, H. (eds.), Springer, Berlin.
Visco, I., (2005), “Ageing and pension system reform: implications for financial markets and economic policies”, G10 available at http://www. imf.org/external/np/g10/2005/pdf/092005.pdf
Yoo, P. S., (1994), “Age Distributions and Returns of Financial Assets”, Federal Reserve Bank of St. Louis Working Paper 2.
Appendix 9.1 Clearly safe, fairly safe and risky fi nancial assets.
In analysing the composition of Italian household portfolio over the period 1985-1998, Guiso and Jappelli (2001) fi nd it useful to group fi nancial assets according to their risk-profi le. In particular, they distinguish: (i) “clearly safe” fi nancial assets, including currency, transaction accounts and certifi cates of deposit; (ii) “fairly safe” fi nancial assets, gathering Treasury bills and the life insurances; and (iii) “risky” assets, including stocks, long-term government bonds, corporate bonds, defi ned contribution pension plans, mutual funds and other forms of managed investments.
Here, a different sorting is proposed. In Table 9.A.1 we recall the six major categories attained by joining together assets sharing similar credit and mar-ket risks (see Section 9.3.2) and shade the cells to indicate the three different risk-profi les: light grey denotes “totally safe” assets, more intense grey “fairly safe” assets and dark grey “risky” assets.
brunetti.indd 215