ISSN: 2223-3806 / E-ISSN: 1927-5951/14 © 2014 Lifescience Global
Anthropometric Characteristics and other Dietary Aspects of a
Group of Spanish Women Looking for Weight Loss and Enrolled in
a Weight Management Program
Magdalena Rafecas
1, Laura-Isabel Arranz
1,*, Mireia García
2, Miguel-Ángel Canela
3and
DIECA group
#1Department of Nutrition and Food Sciences, Faculty of Pharmacy, University of Barcelona, Spain
2Dietitian Nutritionist of DIECA Group (DIECA is the Acronym in Spanish of Diet, Exercise, Food
Supplements), Spain
3Department of Managerial Decision Sciences, IESE Business School, Barcelona, Spain
Abstract: Overweight is a health problem characterised as a higher than normal body weight due to an abnormal increase in body fat. Body weight adequacy is categorised using body mass index (BMI), however other parameters as fat mass (FM), waist circumference or waist to hip ratio, are relevant. Ideally, body composition should be calculated initially to evaluate changes during a dietary intervention for weight loss. Hunger experience is another parameter to take into account in order to succeed. The aim was to investigate and describe the characteristics of women seeking weight loss solutions. We organised an open program for people with body excess who wanted to lose weight. 252 women participated and answered to a dietary interview. Anthropometric measures of weight, height, body mass index, body fat, waist and hip circumference were taken. The mean age was of 36.84±7.29 years, and most of them, about 90%, have followed dietary programs for weight loss throughout their lives. They all wanted to lose weight in a range of 3 to 20 kilograms with a mean value of 11.49±6.01 kilograms. 123 women had a hunger profile of satiating behaviour and 129 a snacking one. The mean BMI was within overweight values, and mean fat mass was within obesity values. Waist and hip circumference were higher than normal in most of the participants and excess body weight perception and attitude were different. There is a need to tackle overweight and obesity individually, taking into account personal consciousness and expectancy, anthropometric measures and hunger experience.
Keywords: Overweight, body mass index, fat mass, waist, hip, hunger, satiety. INTRODUCTION
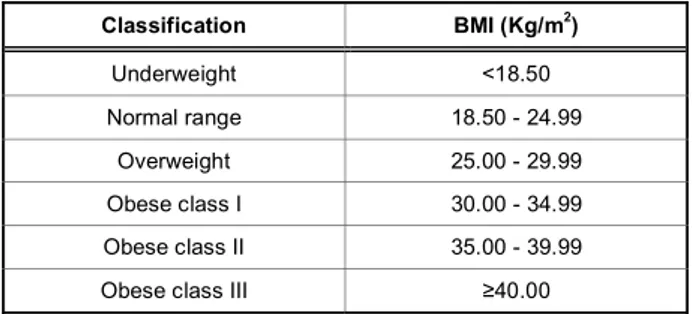
Overweight and obesity are increasing health problems worldwide, related to an increased risk of diseases like type 2 diabetes, dyslipemia, hypertension, coronary heart disease, some type of cancers, osteoarthritis, and others [1]. In Spain, the prevalence of obesity in adults is around 17% and obesity plus overweight is around 54% [2, 3]. Both are characterised as a higher than normal body weight due to an abnormal increase in body fat storage. Body weight adequacy is categorised using body mass index (BMI), however other parameters as fat mass (FM), waist circumference or waist to hip ratio, are relevant and useful. BMI is calculated as the body weight (kg) divided by the height square (m2) and the established categories are shown on Table 1. Waist circumference is the distance around the abdomen and this measure
*Address correspondence to this author at the Department of Nutrition and Food Science (University of Barcelona), Faculty of Pharmacy, Avda. Joan XXIII, s/n., Barcelona 08028, Spain; Tel: 934 024 527, 934 024 508; Fax: 934 035 931; E-mail: [email protected]
#DIECA Group of dietitians: Sarola J, Díaz MS, Pérez E, Martínez L,
Maximiano C, Esteba E, Roura C, Viñolas I, Romero I, Caseiro J, Cerón T, Vilanova P, Sales Ll, Gutiérrez A, del Río MC, González A, Nolasco V, Hernández AB, Cuberos C, Aguilar MP, Almagro L, Gandía M, Sanz Y, López P, Uriol T, López M, Sánchez C, Esquer P, de la Fuente V, Viñas G, López V and Domínguez N.
Table 1: International Classification of adult underweight, overweight and obesity according to BMI. Source: Adapted from WHO, 1995, WHO, 2000 and WHO 2004
Classification BMI (Kg/m2) Underweight <18.50 Normal range 18.50 - 24.99 Overweight 25.00 - 29.99 Obese class I 30.00 - 34.99 Obese class II 35.00 - 39.99
Obese class III 40.00
is used to assess the degree of abdominal obesity and also cardiovascular risk. Hip circumference (Hci) is recorded on the widest part of the hips. It is considered that for a good health, waist should measure no more than 80cm in women and 94cm in men, and abdominal obesity exists when waist circumference is more than 88cm in women and 102cm in men [4], or when the waist to hip ratio is above 0.85 in women and 0.9 in men [5]. Ideally, body weight and body composition, with all these anthropometric parameters, should be calculated initially in order to evaluate changes during a dietary weight loss intervention [6].
Another issue to take into account is the fact that changing behaviours and habits related to health are not easy. It is hard to quit smoking, to start in physical activity, and specially to change eating patterns. All are difficult challenges for anyone in spite of having a health benefit as a result [7]. It is also considered that people without basic nutrition knowledge would have worst criteria to choose what they eat. However, nutrition knowledge is not the unique factor to achieve changes in consumers’ food behaviours [8]. Moreover, epidemiologic studies have begun to show links between adiposity and behaviours such as television watching, alcohol intake, stress, and sleep deprivation because they are likely to contribute to overweight and obesity by encouraging excessive eating [9, 10]. Regarding exercise, there are physiological, psychological and behavioural factors potentially involved in its relationship with appetite. People who exercise, frequently compensate for the increase in energy expenditure via compensatory increases in hunger and food intake. However, this is not always likely to happen, and responses to exercise will vary. Understanding and characterising this variability will help weight loss strategies to suit individual needs [11]. Consequently, consciousness, knowledge, attitude and lifestyle must be addressed by health professionals when giving advice.
Obviously, what we eat is tremendously important to weight control. Hypocaloric diets are one of the main weight loss tools which, along with exercise, facilitate the achievement of a negative energetic balance (to eat fewer calories than wasted). However, there is a factor that determines whether a hypocaloric diet would be successful or not, it is hunger experience. Satiation is the process that causes one to stop eating and satiety is the feeling of fullness that persists after eating, suppressing further consumption. Both are important in determining total energy intake. Therefore, to achieve and maintain a good satiety level is essential and a relevant issue to take into account in order to help people to follow their diets [12, 13]. Although there is a lot of individual variability, generally, it is feasible to distinguish two hunger profiles. On the one hand people who eat big amounts of food in each main meal (satiating behaviour), and on the other hand people who eat many times during the day (snacking behaviour). Both behaviours, although are different, lead to an extra food intake during the day, and therefore to eat more calories than needed.
Some dietary products are formulated specifically to improve satiety sensation and would be of help in
hunger management. These products are marketed as food supplements (FS) and among their ingredients some of the most popular are Konjac mannan (glucomannan), oat fibre, saffron extract and chromium. All of them have demonstrated some actions related to satiety mechanisms. The one with the greater evidence seems to be Konjac mannan which holds studies demonstrating its efficacy for weight loss when used along with hypocaloric diets [14, 15, 16, 17]. Oat fibre has a similar action than glucomannan and other soluble fibres as fructo-oligosaccharides [18], increasing satiety after meals by slowing down carbohydrate absorption. However, some of the benefits of oat fibre are due to beta-glucans [19, 20, 21]. Chromium is widely used in food supplements addressed to weight control. It has the function to contribute to insuline action, maintaining plasma glucose levels [22], and therefore presumably with a beneficial effect improving satiety [23, 24, 25, 26]. There is a newer ingredient within the field of weight and satiety, saffron, specifically, the Crocus sativus L. extract, which has shown to reduce snacking behaviour and increase satiety [27]. Crocus sativus L. has also effects on anxiety and depression which seemingly would be related to snacking behaviour [28, 29, 30, 31]. Food supplements based on these ingredients could be of help for people who want to lose weight and to manage hunger in order to follow hypocaloric diets much better. Moreover, people seek these products looking for an easier solution to their weight problems, not always completely conscious that they could be of help although a change in dietary habits and life-style is also needed.
All these data show that weight loss is a difficult challenge due to the big variability among people and all affecting factors. All of them must be taken into account in an individualised way for a successful weight management outcome. The aim of this paper is to describe age, initial weight, body mass index, fat mass, waist and hip circumference, hunger experience and the attitude of a group of women seeking for weight loss solutions and following a weight loss program.
METHODS
To recruit participants and get the information required, we organized an open and free weight loss program for people with excess body weight who wanted to slim some kilograms. The inclusion criteria established for the study were: healthy women between 20 and 45 years old, with overweight (based
on self-perception). Were excluded from the participation men and people with chronic diseases or who were under chronic medical treatments. A first call, offering free participation and explaining conditions to be on, was made by Internet, and second call was made to people attending some dietitian offices located in different areas of Spain. The call lasted for some days, and once expired, more than 2000 women had answered to our announcement, 300 of them were selected, and finally 252 women participated.
We asked the selected participants to answer a questionnaire with questions about their age, their weight and height, their life history with slimming diets, weight they wanted to lose and hunger experience (Figure 1). We also took measures of weight, body mass index, fat mass percentage and waist and hip circumference. Weight, BMI, and FM percentage were taken with an OMRON BF511 body composition analyser. Waist and hip circumference were taken with a common tape. The waist measure was made with person with a normal breath, starting at the top of the hip bone, bringing a tape measure all the way around, and levelling with the belly button and making sure it was not too tight and that it is straight. Similarly, hip was measured at its widest portion of the buttocks. Finally, all participants were enrolled in an 8 weeks weight loss program based on two models. The first one following general recommendations of hypocaloric Mediterranean diet and food supplements (FS group), and the second one guided by dietitians and receiving individualised hypocaloric diet together with the specific food supplement (FS+diet group). As this paper aims to describe initial characteristics of participants, it is important to note that people on the FS group came from the Internet call, and people on the FS+diet group came from the call made by their own dietitians. All dietitians received complete instructions to standardise inclusion criteria and methodology. We calculated the
p-value for differences between anthropometric parameters among FS and FS+diet group.
RESULTS
Our announcement was made during some days. Nearly 2000 women responded to the call launched over the Internet, and almost 40 dietitians agreed to collaborate in the study. From the call via Internet 128 women were selected, and each dietitian included a mean of 5 participants, with a total of 124 included women. Finally, 252 women agreed and attended to our first visit and were enrolled in a weight loss program for 8 weeks. Therefore, results presented below are the description of a total sample of 252 women.
The mean age within the whole group of participants was of 36.84±7.29 years, within FS group was of 36.4±6.45 and within FS+diet group was of 37.5±8.41. The median value for the whole group was 37 years. This means that most of our participants were in perimenopause period referring body changes that also affected weight and body composition. Women at this age seem to be the main group worried about their weight, probably due to physiological changes which difficult weight control more than in young women.
About satiety, 123 women out of 252 showed the hunger experience profile of satiating behaviour, i.e. excessive appetite at main meals, and 129 showed the snacking behaviour between hours type. This proportionality was really similar within each group (see Table 2). Additionally, approximately half of the participants expressed spontaneously a component of anxiety, deriving mainly to eat uncontrollably between meals. The lack of satiety as the main difficulty to control or lose weight was a general complaint
Your answer How old are you?
How much do you currently weigh? How tall are you?
Have you ever followed a slimming diet? How much weight do you want to lose?
About your eating behaviour, which sentence identifies you more? I eat a higher than normal amount of food during the main meals
I eat relatively small amounts but too many times during the day, specially between the main meals Figure 1: Initial questionnaire answered by all participants.
expressed by participants. Most of them received positively the recommendation of a FS to tackle this handicap and were motivated to take it.
Regarding weight they wanted to lose, results were similar in both groups, stood at 11.8±5.68 kg in the FS group and 11.16±6.35 kg in the FS+diet group. There was a big difference among all participants, while some of them just wanted to lose 3 kilograms, others wanted to lose up to 20 kg. Expressed in percentage these figures varied from 5% to 35% of their body weight. Actually, this wide range could be due to the different level of awareness and self-perception of body weight. People usually wanted to achieve the weight in which they feel attractive, their ideal weight, and not specially to be within the BMI normal range.
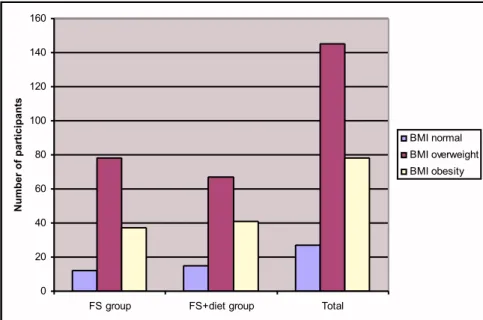
The mean value of initial BMI in this sample was 28.6, corresponding to a grade II overweight range.
However, 27 were in normal BMI values, 145 within overweight BMI range (only 2 of them within overweight grade I range), and 78 showed BMI values within obesity range (see Figure 2). This data is interesting because showed the fact that perception of excess body weight was very different among participating women. Seemingly awareness could appear at different stages. In our sample, some women wanted to lose weight, even when they were in normal or healthy values, and others considered that they were just overweight when they were already within obesity values.
The mean value for body fat mass percentage was of 37.92 lying within the category of obesity, according to reference criteria [6]. In fact, most of participants had, at the beginning of the program, a FM percentage higher to the considered as normal or healthy, even
Table 2: Anthropometric values and other characteristics within FS and FS+diet group. Mean age (years), mean wanted to lose weight, participants with a satiating behaviour, participants with a snacking behaviour, body mass index (BMI), percentage of fat mass (%FM), waist circumference (Wci), hip circumference (Hci)
FS (n=128) FS+diet (n=124) p value
Mean age (years) 36.4±6.45 37.5±8.41 -
Mean wanted to lose weight (kg) 11.8±5.68 11.16±6.35 -
Satiating behaviour 61 62 - Snacking behaviour 67 62 - BMI 28.66 28.69 0.957 %FM 36.79 39.05 0.006 Wci 88 92.65 0.001 Hci 109.71 109 0.539 0 20 40 60 80 100 120 140 160
FS group FS+diet group Total
Number of participants BMI normal BMI overweight BMI obesity
those who had normal BMI values. Only 7 participants had an initial FM percentage equal to or below 27, which would be the desirable value for women at this age.
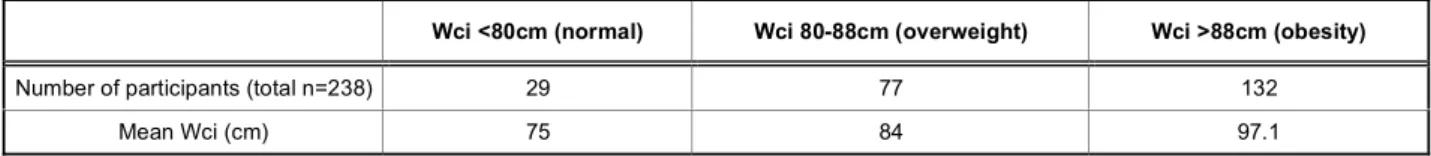
Among all the participants, waist and hip circumference values were generally high, with a mean value of 90.32 and 109.36 respectively. Taken into account that healthy values for waist circumference in women must be at the maximum 80cm and over 88cm it is considered as abdominal obesity, most of our participants were at obesity values. Among them 29 women had a waist circumference lower than 80cm, 77 had values between 80 and 88cm, and 132 were over 88cm. Mean waist circumference value within participants in normal (<80cm), overweight (80-88) and obese (>88cm) ranges were of 75, 84 and 97.09 respectively (see Table 3). Moreover, 32.8% of the participating women had a waist to hip ratio higher 0.85, indicating that almost one third of them had abdominal obesity. These parameters should be measured because a considerable part of people looking for weight loss, could have higher than normal abdominal fat mass and therefore cardiovascular risk.
Anthropometric measures within FS and FS+diet group were in general very similar, for BMI values difference were not statistically significative (p=0.957) and for FM percentage difference was statistically significative (p=0.006). Hip values were almost equal for FS and FS+diet groups, however waist circumference values were also significantly different (p=0.001), probably due to fat mass higher values (see Table 2). These results are coherent, people with higher fat mass has also higher waist circumference which is the main body fat storage. The reason why the FS+diet group has a higher percentage of FM and Wci is not known, however it could be because people attending dietitian offices probably have a greater problem with their weight than those trying to manage it by themselves.
CONCLUSION
People convened to participate in this study had different profile and level of excess of body weight.
Perception of current and ideal weight was very different among this group of women. When looking for slimming, some of them just look to lose 3 kilograms, and others look for up to 20 kilograms. There were higher values for some anthropometric parameters than expected, highlighting frequent situations of overweight and even obesity. Hunger experience was also different among people, with about half of women who felt that their main difficulty was excessive appetite at mealtimes, and half feeling anxiety and snacking too much during the day. The attitude towards recommended food supplements to help their satiety was positive. Most of the women who participated in this program were within the overweight BMI range and had FM percentage values higher than normal. FM corresponded mainly to overweight and even to obesity, even for those women who had normal BMI range. Waist circumference was in general higher than normal. FM and Wci were significantly higher in participants attending dietitian offices, probably due to a greater interest seeking professional guide among people with bigger body weight problem. Waist to hip ratio indicated that around one third of these participants had abdominal obesity and cardiovascular risk.
In summary, anthropometric measures, perception of excess body weight, attitude towards it, hunger experience and motivation to lose weight were different depending on the individuals. This reflects that varied initial situations exist and they could lead to very different outcomes after following a weight loss diet or after using food supplements. Measuring anthropometric parameters of weight, body mass index, fat mass and waist and hip circumference, give more information about health status and facilitate assessment of people improvements. Asking about other personal characteristics also would be of help in order to individualise assessment on diet, food supplements, behaviour and life style. The varied characteristics of people who look for weight loss should be taken into account by health professionals and reinforce the need to tackle overweight and obesity in an individualised manner, with information about dietary background, hunger experience and anthropometric measures.
Table 3: Description of waist circumference (Wci) within participants. Number of participants within normal, overweight and obesity Wci values, and mean Wci in each group
Wci <80cm (normal) Wci 80-88cm (overweight) Wci >88cm (obesity)
Number of participants (total n=238) 29 77 132
ACKNOWLEDGEMENTS
We are grateful to financial support of Zambon S.A.U. which made possible the study and the program with Lipograsil® products. We thank also Ilana Ventura for the final language review.
CONFLICT OF INTERESTS
LIA is associate professor at University of Barcelona but also holds a position at Zambon, S.A.U.
REFERENCES
[1] World Health Organization (WHO) Global Health Observatory. Overweight. http://www.who.int/gho/ncd/risk_ factors/overweight_text/en/. WHO. Geneva. 2014.
[2] Ministerio de Sanidad, Servicios Sociales e Igualdad. ENSE-Encuesta Nacional de Salud de España. Ministerio de Sanidad, Servicios Sociales e Igualdad. Madrid 2012. [3] Ministerio de Sanidad, Servicios Sociales e Igualdad.
ENIDE-Encuesta Nacional de la Ingesta Dietética de la población Española. Ministerio de Sanidad, Política social e Igualdad. Madrid 2011.
[4] Lean ME, Han TS, Morrison CE. Waist circumference as a measure for indicating the need for weight management. BMJ 1995; 311: 158-61.
http://dx.doi.org/10.1136/bmj.311.6998.158
[5] World Health Organization (WHO). Waist circumference and waist–hip ratio: report of a WHO expert consultation, Geneva, 8–11, December 2008.
[6] Rubio MA, Salas-Salvadó J, Barbany M, et al. Consenso SEEDO 2007 para la evaluación del sobrepeso y la obesidad y el establecimiento de criterios de intervención terapéutica. Rev Esp Obes 2007; 7-48.
[7] Zimmerman GL, Olsen CG, Bosworth MF. ‘Stages of change’ approach to helping patients change behavior. Am Fam Physician 2000; 61: 1409-1416.
[8] Worsley A. Nutrition knowledge and food consumption: can nutrition knowledge change food behaviour? Asia Pac J Clin Nutr 2002; 11(Suppl): S579-S585.
http://dx.doi.org/10.1046/j.1440-6047.11.supp3.7.x
[9] Chapman CD, Benedict C, Brooks SJ, Schiöth HB. Lifestyle determinants of the drive to eat: a meta-analysis. Am J Clin Nutr 2012; 96(3): 492-7.
http://dx.doi.org/10.3945/ajcn.112.039750
[10] Maniam J, Morris MJ. The link between stress and feeding behaviour. Neuropharmacology 2012; 63(1): 97-110.
http://dx.doi.org/10.1016/j.neuropharm.2012.04.017
[11] King NA, Horner K, Hills AP, et al. Exercise, appetite and weight management: understanding the compensatory responses in eating behaviour and how they contribute to variability in exercise-induced weight loss. Br J Sports Med 2012; 46(5): 315-22. Epub 2011 May 19.
[12] Benelam B. Satiation, satiety and their effects on eating behaviour. Nutr Bull 2009; 34: 126-173.
http://dx.doi.org/10.1111/j.1467-3010.2009.01753.x
[13] Bellisle F, Drewnowski A, Anderson GH, Westerterp-Plantenga M, Martin CK. Sweetness, satiation, and satiety. J Nutr 2012; 142(6): 1149S-54S. Epub 2012 May 9.
[14] European Food Safety Authority (EFSA). Scientific Opinion Konjac mannan (glucomannan). EFSA J 2010; 8(10): 1798. [15] Natural Medicines Comprehensive Database. Glucomannan
Monograph. Therapeutic Research Center. Stockton 2012. [16] González A, Fernández N, Sahagún AM, et al.
Glucomanano: propiedades y aplicaciones terapéuticas. Nutr Hosp 2004; XIX (1) 45-50.
[17] Micromedex. Glucomannan Monograph. AltMedDex. USA 2012.
[18] Hess JR, Birkett AM, Thomas W, Slavin JL. Effects of short-chain fructooligosaccharides on satiety responses in healthy men and women. Appetite 2011; 56: 128-134.
http://dx.doi.org/10.1016/j.appet.2010.12.005
[19] El Khoury D, Cuda C, Luhovyy BL, Anderson GH. Beta Glucan: Health Benefits in Obesity and Metabolic Syndrome. Review article. J Nutr Metab 2012; 2012: 851362.
[20] European Food Safety Authority (EFSA). Scientific Opinion Beta-glucans from oat. EFSA J 2011; 9(6): 2207.
[21] Natural Medicines Comprehensive Database. Beta-glucan Monograph. Therapeutic Research Center. Stockton 2013. [22] European Food Safety Authority (EFSA). Scientific Opinion
Chromium. EFSA J 2010; 8(10): 1732.
[23] Anderson RA. Effects of Chromium on Body Composition and Weight Loss. Nutr Rev 1998; 56(9): 266-270.
http://dx.doi.org/10.1111/j.1753-4887.1998.tb01763.x
[24] Onakpoya I, Posadzki P, Ernst E. Chromium supplementation in overweight and obesity: a systematic review and meta-analysis of randomized clinical trials. Obes Rev 2013; 14(6): 496-507.
http://dx.doi.org/10.1111/obr.12026
[25] Natural Medicines Comprehensive Database. Chromium Monograph. Therapeutic Research Center. Stockton 2012. [26] Micromedex. Chromium Monograph. AltMedDex. USA 2012. [27] Gouta B, Bourges C, Paineau-Dubreuil S. Satiereal, a
Crocus sativus L extract, reduces snacking and increases satiety in a randomized placebo-controlled study of mildly overweight, healthy women. Nutr Res 2010; 30: 305-313.
http://dx.doi.org/10.1016/j.nutres.2010.04.008
[28] Srivastava R, Ahmed H, Dixit RK, Dharamveer, Saraf SA. Crocus sativus L. A comprehensive review. Pharmacogn Rev 2010; 4(8): 200-208.
http://dx.doi.org/10.4103/0973-7847.70919
[29] Natural Medicines Comprehensive Database. Saffron Monograph. Stockton 2013.
[30] Ulbricht C1, Conquer J, Costa D, Hollands W, et al. An evidence-based systematic review of saffron (Crocus sativus) by the Natural Standard Research Collaboration. J Diet Suppl 2011; 8(1): 58-114.
http://dx.doi.org/10.3109/19390211.2011.547666
[31] Hausenblas HA1, Saha D, Dubyak PJ, Anton SD. Saffron (Crocus sativus L.) and major depressive disorder: a meta-analysis of randomized clinical trials. J Integr Med 2013; 11(6): 377-83.
Received on 23-05-2014 Accepted on 22-07-2014 Published on 12-08-2014
DOI: http://dx.doi.org/10.6000/1927-5951.2014.04.03.2
© 2014 Rafecas et al.; Licensee Lifescience Global.
This is an open access article licensed under the terms of the Creative Commons Attribution Non-Commercial License (http://creativecommons.org/licenses/by-nc/3.0/) which permits unrestricted, non-commercial use, distribution and reproduction in any medium, provided the work is properly cited.