2021-01-08T15:34:06Z
Acceptance in OA@INAF
4.5 Years of Multi-wavelength Observations of MRK 421 During the ARGO-YBJ
and FERMI Common Operation Time
Title
Bartoli, B.; Bernardini, P.; Bi, X. J.; Cao, Z.; Catalanotti, S.; et al.
Authors
10.3847/0067-0049/222/1/6
DOI
http://hdl.handle.net/20.500.12386/29614
Handle
THE ASTROPHYSICAL JOURNAL SUPPLEMENT SERIES
Journal
222
4.5 YEARS OF MULTI-WAVELENGTH OBSERVATIONS OF MRK 421 DURING THE ARGO-YBJ AND FERMI
COMMON OPERATION TIME
B. Bartoli1,2, P. Bernardini3,4, X. J. Bi5, Z. Cao5, S. Catalanotti1,2, S. Z. Chen5, T. L. Chen6, S. W. Cui7, B. Z. Dai8, A. D’Amone3,4, Danzengluobu6, I. De Mitri3,4, B. D’Ettorre Piazzoli1,2, T. Di Girolamo1,2, G. Di Sciascio9, C. F. Feng10,
Zhaoyang Feng5, Zhenyong Feng11, Q. B. Gou5, Y. Q. Guo5, H. H. He5, Haibing Hu6, Hongbo Hu5, M. Iacovacci1,2, R. Iuppa9,12, H. Y. Jia11, Labaciren6, H. J. Li6, C. Liu5, J. Liu8, M. Y. Liu6, H. Lu5, L. L. Ma5, X. H. Ma5, G. Mancarella3,4,
S. M. Mari13,14, G. Marsella3,4, S. Mastroianni2, P. Montini9, C. C. Ning6, L. Perrone3,4, P. Pistilli13,14, P. Salvini15, R. Santonico9,12, P. R. Shen5, X. D. Sheng5, F. Shi5, A. Surdo4, Y. H. Tan5, P. Vallania16,17, S. Vernetto16,17, C. Vigorito17,18, H. Wang5, C. Y. Wu5, H. R. Wu5, L. Xue10, Q. Y. Yang8, X. C. Yang8, Z. G. Yao5, A. F. Yuan6, M. Zha5,
H. M. Zhang5, L. Zhang8, X. Y. Zhang10, Y. Zhang5, J. Zhao5, Zhaxiciren6, Zhaxisangzhu6, X. X. Zhou11, F. R. Zhu11, and Q. Q. Zhu5
(The ARGO-YBJ Collaboration)
1
Dipartimento di Fisica dell’Università di Napoli “Federico II,” Complesso Universitario di Monte Sant’Angelo, via Cinthia, I-80126 Napoli, Italy 2Istituto Nazionale di Fisica Nucleare, Sezione di Napoli, Complesso Universitario di Monte Sant’Angelo, via Cinthia, I-80126 Napoli, Italy
3
Dipartimento Matematica e Fisica“Ennio De Giorgi,” Università del Salento, via per Arnesano, I-73100 Lecce, Italy 4
Istituto Nazionale di Fisica Nucleare, Sezione di Lecce, via per Arnesano, I-73100 Lecce, Italy 5
Key Laboratory of Particle Astrophysics, Institute of High Energy Physics, Chinese Academy of Sciences, P.O. Box 918, 100049 Beijing, China;[email protected] 6
Tibet University, 850000 Lhasa, Xizang, China 7
Hebei Normal University, 050024, Shijiazhuang Hebei, China 8
Yunnan University, 2 North Cuihu Road, 650091 Kunming, Yunnan, China
9Istituto Nazionale di Fisica Nucleare, Sezione di Roma Tor Vergata, via della Ricerca Scientifica 1, I-00133 Roma, Italy 10
Shandong University, 250100 Jinan, Shandong, China 11
Southwest Jiaotong University, 610031 Chengdu, Sichuan, China 12
Dipartimento di Fisica dell’Universit‘′a di Roma “Tor Vergata,” via della Ricerca Scientifica 1, I-00133 Roma, Italy 13Dipartimento di Fisica dell’Universit‘′a “Roma Tre,” via della Vasca Navale 84, I-00146 Roma, Italy 14
Istituto Nazionale di Fisica Nucleare, Sezione di Roma Tre, via della Vasca Navale 84, I-00146 Roma, Italy 15
Istituto Nazionale di Fisica Nucleare, Sezione di Pavia, via Bassi 6, I-27100 Pavia, Italy 16
Osservatorio Astrofisico di Torino dell’Istituto Nazionale di Astrofisica, via P. Giuria 1, I-10125 Torino, Italy 17
Istituto Nazionale di Fisica Nucleare, Sezione di Torino, via P. Giuria 1, I-10125 Torino, Italy 18
Dipartimento di Fisica dell’Università di Torino, via P. Giuria 1, I-10125 Torino, Italy Received 2015 March 22; accepted 2015 November 20; published 2016 January 14
ABSTRACT
We report on the extensive multi-wavelength observations of the blazar Markarian 421(Mrk 421) covering radio to γ-rays, during the 4.5 year period of ARGO-YBJ and Fermi common operation time, from 2008 August to 2013 February. These long-term observations, extending over an energy range of 18 orders of magnitude, provide a unique chance to study the variable emission of Mrk 421. In particular, due to the ARGO-YBJ and Fermi data, the entireenergy range from 100 MeV to 10 TeV is covered without any gap. In the observation period, Mrk 421 showed both low- and high-activity states at all wavebands. The correlations among flux variations in different wavebands were analyzed. The X-rayflux is clearly correlated with the TeV γ-ray flux, while the GeV γ-rays only show a partial correlation with the TeVγ-rays. Radio and UV fluxes seem to be weakly or not correlated with the X-ray and γ-ray fluxes. Seven large flares, including five X-ray flares and two GeV γ-ray flares with variable durations(3–58 days), and one X-ray outburst phase were identified and used to investigate the variation of the spectral energy distribution with respect to a relative quiescent phase. During the outburst phase and the seven flaring episodes, the peak energy in X-rays is observed to increase from sub-keV to a few keV. The TeV γ-ray flux increases up to 0.9–7.2 times the flux of the Crab Nebula. The behavior of GeV γ-rays is found to vary depending on theflare, a feature that leads us to classify flares into three groups according to the GeV flux variation. Finally, the one-zone synchrotron self-Compton model was adopted to describe the emission spectra. Two out of three groups can be satisfactorily described using injected electrons with a power-law spectral index around 2.2, as expected from relativistic diffuse shock acceleration, whereas the remaining group requires a harder injected spectrum. The underlying physical mechanisms responsible for different groups may be related to the acceleration process or to the environment properties.
Key words: BL Lacertae objects: individual(Markarian 421) – galaxies: active – gamma-rays: general – radiation mechanisms: non-thermal
Supporting material: machine-readable tables
1. INTRODUCTION
Active galactic nuclei (AGNs), one of the most luminous sources of electromagnetic radiation in the universe, are
galaxies with a strong and variable non-thermal emission, believed to be the result of the accretion of mass onto a supermassive black hole (with a mass ranging from ∼106 to ∼1010M
) lying at the center of the galaxy. In some cases
(10%), AGNs show powerful and highly collimated relati-vistic jets shooting out in opposite directions, perpendicular to the accretion disk. The jets emanate from the vicinity of the
black hole (∼0.1 pc) and extend up to ∼1 Mpc. They are
usually associated withseveral bright superluminal knots, which appear to be related to the episodic ejection of plasmoid
blobs (see, for example, the case of the active galaxy
M87;Cheung et al.2007). The origin of the AGN jets is one
of the open problems in astrophysics.
AGNs viewed at a small angle to the axis of the jet are called blazars. They usually showflat radio spectra, strong variability, optical polarization, and γ-ray emission. Blazars include BL Lac objects, which have a lower luminosity and lack of strong emission lines in the optical band, and flat-spectrum radio quasars (FSRQ), which show a higher luminosity with strong and broad emission lines. The strongly Doppler-boosted radiation makes blazars the most extreme class of AGNs, where the boosted emission overwhelms all other emission -from the source. Therefore, the observation of blazars allows a deep insight into the physical conditions and emission processes of relativistic jets.
Blazars are the dominant extragalactic source class inγ-rays, as revealed by the Fermi Large Area Telescope(LAT) survey at GeV energies (Nolan et al. 2012). Moving to very high
energies (VHE, >0.1 TeV), the BL Lac objects dominate the extragalactic sky. Up to now, 60 AGNs have been established
as VHE γ-ray emitters, including 52 BL Lac objects.19
Although the γ-ray emission from blazars has been studied for about two decades, it is still unclear where and how the emission originates. Observations of the misaligned radio galaxy M87 indicate that VHE γ-rays, at least during flaring periods, seem to originate within the jet collimation region, in the immediate vicinity of the black hole (Acciari et al.2009a; Abramowski et al.2012). The high-energy particles responsible
for the non-thermal emission are generally believed to be accelerated in the relativistic shock front, described by the theory of diffusive acceleration (for a review, see Kirk & Duffy 1999).
The radiation of a blazar is a broadband continuum ranging from radio through X-rays to γ-rays. The spectral energy distributions (SEDs) are characterized by two distinct bumps, which are believed to be dominated by non-thermal emission. The lower energy component, which peaks in the optical through X-ray, is caused by the synchrotron radiation from relativistic electrons(and positrons) within the jet. The origin of the high-energy γ-ray component is still debated. The general view attributes it to inverse Compton scattering of the
synchrotron (synchrotron self-Compton, SSC) or external
photons (external Compton, EC) by the same population of relativistic electrons (Dermer et al. 1992; Sikora et al. 1994; Ghisellini et al.1998). However, the hadronic scenario, which
attributes theγ-ray emission to proton-initiated cascades and/
or to proton-synchrotron emission in a magnetic
field-dominated jet (Aharonian2000), cannot be excluded.
In this panorama, multi-wavelength observations are of fundamental importance. According to the present measure-ments, X-rays and VHEγ-rays are correlated during the flaring periods(for reviews, see Wagner2008; Chen2013). Recently,
a long-term continuous monitoring of Mrk 421 performed by the Astrophysical Radiation with Ground-based Observatory at
YangBaJing (ARGO-YBJ) experiment and different satellite-borne X-ray detectors (Bartoli et al. 2011a) showed a good
correlation in terms of flux and spectral index. All the observational features indicate that γ-rays and X-rays have a common origin, supporting the leptonic models. The tight correlation is a challenge for models based on hadronic processes. According to a recent collective evidence (Meyer
et al. 2012), the SSC mechanism seems to dominate the
emission of BL Lac objects, while the EC component becomes important for FSRQ. The lack of strong emission lines in the radiation of BL Lac objects is also taken asevidence for a minor role of ambient photons (e.g., Krawczynski 2004),
favoring the SSC model. In this sense, we can assume that BL Lac objects are less affected by the circumambient background radiation and can be considered as ideal targets for the study of the physical processes within the jets. However, even in the framework of the SSC model, the fundamental question of the origin of the flux and spectral variability, observed on timescales from minutes to years, is still open.
Mrk 421(z = 0.031), classified as a BL Lac object, is one of the brightest VHE γ-ray blazars known. It is a very active blazar with major outbursts, composed of many short flares, about once every two years, in both X-rays andγ-rays (Aielli et al. 2010; Bartoli et al. 2011a; Chen 2013). Actually, it is
considered an excellent candidate to study the physical processes within the AGN jets. During the last decade, several coordinated multi-wavelength campaigns focusing on Mrk 421 were conducted, both in response to strong outbursts or as part of dedicated observation campaigns. Complex relations
between X-rays and VHE γ-rays spectra were observed in
manyflares (see our previous review in Bartoli et al.2011a).
However, due to the sparse multi-frequency data during long periods of time, no systematic studies on flux variation and SED evolution were achieved, especially in theγ-ray band. In the beginning of 2009, a multi-frequency observational campaign of Mrk 421 was carried out for 4.5 months with an excellent temporal(except at VHE) and energy coverage from radio to VHE γ-rays. During the entirecampaign, however,
Mrk 421 showed a low activity at all wavebands (Abdo
et al.2011).
To understand the emission variability and the underlying acceleration and radiation mechanisms in jets, continuous multi-wavelength observations, particularly in X-rays and VHE γ-rays, are crucial. A simultaneous SED could provide a snapshot of the emitting population of particles and also constrain the model parameters at a given time (Zhang et al.
2012; Yan et al. 2014). The shape of particle energy
distribution could bring information on the underlying accel-eration processes (e.g., Cao & Wang 2013; Yan et al. 2013; Chen 2014; Peng et al. 2014). In the VHE band, Cherenkov
telescopes cannot regularly monitor AGNs, because of their limited duty cycle and narrowfield of view (FOV). Wide-FOV extensive air showers(EAS) arrays, with high-duty cycles, are more suitable for this purpose. A review on EAS arrays and their observations of AGNs can be found in Chen(2013).
ARGO-YBJ is an EAS array with an energy threshold for
primary γ-rays of ∼300 GeV. For fiveyears ARGO-YBJ
continuously monitored the blazar Mrk 421, extending at higher energies the multi-wavelength survey carried out by the Owens Valley Radio Observatory(OVRO), the satellite-borne X-ray detectors Swift, the Rossi X-ray Timing Explorer(RXTE),
the Monitor of All-sky X-ray Image (MAXI), and the GeV
19
γ-ray detector Fermi-LAT. In particular, due to the ARGO-YBJ and Fermi-LAT data, the high-energy component of Mrk 421 SED has been completely covered without any gap from 100 MeV to 10 TeV. In this paper, we report on the 4.5 year multi-wavelength data recorded from 2008 August to 2013 February, a period that includes several largeflares of Mrk 421. Such a long-term, multi-wavelength observation is rare and provides a unique opportunity to investigate on the emission variability of Mrk 421 from radio frequencies to TeV γ-rays.
This work is organized as follows: in Section 2 we
summarize the data at different wavelengths collected by both satellite-borne and ground-based detectors. In Section 3 the light curves and SEDs observed by the different detectors are presented. In Section4the key parameters of the one-zone SSC emission model are obtained by fitting the data, then the astrophysical implications are discussed in Section 5. A summary is given in Section 6. The cosmology parameters used in this paper are: H0= 70 km s pc-1 -1, W = 0.3, andM
WL= 0.7. The redshift of Mrk 421 corresponds to a luminosity
distance of 135.9 Mpc.
2. MULTI-WAVELENGTH OBSERVATIONS AND ANALYSIS
The present section reviews the available data sets. We briefly summarize the energy range in which each detector works and the data processing steps. More details can be found in the cited references.
2.1. ARGO-YBJ VHEγ-ray Data
ARGO-YBJ is an EAS detector located at an altitude of 4300m a.s.l.(atmospheric depth 606 g cm−2) at the Yangbajing
Cosmic Ray Laboratory (30.11 N, 90.53 E) in Tibet, P.R.
China. It is mainly devoted to γ-ray astronomy (Bartoli et al.2012a,2012b,2012c,2013b,2014,2015) and cosmic ray
physics (Bartoli et al. 2012d, 2012e, 2013c). The detector
consists of a carpet (∼74 × 78 m2) of resistive plate chambers (RPCs) with ∼93% of active area, surrounded by a partially instrumented area(∼20%) up to ∼100×110 m2. Each RPC is read out by 10 pads (55.6 cm×61.8 cm) representing the spacetime pixels of the detector. Details of the detector layout can be found in Aielli et al. (2006). Due to the full coverage
configuration and the location at high altitude, the detector energy threshold is∼300 GeV, much lower than any previous EAS array, as Tibet ASγ (Amenomori et al.2005) and Milagro
(Abdo et al.2014).
The ARGO-YBJ experiment, with a ∼2 sr FOV, is able to monitor the sources in the sky with a zenith angle less than 50°. At the ARGO-YBJ site, Mrk 421 culminates with a zenith angle of 8°.1, and is observable for 8.1 (4.7) hr per day with a zenith angle less than 50° (30°).
The detector, in its full configuration, has been in stable data taking since 2007 November to 2013 February, with4% of dead time and an average duty cycle higher than 86%. The detector performance and the analysis techniques are exten-sively discussed in Bartoli et al.(2013a). The detector angular
resolution depends on the number of triggered pads Npad,
ranging from 1°.7 for Npad> 20 to 0°.2 for Npad> 1000. The
median primary energy of γ-rays is 0.36 TeV for events with Npad> 20 and 8.9 TeV for Npad> 1000 (Bartoli et al.2013a).
The light curves presented here are obtained selecting the events with Npad> 60, corresponding to a photon median
energy of ∼1.1 TeV. The cosmic ray background around the source direction is estimated using the direct integral method (Fleysher et al.2004). The spectrum is estimated as described
in Bartoli et al. (2011a)by comparing the detected and the
expected signal (i.e., the number of events) as a function of Npad. Five intervals, Npad= 20–59, 60–99, 100–199, 200–499,
and >500, are considered, corresponding to a γ-ray energy range between 0.3 TeV and 10 TeV. The spectrum is assumed to follow a single power law (PL): f E( ) = J0·E-a. The simulated events are sampled in the energy range from 10 GeV to 100 TeV. The ARGO-YBJ detector response has been
evaluated using a custom Montecarlo simulation (see Guo
et al.2010).
2.2. Fermi-LAT HEγ-ray Data
Fermi-LAT (Atwood et al. 2009) is a pair-conversion
telescope, with a FOV of over 2 sr, operating in the energy
range above 100 MeV. Fermi-LAT began takingscience
datain 2008 August. The data used in this work have been downloaded through the Fermi science support center.20 A circular region of 15° radius centered on Mrk 421 was chosen for the event reconstruction. The analysis was performed using the ScienceTool and the corresponding threads, provided by the Fermi-LAT collaboration (Version v9r33p0).21 Events with zenith angles <100 were selected from the Source class events, which have the highest probability of being photons. The light curve was created through aperture photometry, which allows a model-independent determination of theflux, including both background and source emission. To build the SED of the source, we used the suggested gtlike tool, based on a binned maximum likelihood method. The instrument response function is P REP SOURCE V7 - - 15, and the Galactic
emission was reproduced using the model of
gll iem v- - 05-rev1.fit. The model for the extragalactic isotropic diffuse emission was iso source- 05-rev1.txt. All sources within 20° from the Mrk 421 position were taken into account. The spectral parameters are kept free for the sources within 10°, while are fixed to the values given in the second Fermi-LAT catalog(Nolan et al.2012) for other sources.
To describe the source spectrum from 100 MeV to 500 GeV, we use two different models: the Power Law model and the
LogParabolic model (LP). The latter is described by the
expression f E J E E a b E E
0 0 log 0
( ) = · ( )- +( · ( ), where E
0
indi-cates the normalization energy, J0theflux at E0, b the curvature
around the SED peak, and a the spectral index below the SED peak. Following Nolan et al. (2012), these two models are
compared by defining the curvature test statistic
TScurve= (TSLP − TSPL). The significance of the curvature
can be approximately estimated as TScurve.
2.3. Swift-BAT Hard X-Ray Data
The Swift Burst Alert Telescope(BAT;Gehrels et al.2004)
is a coded aperture mask imaging telescope (1.4 sr FOV) operating since 2005 February. It orbits the Earth every 1.5 hr and monitors the entire sky at hard X-rays once per day. The dailyflux from Mrk 421 at energy 15–50 keV is provided by Swift-BAT22(Krimm et al.2013) and is used here to build the
20
http://fermi.gsfc.nasa.gov/ssc/ 21
http://fermi.gsfc.nasa.gov/ssc/ 22
Transient monitor results provided by the Swift-BAT team:http://heasarc. gsfc.nasa.gov/docs/swift/results/transients/weak/.
light curve. To obtain the SED, we downloaded all the available data of Mrk 421 through the HEASARC data archive.23The data analysis includes the recipes presented in Ajello et al.(2008) and Tueller et al. (2010). The spectrum was
obtained as a weighted average of the source spectra using a six-channel binning in the 14–195 keV energy range, i.e.,
14–22, 22–30, 30–47, 47–71, 71–121, and 121–195 KeV. A
power-law function was used to fit the measured spectrum. 2.4. MAXI-GSC X-Ray Data
The MAXI Gas Slit Camera (GSC;Matsuoka et al. 2009)
detector, made of 12 one-dimensional position sensitive proportional counters, operating in the 2–20 keV range, began taking datain 2009 August. The experiment achieves 97% of sky coverage per day. The light curves for specific sources are publicly available24 in three energy bands: 2–4, 4–10, and 10–20 keV. These data were used in this work to build the X-ray spectrum of Mrk 421, comparing the measured counting rate in each band with the one of the Crab Nebula, used as standard candle, as proposed by the Swift-BAT collaboration (Tueller et al. 2010).
2.5. RXTE-ASM Soft X-Ray Data
The RXTE All Sky Monitor (ASM;Levine et al. 1996)
consists of three proportional counters, each one with a FOV of 6 ´90. It covers about 80% of the sky during one full revolution in about 1.5 hr. The RXTE-ASM data in the(2–12) keV range are publicly available.25The light curves are given in three energy bands: 1.5–3, 3–5, and 5–12 keV, which were used here to build the X-ray spectrum. For Mrk 421, the daily flux is provided from 1995 up to the middle of 2010.
2.6. Swift-XRT Soft X-Ray Data
The Swift X-ray Telescope(XRT;Burrows et al.2005) is a
focusing X-ray telescope with an energy range from 0.2 to 10 keV. The light curves at 0.3–10 keV for Mrk 421 (available here26) were directly used in this work. To obtain the SED, all the Swift-XRT Windowed Timing (WT) Observations, avail-able at HEASARC27, were downloaded. The Swift-XRT data set are calibrated using the calibration files available in the Swift database (CALDB28) and processed with the XRTDAS
software package (distributed by HEASARC within the
HEASoft package(v.6.16)29) using the xrtpipeline task. Events for the spectral analysis were selected within a circle of 30 pixel(71″) radius centered on the source position. The background was extracted from an annular region with a 40 pixelinner radius and 80 pixelouter radius, also centered on the source position. The count rate is less than 100 Hz for all the observations considered in this work, so the WT mode data should not be affected by pile-up effects. The average spectrum
in the 0.3–10 keV energy band was fitted using the XSPEC
package30 (v.12.8.2), assuming an LP model (fixing
E0= 1 keV), with an absorption hydrogen-equivalent column
density set to the Galactic value in the direction of the source, namely 1.92´1020cm-2 (Kalberla et al. 2005). For such a
spectrum model, the energy of the SED peak is estimated
as E 10 a b
peak = (2- ) 2 . In addition, a small energy offset
(∼40 eV) was applied to the observed energy spectrum, according to Abdo et al.(2011).
2.7. Swift-UVOT Ultraviolet Data
The Swift Ultraviolet/Optical Telescope (UVOT;Roming et al.2005) is the ultraviolet and optical telescope on board the
satellite. All the Swift-UVOT observations of Mrk 421, at the three ultraviolet bands(UVW1, UVM2, and UVW2) available at the HEASARC data archive, were included in our analysis. The level 2 UVOT images from the archive, produced by a custom UVOT pipeline with data screening and coordinate transformation, were directly used in this work. The photo-metry was computed using a 8 source region centered on the Mrk 421 position, performing the calibrations presented in Poole et al. (2008), which also convert UVOT magnitudes to
flux units. The latest UVOT calibration files released on 2013 January 18were used here. The background was extracted from an annular region(with radius of 20- 50) centered on the source position. Theflux has been corrected for the Galactic extinction using the Cardelli et al. (1989) parameterization,
with EB-V= 0.013 mag (Schlafly & Finkbeiner2011).
2.8. OVRO Radio Data
The OVRO(Richards et al.2011) is a 40 m radio telescope
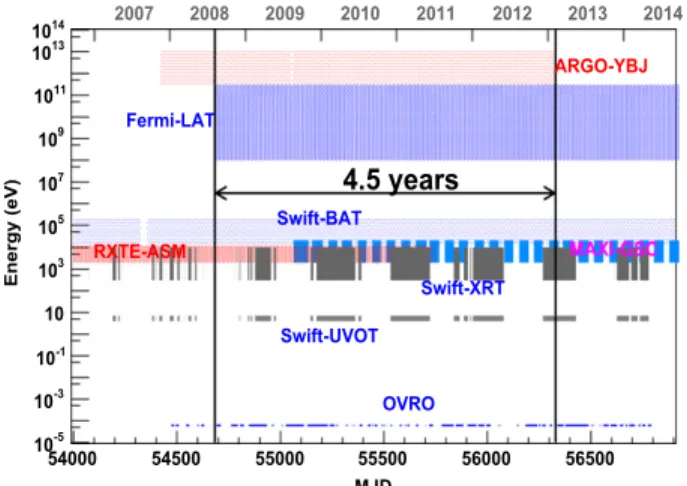
working at 15.0 GHz with 3 GHz bandwidth. Mrk 421 was observed by OVRO as part of the blazar monitoring program, which observed a sample of over 1800 AGNs twice per week. Mrk 421 has been included since the end of 2007. The light curve for Mrk 421 is publicly available31and is directly used in this work. The systematic error is estimated to be about 5% of theflux density, which is not included in the error bars. Figure 1. Time and energy coverage of different detectors in 4.5 years of Mrk 421 observation.
23
http://heasarc.nasa.gov/docs/archive.html 24
The MAXI data are provided by RIKEN, JAXA, and the MAXI team: http://maxi.riken.jp/top/
25
Quick-look results provided by the RXTE-ASM team:http://xte.mit.edu/ ASM_lc.html. 26http://www.swift.psu.edu/monitoring/ 27 http://heasarc.nasa.gov/docs/archive.html 28 http: //heasarc.gsfc.nasa.gov/docs/heasarc/caldb/caldb_supported_miss-ions.html 29http://heasarc.nasa.gov/lheasoft/ 30 http://heasarc.gsfc.nasa.gov/xanadu/xspec/ 31http://www.astro.caltech.edu/ovroblazars/
3. RESULTS
Figure 1 summarizes the temporal and energy coverage of the different instruments considered in this analysis. To monitor efficiently the HE and VHE components of Mrk 421 spectrum, we limit the observation time to the ∼4.5 years in which the data of Fermi-LAT(100 MeV < E < 500 GeV) and ARGO-YBJ (E > 300 GeV) overlap, i.e., since 2008 August 5 (start time of theFermi-LAT science data acquisition) to 2013 February 7(end time of the ARGO-YBJ data taking).
In the following, wefirst determine the light curves of Mrk 421 in the energy ranges explored by the different detectors. Then, by inspecting the light curves, we define the flaring and steady phases of the source. Finally, we analyze the general features of the corresponding SEDs.
3.1. Light Curves
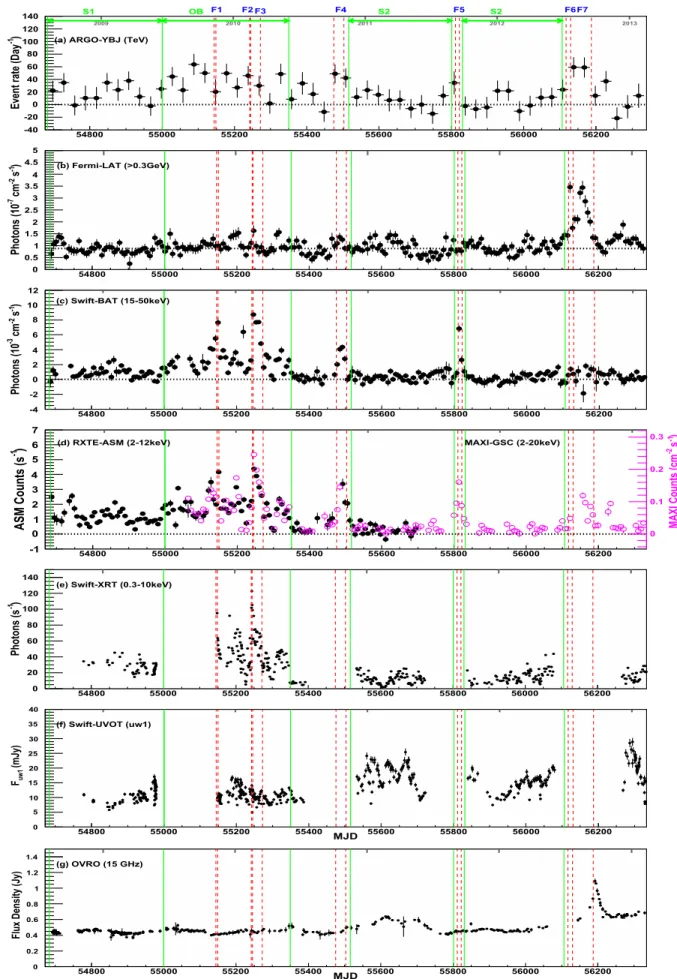
Figure2shows the light curves of Mrk 421, as obtained by the data of the previously described experiments, covering the entire energy range from the radio to the TeV band. The time integration is chosen taking into account the sensitivity of the instruments. For ARGO-YBJ each point corresponds to 1month (30 days) of data, while for Fermi-LAT, Swift-BAT, RXTE-ASM, and MAXI-GSC the data are averaged over 1week. For Swift-XRT and Swift-UVOT, each point is the result of each dwell, which last about hundreds of seconds. Note that since the Swift-UVOT light curves in the three
photometric bands(UVW1, UVM2, and UVW2) show similar
behaviors, only the light curve of UVW1 is considered here. For OVRO, each point is the result of each observation. The data presented in Figure 2are also listed in Table1.
According to the long-term light curves presented in Figure2, Mrk 421 showed both low- and high-activity phases at all wavebands during the 4.5 years considered in this work. To quantify the variability amplitudes in each energy band, the normalized variability amplitude (Fvar), defined according to
Edelson et al.(1996), was computed as
F F , 1 var tot 2 err 2 ¯ ( ) s s =
-wheres is the standard deviation of the flux,tot s is the meanerr
error of theflux points, and F¯ is the mean flux. To facilitate the comparison of Fvar for different bands, we rebinned all light
curves shown in Figure 2 with the same bin size, i.e.,
sevendays per bin. The ARGO-YBJ data with seven-day bin sizes are presented in Table1. The Fvaras a function of band
energy is shown in Figure 3. The variability amplitude
increases from 21% in radio to 137% in hard X-rays. The amplitude is 39% for GeV γ-rays, and it increases to 84% at TeV energies. It should be noted that the light curve of GeV γ-rays is obtained through the aperture photometry method, which includes a contribution from the background emission at an 18% level according to our estimation. Since the back-ground only affects the average flux and not the variability amplitude, the effective amplitude of GeV γ-ray variability is 47%.
According to Figure 2, only the light curves of Swift-BAT, Fermi-LAT, and ARGO-YBJ continuously sampled the entire4.5 yearperiod considered here. Several large X-ray and GeVγ-ray flares are visible from the light curves of
Swift-BAT and Fermi-LAT. The flux variability in the Swift-BAT
and Fermi-LAT energy bands does not seemto be correlated during flares. The variability of VHE γ-ray flux is roughly correlated both with X-ray and GeVflares. The variability of radio and UVflux does not seem to be correlated with that of X-rays andγ-rays. To be more rigorous, the discrete correlation function(DCF; Edelson & Krolik1988)is used to quantify the
degree of correlation between the light curve of Swift-BAT (Fermi-LAT andSwift-UVOT) with the others. To ensure the data is uniform, the cross-correlation analysis was performed, using weekly binned light curves. No significant time lag (within [−200, 200] days) was measured in this analysis except between Fermi-LAT and ORVO, where it was found that the GeV γ-rays lead the radio by 42 days, with a correlation coefficient r = 0.83±0.27. This result is consistent with Hovatta et al.(2015), who also measured a 40±9 days time
lag using 4 years of ORVO and Fermi-LAT data. Beside this, a possible time lag is measured between theSwift-UVOT and ORVO data. The UVflux seems to lead the radio by 21 days with a correlation coefficient r = 0.79±0.17, which,however, is comparable to the coefficient r = 0.62±0.14 obtained for a time lag equal to zero. The correlation coefficients for a time lag of zero are listed in Table2, for all the data sets. According to our analysis, the Swift-BAT hard X-rayflux is weakly anti-correlated with the radio and UVflux, while it is significantly correlated with the soft X-ray flux, not correlated with GeV γ-rays, and clearly correlated with VHE γ-rays. The Fermi-LAT GeVγ-ray flux is weakly correlated with radio, UV, and soft X-rays, and moderately correlated with VHEγ-rays. The UVflux appears to be moderately correlated with radio, weakly anti-correlated with X-rays, and clearly anti-correlated with VHEγ-rays. It should be noted, however, that the observation time of Swift-UVOT has several long gaps, which would affect the cross-correlation analysis. In particular, the anti-correlation with VHEγ-rays needs to be checked by future observations.
3.2. Source State Definition
In this paper, we will focus on the large X-ray and GeV γ-ray flares, with the aim to investigate the spectral variation at different wavebands, compared to the low-activity states. We will define different states of activity for Mrk 421 mainly basing on the light curves of Fermi-LAT and Swift-BAT, partially taking into account the curves of RXTE-ASM and MAXI-GSC. For X-ray flares, we will only select the flares which show a large increase both in hard and soft X-rays.
From 2008 August (MJD = 54683) to 2009 June
(MJD = 55000), Mrk 421 shows low activity at all wavebands. We mark this period as a Steady 1 (S1) phase. It should be noted that, during this period, a 4.5 monthlong
multi-frequency campaign was organized (Abdo et al. 2011).
Afterwards, according to the X-ray light curves of Swift-BAT, RXTE-ASM, and MAXI-GSC, the source entered a long-lasting outburst phase starting in 2009 June and ending in 2010 June(MJD = 55350), which we denoted as Outburst (OB). The X-rayflux is higher than in the S1 period and also varies with time. During this active phase, three largeflares, named Flare 1, Flare 2, and Flare 3(F1, F2, and F3) are clearly detected both
by Swift-BAT and RXTE-ASM. During F1, the flux starts to
increase on 2009 November 9 (MJD = 55144), reaches the
maximum on November 12, then decreases to a quasi-steady state on November 14. The averageflux is about 3 and 14 times higher than in the S1 phase, in the 2–12 keV and 15–50 keV
Figure 2. Mrk 421 light curves in different energy bands, from 2008 August 5 to 2013 February 7. Each bin of the ARGO-YBJ data contains the event rate averaged over 30 days. Each bin of the Fermi-LAT, Swift-BAT, RXTE-ASM, and MAXI-GSC data contains the event rate averaged over sevendays. The horizontal dotted line in panel(b) indicates the average flux before F6 and the horizontal dotted lines in the other panels indicate the zero flux.
(MJD = 55242) to 17) and F3 (from 2010 February 18 to
March 16 (MJD = 55271)) states were reported by MAXI at
2–10 keV (Isobe et al. 2010). A zoomed view of the light
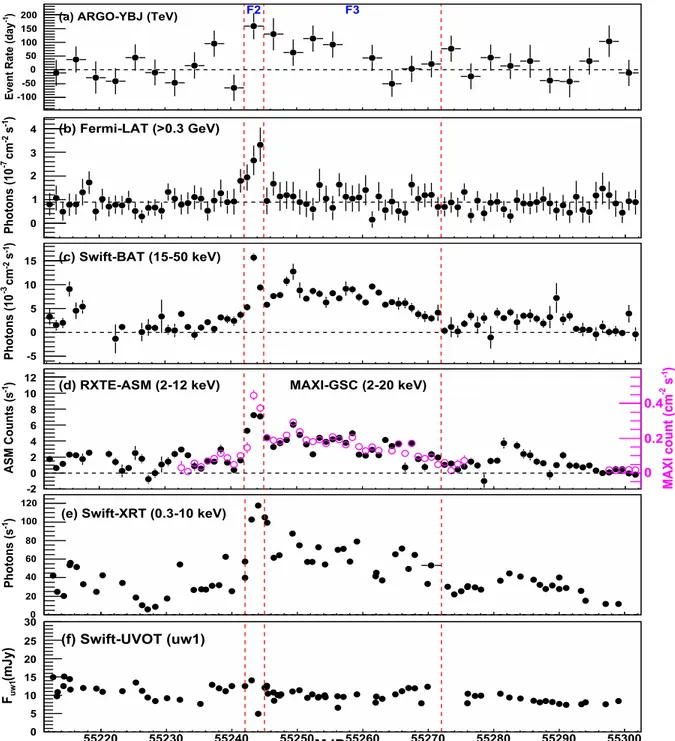
curves during bothflares is shown in Figure4, with a three-day binning for ARGO-YBJ and one-day binning for the other experiments. F2 is a very fast flare reaching the peak flux in
one day and then also decaying in one day. This flare is
associated with the huge VHEγ-ray flare with a flux around 10 times the Crab Nebula flux (Icrab) detected by VERITAS on
February 17 (MJD = 55244;Ong 2010). The γ-ray flux
enhancement is also evident in theFermi-LAT and
ARGO-YBJ data. F3 follows flare 2. Note that for the OB state, the embedded durations of flares F1, F2, and F3 are excluded.
After 2010 May, Mrk 421 entered a low steady phase that
ended on October 6 (MJD = 55475), when the flux of both
hard and soft X-rays started gradually to increase for two weeks. The whole period lasted about one month and is marked as Flare 4(F4). Then Mrk 421 came to a long and steady phase (S2), both in X-rays and γ-rays, which lasted about 1.6 years,
from2010 November (MJD = 55516) to 2012 June
(MJD = 56106). This is the longest steady phase during the monitored period, and therefore it has been selectedas a baseline reference to all the other states. The embedded strong flare, denoted as Flare 5 (F5), occurred in September 2011 (MJD = 55811) and lasted∼7 days, has been excluded from S2.
In the entireyear 2012, the flux in hard X-rays was almost
stable, while the GeV γ-ray flux measured by Fermi-LAT
entered into a high-flux level from 2012 July 9 (MJD = 56117) to September 17 (MJD = 56187). This is the first long-term GeVγ-ray flare from Mrk 421 ever detected, reported by both
Fermi-LAT (Ammando & Orienti 2012) and ARGO-YBJ
(Bartoli et al.2012f). According to the GeV γ-ray light curve,
two peaks are selected, marked as Flare 6(F6, from 2012 July 9 to 21(MJD = 56129)) and Flare 7 (F7, from 2012 July 22 to September 16), during whichthe VHE γ-ray flux detected by ARGO-YBJ also seems to be enhanced. Some hints of enhancement were partly observed by MAXI-GSC in the soft X-ray energy range.
The light curves during F1, F4, F5, F6, and F7 are shown in Figure5, where theflux measured by ARGO-YBJ is averaged over the different flare durations, and a three-day binning is used for the other experiments. The duration of all the selected states are summarized in Table3. Note that Swift-XRT data are only available for theF1, F2, F3, S1, S2, and OB states.
3.3. Spectral Energy Distribution
In this section, we report the multi-wavelength SEDs observed by the running experiments in the outlined states.
To model the spectral energy distribution f(E), we assume a simple power-law spectrum for Swift-BAT, RXTE-ASM, MAXI-GSC, Fermi-LAT, and ARGO-YBJ, while for Swift-XRT we assume a logparabolic function. In the following, F represents the integral flux over the detector energy range, α the spectral index of the power-law function, while a and b the parameters of the logparabolic model (see Section 2 for details). During S2, the Swift-BAT data are not significant enough tofit both the flux and the spectral index. For such a Table 1
Light Curves Shown in Figure2
MJD !T (Day) Fluxa !Fluxa Detector
54698.00 15.00 2.231e+01 1.560e+01 ARGO-YBJ
54728.00 15.00 3.486e+01 1.527e+01 ARGO-YBJ
54758.00 15.00 −1.327e+00 1.570e+01 ARGO-YBJ
54788.00 15.00 1.026e+01 1.973e+01 ARGO-YBJ
54818.00 15.00 1.047e+01 1.737e+01 ARGO-YBJ
54848.00 15.00 3.495e+01 1.492e+01 ARGO-YBJ
54878.00 15.00 2.322e+01 1.723e+01 ARGO-YBJ
54908.00 15.00 3.786e+01 1.477e+01 ARGO-YBJ
54938.00 15.00 1.242e+01 1.493e+01 ARGO-YBJ
54968.00 15.00 −2.462e+00 1.544e+01 ARGO-YBJ
54998.00 15.00 2.471e+01 1.505e+01 ARGO-YBJ
55028.00 15.00 4.428e+01 1.520e+01 ARGO-YBJ
55058.00 15.00 2.294e+01 2.037e+01 ARGO-YBJ
55088.00 15.00 6.377e+01 1.677e+01 ARGO-YBJ
55118.00 15.00 4.981e+01 1.594e+01 ARGO-YBJ
55148.00 15.00 2.032e+01 2.004e+01 ARGO-YBJ
55178.00 15.00 4.956e+01 1.539e+01 ARGO-YBJ
55208.00 15.00 2.683e+01 1.561e+01 ARGO-YBJ
55238.00 15.00 4.596e+01 1.528e+01 ARGO-YBJ
55268.00 15.00 2.997e+01 1.557e+01 ARGO-YBJ
Note. a
The flux units are events day−1 for ARGO-YBJ, photons cm−2s−1 for Fermi-LAT, Swift-BAT, and MAXI-GSC, photons s−1 for RXTE-ASM and Swift-XRT, mJy for Swift-UVOT, and Jy for OVRO.
(This table is available in its entirety in machine-readable form.)
Figure 3. Normalized variability amplitude Fvarfor different energy bands.
Table 2 Correlation Coefficient
rUVOTa rBATb rLATc
ORVO 0.62±0.14d −0.26±0.06 0.38±0.11e Swift-UVOT K −0.35±0.08 0.33±0.11 Swift-XRT −0.39±0.08 0.85±0.21 0.27±0.15 RXTE-ASM −0.47±0.10 0.87±0.17 0.38±0.14 MAXI-GSC −0.34±0.12 0.89±0.22 0.30±0.10 Swift-BAT −0.35±0.08 K −0.01±0.08 Fermi-LAT 0.33±0.11 −0.01±0.08 K ARGO-YBJ −0.90±0.33 0.76±0.25 0.61±0.22 Notes. a
Cross-correlation coefficient with Swift-UVOT. b
Cross-correlation coefficient with Swift-BAT. c
Cross-correlation coefficient with Fermi-LAT. d
The coefficient at lag = 21 day is r = 0.79±0.17. eThe coefficient at lag = 42 day is r = 0.83±0.27.
situation, the spectral index is fixed to 3.0. A similar
assumption has been chosen for ARGO-YBJ data by fixing
the spectral index to 2.75 during F5 and S2. The time-averaged SEDs for the different activity states, obtained by fitting the data of all the experiments, are summarized in Tables3and4. Theflux at each energy is shown in Figure7and also listed in Table5. Note that in the following text, thefirst and the second components refer to the two SED bumps of the SED, as foreseen in the SSC model.
3.3.1. Swift-XRT SED
According to the Swift-XRT data at 0.3–10 keV, the peak energy of thefirst component Epeakis 0.394±0.003 keV and
0.771±0.003 keV during S2 and S1, respectively. It increases to 1.429±0.004 keV during the OB phase and even up to 2.4–5.1 keV during F1, F2, and F3. The correlation between theflux and Epeakis shown in Table4and Figure6. A
power-law function is adopted to fit their relation, yielding
f Epeak 0.2056 0.004 Epeak
1.266 0.004
( ) = ( ) · - keV−1cm−2s−1
withc2 dof= 2113/4. S1, S2, OB, and F3 roughly follow this function, while F1 and F2 clearly deviate, indicating a different behavior of F1 and F2 with respect to the otherflaring states. It is worth notingthat the Swift-XRT observations during Flare 1 only cover the period with the maximumflux. For this reason,
the measured flux is higher than those of RXTE-ASM and
MAXI-GSC, as shown in Figure7. Figure 4. Mrk 421 light curve in different energy bands, from 30 days before Flare 2 to 30 days after Flare 3.
Figure 5. Mrk 421 light curve in different energy bands, from 30 days before to 30 days after the 5flares. Each bin of Fermi-LAT, Swift-BAT, RXTE-ASM, andMAXI-GSC contains the event rate averaged over threedays.
Table 3
SEDs of Mrk 421 during 10 States(the Unit of the Integral Flux F is Photons cm−2s−1)
State MJD F2 20 keV– α F14 195 keV– α F0.1 500 GeV– α F>1 TeV α
( 10´ -2) ( 10´ -3) ( 10´ -7) (I craba) Flare 1 55144–55149 18.3±1.8 2.00±0.16 23.1±2.6 2.78±0.27 1.11±0.36 1.57±0.15 3.2±0.9 2.78±0.36 Flare 2 55242–55245 41.4±4.2 2.38±0.15 19.2±1.9 2.76±0.18 3.48±0.60 1.50±0.08 7.2±1.5 2.61±0.27 Flare 3 55245–55272 19.9±1.6 2.20±0.11 12.9±0.9 2.61±0.13 1.84±0.21 1.79±0.09 1.4±0.5 2.42±0.46 Flare 4 55475–55503 10.0±1.1 2.17±0.22 5.82±0.83 3.02±0.30 2.16±0.19 1.74±0.05 1.9±0.5 2.85±0.26 Flare 5 55811–55818 17.0±1.6 2.13±0.15 13.3±1.4 2.74±0.23 2.23±0.33 1.79±0.09 2.1±0.8 2.75b Flare 6 56117–56130 6.15±0.96 2.05±0.35 1.45±0.40 2.47±0.62 6.05±0.39 1.68±0.04 1.7±0.6 2.84±0.39 Flare 7 56130–56187 8.70±0.91 2.97±0.18 1.53±0.36 3.09±0.61 5.20±0.19 1.75±0.02 1.1±0.4 3.22±0.24 Outburst 55000–55350c 8.91±0.74 2.41±0.11 4.58±0.59 2.97±0.23 1.92±0.06 1.76±0.02 0.91±0.14 2.67±0.16 Steady 1 54683–55000 K K 1.50±0.12 2.51±0.16 1.53±0.05 1.75±0.02 0.56±0.13 2.64±0.27 Steady 2 55516–56106d 1.78±0.18 2.38±0.19 0.318±0.087 3.0b 1.69±0.04e 1.77±0.01 0.33±0.10 2.75b
Detector MAXI-GCS Swift-BAT Fermi-LAT ARGO-YBJ
Notes. a
Icrab = 1.85´10-11. b
The spectral index isfixed. c
The periods of Flares 1, 2, and 3 have been excluded.
dThe periods of MJD 55801–55831, including Flare 5, have been excluded. e
3.3.2. MAXI-GSC and Swift-BAT SEDs
According to MAXI-GSC measurements at 2–20 keV, the
flux during the flaring periods increases by about a factor 4–20, compared to S2. The spectral indexes for most of the states are
in the 2–2.4 range while the spectrum softens (index
2.97± 0.18) during F7. In the X-ray band (14–195 keV), the Swift-BAT data shows an even larger variation (4–70 times) with spectral indexes ranging from 2.5 to 3.1.
3.3.3. Fermi-LAT and ARGO-YBJ SEDs
As stated in Section 2, we also test the significance of the spectrum curvature in the Fermi-LAT data. During the S2 phase, the TScurvevalue is found to be 32.6, corresponding to
5.7 standard deviations (s.d.). An evidence for a curvature is then observed in S2, with a peak energy Epeak= (60 ± 11)
GeV. The TScurve values for F2 and F7 are 8.0 and 9.4,
respectively, corresponding to 2.8 and 3.1 s.d., only showing a hint of curvature. The TScurvevalues for the other seven states
Table 4
SEDs of Mrk 421 During 7 States(the Unit for Integral Flux F is Photons cm−2s−1)
State F0.3-10 keV a b Epeak F2-12 keV α
(keV) ( 10´ -2) Flare 1 1.227±0.003 1.420±0.004 0.412±0.008 5.06±0.18 18.40±0.73 1.86±0.08 Flare 2 1.251±0.004 1.656±0.004 0.390±0.009 2.76±0.07 27.89±0.76 2.02±0.06 Flare 3 0.903±0.001 1.690±0.002 0.393±0.003 2.48±0.02 13.74±0.29 1.89±0.04 Flare 4 K K K 10.15±0.67 1.65±0.12 Outburst 0.5746±0.0003 1.864±0.001 0.448±0.002 1.419±0.004 7.19±0.13 2.19±0.04 Steady 1 0.4526±0.0004 2.104±0.001 0.462±0.003 0.771±0.003 4.86±0.11 2.41±0.06 Steady 2 0.229±0.0003 2.352±0.001 0.434±0.003 0.394±0.003 0.68±0.18 2.16±0.49
Detector Swift-XRT RXTE-ASM
Table 5
Energy and Flux of the Spectral Points shown in Figures7and8
State E E2dN/dE !(E2dN/dE) 95% u.l. Detector
(TeV) (erg cm−2s−1) (erg cm−2s−1) (erg cm−2s−1)
S1 4.470e-01 1.698e-11 2.625e-11 6.386e-11 ARGO-YBJ
S1 8.910e-01 3.632e-11 1.494e-11 6.094e-11 ARGO-YBJ
S1 1.413e+00 3.713e-11 9.739e-12 0 ARGO-YBJ
S1 2.818e+00 9.018e-12 6.650e-12 2.024e-11 ARGO-YBJ
S1 4.467e+00 7.560e-12 7.384e-12 2.028e-11 ARGO-YBJ
S1 1.520e-04 2.099e-11 1.840e-12 0 Fermi-LAT
S1 3.080e-04 2.143e-11 1.447e-12 0 Fermi-LAT
S1 6.270e-04 3.193e-11 1.669e-12 0 Fermi-LAT
S1 1.280e-03 3.228e-11 1.963e-12 0 Fermi-LAT
S1 2.590e-03 4.266e-11 2.837e-12 0 Fermi-LAT
S1 5.270e-03 5.517e-11 4.431e-12 0 Fermi-LAT
S1 1.070e-02 5.411e-11 6.199e-12 0 Fermi-LAT
S1 2.180e-02 7.172e-11 1.020e-11 0 Fermi-LAT
S1 4.440e-02 7.453e-11 1.478e-11 0 Fermi-LAT
S1 9.020e-02 9.906e-11 2.503e-11 0 Fermi-LAT
S1 1.830e-01 1.883e-10 5.048e-11 0 Fermi-LAT
S1 3.730e-01 6.174e-11 4.369e-11 1.640e-10 Fermi-LAT
S1 1.800e-08 4.853e-11 3.441e-12 0 Swift-BAT
S1 2.605e-08 3.283e-11 4.348e-12 0 Swift-BAT
S1 3.845e-08 2.889e-11 4.074e-12 0 Swift-BAT
(This table is available in its entirety in machine-readable form.)
Figure 6. Peak energy and the corresponding flux for different Mrk 421 states, as measured by Swift-XRT at 0.3–10 keV. The solid line is fitting result using a power-law function, which yields f E( peak) =
E
0.2056 0.004 peak1.266 0.004
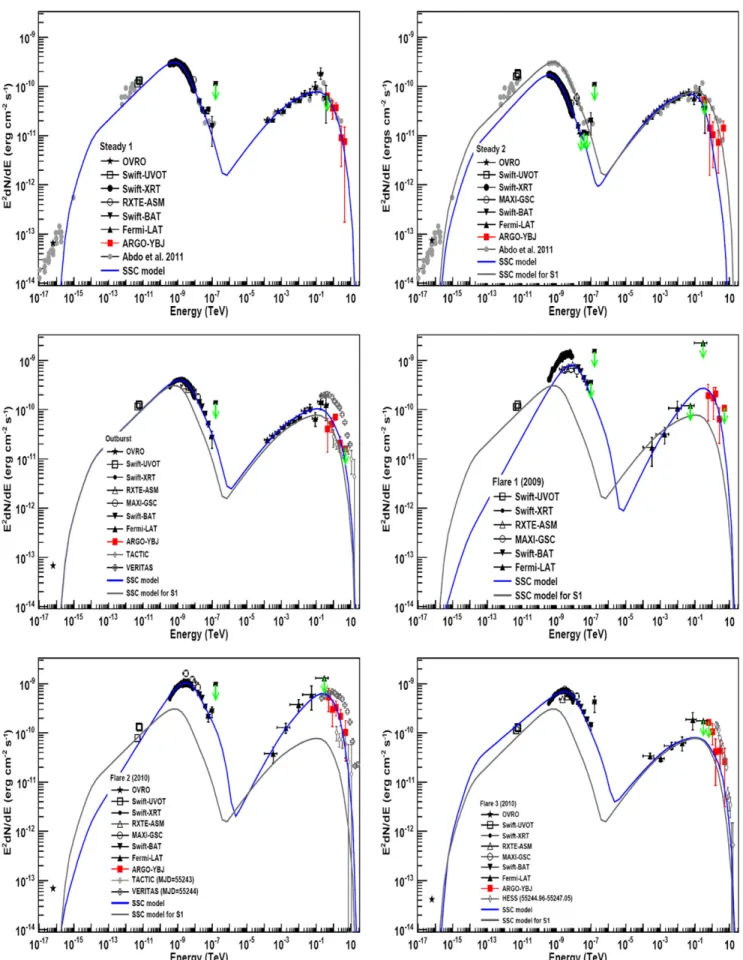
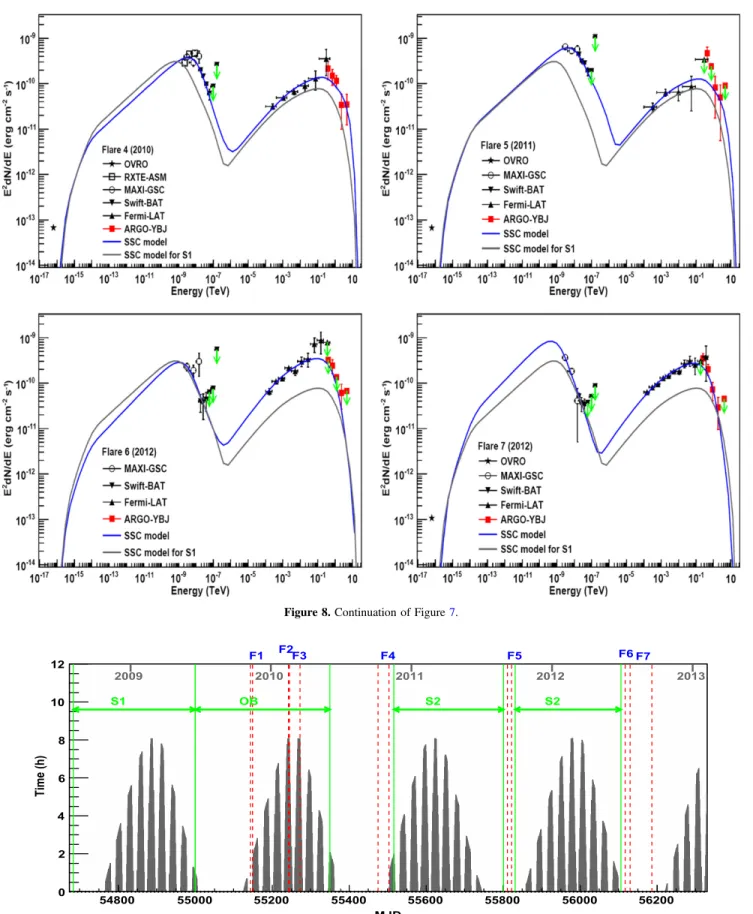
Figure 7. Spectral energy distribution of Mrk 421 during 10 states. The solid line shows the best fit to the data, assuming a homogeneous one-zone SSC model (the best-fit parameters are listed in Table6). For comparison, the model describing the Steady 1 (S1) is also plotted in the other ninestates.
are less than 3.4. No curvature are detected in these cases. These features are visible in Figure7. Note that the data points of Fermi-LAT are the result of the analysis made in differential energy ranges, and are independent of the assumed spectral models.
In the GeV γ-ray band, the F3, F4, F5, OB, S1, and S2 phases have similar spectral indexes (ranging from 1.74 to 1.80) and fluxes (within 32%), as shown in Table3. Compared to the S2 state, the spectral index of F1 shows a moderate
hardening (Δα = 0.20±0.15) and a flux decrease of
(34 ± 21)%. The spectral index of F2 hardens more signifi-cantly (Δα = 0.27±0.08) with a flux increase of a factor 2.06±0.36. A flux enhancement by a factor 3 is observed during F6 and F7, with a harder spectral index during F6 (Δα = 0.09±0.04) and a negligible index variation dur-ing F7.
In VHE γ-ray band, the S2 flux is estimated to be
(0.33 ± 0.10) Icrab, assuming a fixed spectral index, α = 2.75.
This result is comparable to the baseline flux of Mrk 421
obtained using a 20 yearlong-term combined ACT data
(Tluczykont et al. 2010), which is estimated to be less than
0.33 Icrab above 1 TeV. The averaged measured flux is
(0.56 ± 0.13) and (0.91 ± 0.14) Icrabduring S1 and OB phase,
respectively. F2 is the largest flare, achieving a flux of (7.2 ± 1.5) Icrab. The flux of the remaining flares is around
(1–3) Icrab. The spectral index of F7 (α = 3.22±0.24) marks
the softest spectrum of the observed flares. The flux
modulations appears in coincidence with the X-ray
observations.
Summarizing the above results, we can conclude that theflux
enhancements are detected in both X-rays and VHE γ-rays
during all the nine states, compared to the baseline S2. The behavior in the GeV band is actually different. Accordingly, a phenomenological classification of threetypes of SEDs (T1, T2, and T3) is here introduced:(1) flares with no or little GeV flux and photon index variations, (2) flares with γ-ray spectral hardening, irrespective of theflux variations, and (3) flares with flux enhancements, irrespective of spectral behavior. Type T1 includes phases S1, S2, F3, F4, F5, and OB. Type T2 includes
the F1 and F2 states and also the day (MJD = 56124),
corresponding to the F6 maximum flux, during which the
spectral index significantly hardens to α = 1.60±0.04. It is worth noting that this variation is fast: the hardening phase only lasts two days and recovers soon, indicating an unstable state. Type T3 includes phases F6 and F7. Actually, the spectral index of F7 becomes softer above the peak energy for both low- and high-energy components. The previousflare on 2008 May 7, reported by Acciari et al.(2009b), not included in this
present discussion, may also belong to this type.
Duringflares of types T1 and T2, the peak energies of both the low- and high-energy components shift to higher energy with respect to the baseline state S2. This tendency is consistent with most of the previous measurements(Massaro et al.2008; Albert et al. 2007) based on fragmented observations. This
indicates that the modulation of Mrk 421 flux follows these types in most of the cases. Duringflares of type T3, the peak energies could shift to lower energy with respect to S2, but this must be determined by the future observations of similarflares.
3.4. Cherenkov Detectors VHEγ-ray Data
During the 4.5 yearperiod from 2008 August to 2013
February, Cherenkov detectors(e.g., VERITAS, MAGIC)also
observed Mrk 421 in the VHE band. Even if these detectors cannot monitor Mrk 421 day by day, they can provide more precise measurements for short periods, due to their excellent sensitivity.
To give an example of the timing coverage of a Cherenkov detector, a dummy instrument located at 30° N (close to the
latitude of VERITAS, 32° N, and MAGIC, 28° N) is here
considered to estimate the allowable observation time for Mrk 421. Figure 9 shows the allowable time, requiring the Sun zenith angle be greater than 105°, the moon zenith angle greater than 100°, and the Mrk 421 zenith angle less than 50°.
Among the sevenflares presented in the last section, F4, F5, F6, and F7 occurred during the period from July to October, forbidden for Cherenkov detector observations, since Mrk 421 is close to the direction of the Sun. The moonlight completely hampered Cherenkov telescope observations during F1 and partially during F3. Onlyflare F2 could be eventually observed every night by Cherenkov detectors.
Actually, VERITAS observed Mrk 421 during the last day of F2, i.e., MJD= 55244. The preliminary spectrum is shown in Figure7and the correspondingflux above 1 TeV is 16.8 Icrab
(Fortson2012). TACTIC observed Mrk 421 every night during
F2(Singh et al.2015). The peak flux measured on February 16
(MJD = 55243) and the corresponding spectrum during the peakflux day is also shown in Figure7. Theflux above 1 TeV is 2.7 Icrab. HAGAR also observed Mrk 421 every night during
F2 (Shukla et al. 2012). The peak flux on February 17
(MJD = 55244) is about 7 Icrab. It is worth recalling that the
averageflux detected by ARGO-YBJ during the three days of F2 is(7.2 ± 1.5) Icrab.
Both VERITAS and HESS observed thefirst three days of flare F3. VERITAS preliminary results show that the flux decreased from 5.7 Icrab to 2.9 Icrab (Fortson 2012). HESS
preliminary results also shows a decreasingflux from 4.8 to 1.4 Icrab(Tluczykont2011).
The S1 period extends over the years 2008–2009 and during this time the Whipple telescope monitored the Mrk 421 emission. The total observation time is 130.6 hr and the mean γ-ray rate is 0.55±0.03 Icrab (Acciari et al.2014), which is
consistent with the ARGO-YBJ result, i.e., 0.56±0.13 Icrab.
During this period, MAGIC also observed Mrk 421 for about 27.7 hr (Abdo et al. 2011; Aleksic et al.2015a). The photon
fluxes for the individual observations gave an average flux of about 50% that of the Crab Nebula, with relatively mild (typically less than a factor of two) flux variations. The spectrum, shown in Figure 7, is consistent with the ARGO-YBJ data.
The OB period lasts over the years 2009–2010. The
spectrum measured by TACTIC, shown in Figure 7, is lower than that by ARGO-YBJ. The preliminary spectrum reported by VERITAS(Galante2011) is also shown in Figure7, which is higher than the one of ARGO-YBJ. These differences may be caused by the different observation times, considering that Mrk 421 was in an active and variable phase.
4. THE SSC MODEL FOR MRK 421
The different types of Mrk 421 flux variations can be
associated withthe intrinsic astrophysical mechanisms of the emission. In the following, we will investigate the major parameters correlated to these variations in the framework of the one-zone SSC emission model.
In this paper, the one-zone homogeneous SSC model proposed by Krawczynski (2004) is adopted to fit the
multi-wavelength SEDs measured during different states. In this model, a spherical blob of plasma with a comoving radius R is assumed. The relativistic Doppler Factor of the emitting plasma
is defined as d = G[ (1-bcosq)]-1, where Γ is the bulk
Lorentz factor of the emitting plasma,β is its bulk velocity in units of the speed of light, andθ is the angle between the jet axis and the line of sight, as measured in the observer frame. The emission volume isfilled with an isotropic population of Figure 8. Continuation of Figure7.
electrons and a randomly oriented uniform magnetic field B. The SED of the injected electrons in the jet frame is assumed to follow a broken power law with indexes p1 and p2 below and above the break energy Ebreak. The electron distribution is
normalized by a factor ue(in units of erg cm−3). To reduce the
free parameters in the model, the low limit for the electron energy Eminisfixed to be500·m ce 2and the high limit Emaxis
assumed to be10·Ebreak. The radius of the emission zone is
constrained by the variability of the timescale as
R <ctvard (1+ . In the multi-wavelength data consideredz) in this analysis, the fastest variability has a timescale of∼1 day, observed during F2, in X-rays and GeV γ-rays, as shown in Figure4. In this work, the radius R for all phases are arbitrarily set to be 1014 m, being tvar>4.8 20( d)hr the allowed time variability range. So far we have still six free parameters: p1, p2, Ebreak, ue, B, and δ to be determined experimentally by
fitting the data presented in Figure7.
In this work, we use the least-square method to determine the best values of the parameters p1, p2, Ebr, B,δ, and ue. For the
Swift-XRT flux data, we added a 3% systematic error besides the statistical error listed in Table5. The ultraviolet and radio data points were not used for thefit, as will be discussed later. The extragalactic background light (EBL) absorption of the VHE γ-ray is included in the calculation, according to the Franceschini et al. (2008) model.
Since the parameter p1 is related to the spectral shape at energies below the synchrotron and inverse Compton peaks, it is mainly determined by theSwift-XRT data in X-rays and by theFermi-LAT data in GeV γ-rays. For 5 out of 10states, the Swift-XRT data around the synchrotron peak are not availa-ble.Therefore, in thesecases,p1 is mainly determined by the Fermi-LAT data. The synchrotron peak energies of states S1 and S2 are close to the low-energy limit of the Swift-XRT data, hence the measurement below the synchrotron peak cannot strongly constrain the p1 value, which,in this case, will also be
mainly determined by the Fermi-LAT data. For the remaining three states, the statistical accuracy of the Swift-XRT data is much better than that of other detectors;however, the low-energy Swift-XRT measurements (at energies below ∼1 keV) are biased by the uncertainty in the absorption of hydrogen-equivalent column density and by detector systematics32(such as the CCD charge trapping, generated by radiation and high-energy proton damage, affecting mostly the low-high-energy events). For this reason, we prefer to use onlyγ-ray datafor all the 10 stateswhen fitting the parameter p1. The result and chi squares(c2g/ndf) obtained by the fitting procedure are listed in Table6. The derived p1 values for type T1 and T3 states are consistent within errors, ranging from 2.2 to 2.4. The results for
T2 flares indicate a harder electron spectrum, with
p1 = 1.70.3for F1 and p1 = 1.850.20for F2.
To obtain the remainingfiveparameters, the entire SED data above 0.3 keV are used. The Swift-XRT observation during F1 is not taken into account. The parameter p2 is determined by the spectral shape above the synchrotron and inverse Compton peak energies. Therefore, the parameter p2 is mainly determined by the Swift-XRT, RXTE-ASM, MAXI-GSC, and Swift-BAT data in X-rays, and by the ARGO-YBJ data in TeV γ-rays. The accuracy of theSwift-XRT measurements is much higher than that of other detectors;therefore,p2 can be well determined for states in which Swift-XRT data are available. The parameterδ is mainly determined by both the synchrotron and inverse Compton peak energies. There are no data data around the synchrotron peak for F5, F6, and F7;therefore, in these cases δ cannot be well constrained. In particular, we cannotfind a best value for F7 within a reasonable range. For flare F7, we arbitrarily set the value of Ebreakequal to the one
derived for the S2 state. Table 6
Best-Fit Parameters in the SSC Model for 10 States
State p1 p2 log(Ebreak) δ B ue u ue Ba Web c2g/ndf c /ndfall2
(eV) (G) (103erg cm−3) (1046erg)
Steady 1 2.30-+0.040.06 4.70-+0.070.03 11.00-+0.030.04 38+-46 0.048-+0.0120.012 6.65-+0.150.15 70.6 2.8 23.0/11 238/501 Steady 2 2.22-+0.060.09 4.68-+0.020.04 10.78-+0.040.05 15+-24 0.17-+0.050.07 12.7-+0.50.4 10.6 5.3 13.2/11 236/467 Outburst 2.30-+0.050.08 4.51+-0.030.02 11.13-+0.050.02 35-+35 0.054-+0.0050.026 7.74+-0.140.24 65.7 3.2 23.5/12 600.8/643 Flare 1 1.7 0.30.3 -+ 4.7 0.5 1.2 -+ 11.51 0.030.09 -+ 10 22 -+ 0.14 0.04 0.07 -+ 31 5 7 -+ 41.3 12.9 1.6/2 7.3/14 Flare 2 1.85-+0.200.20 4.30+-0.050.12 11.27-+0.030.03 17-+32 0.092-+0.0240.028 24-+23 73.0 10.1 3.7/3 179/308 Flare 3 2.40 0.150.15 -+ 4.60-+0.090.08 11.21-+0.030.02 41-+53 0.080-+0.0170.011 4.40+-0.100.07 17.3 1.8 13.2/4 1055.7/574 Flare 4 2.30-+0.150.15 5.6-+0.90.6 11.49-+0.070.08 35+-710 0.033-+0.0130.019 12.3-+1.01.3 289.2 5.2 6.1/5 23.4/15 Flare 5 2.3-+0.20.4 4.6+-0.50.7 11.35-+0.120.13 31-+2113 0.072-+0.0470.108 8.0+-1.21.4 39.2 3.4 6.8/4 12.1/13 Flare 6 2.20-+0.170.11 5.1-+0.71.8 11.17-+0.430.24 15+-524 0.085-+0.0330.053 40-+3028 120.8 16.8 12.1/8 17.5/17 Flare 7 2.20-+0.070.12 5.2-+0.20.3 10.78 30-+57 0.115-+0.0320.038 8.77+-1.321.40 16.6 3.7 2.45/3 14.1/20 Notes. a u ue B= 8 up /Be 2. b W u 4 R 3 . b e = e p 3 32 http://heasarc.gsfc.nasa.gov/docs/heasarc/caldb/swift/docs/xrt/
According to the fit results, the SSC model reasonably describes all the SEDs, as shown in Figures7and 8. The fact that Swift-XRT data below 0.5 keV are not perfectly described during OB, F2, and F3may be explained by the systematic errors previously discussed. The obtained parameters and chi squares (call2 /ndf) are summarized in Table 6. The Doppler factorδ, ranging from 10 to 41, is similar to the ones found in previous investigations(Abdo et al.2011; Bartoli et al.2011a; Shukla et al. 2012; Zhang et al. 2012). The values of the
magnetic field, B~0.1G, are almost constant within a factor 2. The jet power in electrons (10 1046– 47erg) is much higher
than that in magneticfield, as indicated by the electron energy density to the magnetic field energy density ratio u ue B, listed
in Table6.
5. DISCUSSION
Using the long-term multi-wavelength data from radio to
VHE γ-rays, we have shown that Mrk 421 is active at all
wavebands during the 4.5 years considered in this work. The variability of Mrk 421 increases with energy for both the low-and high-energy SED components. The source is highly
variable in the X-ray and VHE γ-ray bands, with the
normalized variability amplitudes greater than 70% (see
Figure 3). An overall cross-correlation analysis (see Table 2)
between theSwift-BAT and ARGO-YBJ data shows that the
variabilities in X-rays and VHEγ-rays are generally correlated. The correlation is also clearly visible in the light curves during the large X-ray flares (see Figures2,4 and 5). Our previous
observations during the outburst of 2008 also show that X-rays and VHEγ-rays were tightly correlated with the peak times in good agreement with each other(Bartoli et al.2011a). A clear
correlation between the X-rays and VHEγ-rays has also been reported in many observations in the past decades(Blazejowski et al. 2005; Chen2013; Acciari et al.2014). All these results
firmly support the idea that the X-ray and VHE γ-ray emissions of Mrk 421 originate from the same zone.
The variability amplitude in GeV γ-rays is 39% (see
Figure 3), which is less than that in VHE γ-rays. In fact, the
amplitude of the GeVγ-ray variability is very low most of the time, being only about 20% if the large GeVγ-ray flares F6 and F7 are excluded. The overall cross-correlation analysis (see Table2) shows that GeV γ-rays are moderately correlated with
VHEγ-rays. The GeV and VHE γ-ray light curves reported in Figures4and5show an evident correlation only during F2, F6, and F7. According to the measurements shown in Table 3, during flares F3, F4, F5, and the OB phase, the flux above 0.1 GeV increases by 20%–46% with respect to the S1 steady state, while the VHEflux increases by 63%–275%. With these results, we could notexclude the possibility that GeV and TeV γ-rays are produced in different emission zones. A possible scenario would be that the observed emission is the super-position of one stationary zone with a steady GeV emission and one active zone responsible for the VHE flux variation (e.g., Cao & Wang 2013; Aleksic et al. 2015b). However, during
flares F1, F2, F6, and F7, GeV and TeV γ-rays show clear correlated variations, according to the SEDs reported in Figure 7. This could indicate that GeV and TeV emissions are generated in the same zone, at least during these phases. In particular, during flare F1, the flux above 0.1 GeV decreases byabout (27 ± 24)%. If this decrease is not due to a statistical fluctuation, the stationary zone would be excluded, and the above hypothesis of two emission zones could be excluded,
too. Moreover, during F6 and F7, the GeVγ-ray flux increases by a large amount (240%–295%), while the spectral indices were about consistent. Also, this result does not support the hypothesis of two zones, since the predicted spectrum at GeV energies for the active zone is much harder than that for the steady zone, according to Cao & Wang (2013) and Aleksic
et al.(2015b).
Compared to other wavebands, the flux variation at radio frequencies is much weaker. A radioflare is observed in 2012, which is the largest radio flare ever observed in Mrk 421 (Hovatta et al.2015). The cross-correlation analysis shows that
this radioflare follows the GeV γ-ray flare with a time lag of about 42 days(see Table2), which is consistent with Hovatta
et al.(2015). If the radio and GeV γ-ray flares are physically
connected(Hovatta et al.2015), then the GeV γ-ray emission
could originate upstream of the radio emission. The distance between radio and GeVγ-ray emission sites and their distances to the central black hole have been discussed by Max-Moerbeck et al.(2014).
The variability amplitude in the UV band is 33%, similar to that in GeV γ-rays.However, according to the cross-correla-tion analysis(see Table2) and to the light curves (see Figures2
and4), the UV flux does not appearto be correlated with GeV
γ-rays. The UV flux does not even showan evident correlation with X-rays. Moreover, according to the SED offlare F1 shown in Figure7, the UV and X-ray data cannot be fitted together with a unique component. These results seem to indicate that the UV and X-ray emissions do not share the same origin. Instead, the moderate correlation observed between UV and radio suggests that their emission regions could be the same, possibly located downstream of the X-ray andγ-ray emission zone. Therefore, the radio and UV data points were removed from the SSC modelfitting. This choice is different from other authors, e.g., Abdo et al.(2011) and Shukla et al. (2012), who
included them when fitting the SED. Finally, the SSC model generally underpredicts the UV and radio emissions. This supports our hypothesis that, at least partially, the radio and UV emission comes from regions in the jet not emitting X-rays and γ-rays.
For the type T1 and T3 states, the derived spectral indices p1 are generally consistent with p1= 2.2, i.e., the canonical particle spectral index predicted for relativistic diffuse shock acceleration (for a review, see Kirk & Duffy 1999). This
suggests that this process is active in Mrk 421. The change of the electron indexD = p2 - p1 is larger than the expectedp typical cooling breakD = 1 (Kino et al.p 2002), indicating that
the break is not induced by radiative cooling. The cooling mechanism may be less important, as suggested in Acciari et al. (2011). Abdo et al. (2011) speculated that the steep break is a
characteristic of the acceleration process which is not yet understood. The break energy Ebreak should represent the
maximum energy that can be achieved in the acceleration process, depending on the acceleration time of the particle in the shock area. Accordingly, the flares of T1 type should be mainly caused by the variation of the maximum energy of the electrons reached within the shock area. Concerning the type T3 flares (i.e., F6 and F7), these flares might be due to the increase of the magneticfield (B) or comoving particle density (ue) compared to S1.
Up to now, it is not yet clear how shocks work in a jet. If the different states detected in this work are caused by different shocks, we could expect different features of emission zones,
such as B,δ, R, electron density, and spectrum. If the different states are caused by similar shocks moving down the jet, we would expect emission zones with the same R, for all the states, as we assumed whenfitting the SED using the SSC model. In such a hypothesis, we could guess that the underlying mechanism responsible for the flares of T1 and T3 types may be due to the variation of the ambient medium. In the theory of diffusive acceleration, the acceleration timescale of particles is related to the strength of the magnetic field both in the upstream and downstream regions(Drury1983). The upstream
magnetic field could be related to the ambient medium. The variation of the acceleration timescale may change the maximum energy of the particles achieved within the shock.
When the density and the magnetic field of the ambient
medium are different, the number of particles and the corresponding maximum energy can be different. In such a hypothesis, the variability timescale for each state would characterize the size of each medium block that is crossed by the shock.
The T2 flares require a harder injected electron spectrum than the other types. This change would be caused by the acceleration processes. The slopes of F1 and F2 go beyond the predictions of a spectral index of 2.0 given by the canonical non-relativistic diffuse shock acceleration. According to Stecker et al. (2007), particle spectra with spectral indexes
less than 2 can be realized within the relativistic shock using extreme parameters, i.e., large scattering angles. F1 and F2 flares only last a few days, which means that the produced electrons with spectral index less than 2.2 is a transient state and cannot last for a long time. So, we cannot exclude the possibility that such shortflares are due to extreme parameters. Another alternative mechanism for such a hard spectrum would be that the particles accelerated by the shock are subsequently accelerated by the stochastic process in the downstream region, which is able to produce spectra that are significantly harder than the limits of thefirst-order mechanism within a short time (Virtanen & Vainio 2005). Recently, Guo et al. (2014) also
predicteda hard spectral index resulting from relativistic magnetic reconnection.
6. SUMMARY
In this paper, we have presented a 4.5year continuous multi-wavelength monitoring of Mrk 421, from 2008 August 5 to 2013 February 7, a period that includes both steady states and episodes of strongflaring activity. The observations concern a wide energy range, from radio to TeVγ-rays. In particular, due to the ARGO-YBJ and Fermi data, the entireenergy range from 100 MeV to 10 TeV is covered without any gap. These extensive data sets are essential for studying the origin of the flux variability and to investigate the underlying emission mechanism. The main results of this work can be summarized as follows.
1. Mrk 421 showed both low- and high-activity phases at all wavebands during the 4.5 year period analyzed in this work. The variability increases with energy for both the SED components. Concerning the synchrotron compo-nent, the variability amplitude increases from 21% in
radio and 33% in UV to 71%–73% in soft X-rays and
103%–137% in hard X-rays. For the inverse Compton
component, the amplitude is 39% at GeV energies and increases to 84% at TeV energies.
2. The time correlation among theflux variation in different wavebands was analyzed. The variation of the X-rayflux is clearly correlated with the TeVγ-ray flux. This result is consistent with many previous observations in the past decades, supporting the idea that the X-ray and VHE γ-ray emissions originate from the same zone. The GeV γ-ray flux appears to be moderately correlated with
the TeV γ-ray flux. This result is new compared to
previous results. The correlation is mainly due to the
large GeV γ-ray flares occurred in 2012 and a large
X-ray/TeV γ-ray flare in 2010. Taking into account the spectral shape during theseflares, we can conclude that the GeV and TeV γ-rays also originate from the same zone, at least during theseflares. On the contrary, X-ray and γ-ray fluxes are weakly or not correlated with radio and UVfluxes.
3. According to the observed light curves, 10states (2steady periods, S1 and S2, 1outburst period, OB, and 7 largeflares) have been selected and analyzed. Five flares have been identified in X-rays, and two in GeV γ-rays. The duration of the flares ranges between 3 and 58 days. X-ray and TeVγ-ray fluxes increase during all the active states. In X-rays, the flux increases by a factor 4–70 and the peak energy increases from 0.4 keV to 1.4–5.1 keV. At TeV energies, the flux has been observed to vary from 0.33 Icrabto 7 Icrab.
4. According to the behavior of GeV γ-rays, the activity states can be classified into three groups. (1) flares with no or little GeV flux and photon index variations, e.g., S1, S2, OB, F3, F4, and F5;(2) flares with γ-ray spectral hardening, irrespective of theflux variations, e.g., F1 and F2; (3) flares with flux enhancements, irrespective of spectral behavior, e.g., F6 and F7.
5. A simple one-zone SSC model is adopted tofit the multi-wavelength SED state by state. The SSC model can satisfactorily reproduce all the SED measurement except the Swift-XRT data below 0.5 keV, probably due to a detector systematics affecting the low-energy events. For type I and III states, the derived injected electron spectral indices are around 2.2, as expected from relativistic diffuse shock acceleration, indicating that this process can be active in Mrk 421. According to the derived parameters, the variation of these states may be caused by the variation of environment properties. Instead, type II flares require harder injected electron spectra, with spectral indices around 1.7–1.9. The underlying physical mechanisms responsible for this type of flares may be related to the acceleration process itself.
This work is supported in China by NSFC(No.11205165, No.11575203, No.11375210), the Chinese Ministry of Science and Technology, the Chinese Academy of Sciences, the Key Laboratory of Particle Astrophysics, CAS, and in Italy by the Istituto Nazionale di Fisica Nucleare(INFN). We are grateful to Dahai Yan and Liang Chen for their helpful suggestions that improved the paper. We also acknowledge the essential supports of W.Y. Chen, G. Yang, X.F. Yuan, C.Y. Zhao, R. Assiro, B. Biondo, S. Bricola, F. Budano, A. Corvaglia, B. D’Aquino, R. Esposito, A. Innocente, A. Mangano, E. Pastori,
C. Pinto, E. Reali, F. Taurino, and A. Zerbiniin the
installation, debugging, and maintenance of the detector of ARGO-YBJ. This research has made use of data and software