1.48 and 1.84 μm thulium emissions in monoclinic KGd(WO4)2 single
crystals
F. Güell, Jna. Gavaldà, R. Solé, M. Aguiló, F. Díaz et al.
Citation: J. Appl. Phys. 95, 919 (2004); doi: 10.1063/1.1633985 View online: http://dx.doi.org/10.1063/1.1633985
View Table of Contents: http://jap.aip.org/resource/1/JAPIAU/v95/i3 Published by the American Institute of Physics.
Related Articles
Two dimensional ferroelectric domain patterns in Yb3+ optically active LiNbO3 fabricated by direct electron beam writing
Appl. Phys. Lett. 102, 042910 (2013)
Remanent-polarization-induced enhancement of photoluminescence in Pr3+-doped lead-free ferroelectric (Bi0.5Na0.5)TiO3 ceramic
Appl. Phys. Lett. 102, 042907 (2013)
Optical identification of oxygen vacancy types in SnO2 nanocrystals Appl. Phys. Lett. 102, 031916 (2013)
Non-rare earth white emission phosphor: Ti-doped MgAl2O4 Appl. Phys. Lett. 102, 031104 (2013)
Photoluminescence properties of (Ce3+, Mn2+)-codoped CaCO3 red phosphor J. Appl. Phys. 113, 033519 (2013)
Additional information on J. Appl. Phys.
Journal Homepage: http://jap.aip.org/
Journal Information: http://jap.aip.org/about/about_the_journal Top downloads: http://jap.aip.org/features/most_downloaded Information for Authors: http://jap.aip.org/authors
1.48 and 1.84
m thulium emissions in monoclinic KGd
„
WO
4…
2single crystals
F. Gu¨ell, Jna. Gavalda`, R. Sole´, M. Aguilo´, and F. Dı´az
Fı´sica i Cristal•lografia de Materials (FiCMA), Universitat Rovira i Virgili, 43005 Tarragona, Spain M. Galan
Monocrom SL, Poligon Industrial Les Roquetes, Nau 1, 08800 Vilanova i la Geltru´, Barcelona, Spain J. Massonsa)
Fı´sica i Cristal•lografia de Materials (FiCMA), Universitat Rovira i Virgili, 43005 Tarragona, Spain
共Received 14 August 2003; accepted 27 October 2003兲
By exciting at 788 nm, we have characterized the near infrared emissions of trivalent thulium ions in monoclinic KGd(WO4)2 single crystals at 1.48 and 1.84 m as a function of dopant
concentration from 0.1% to 10% and temperature from 10 K to room temperature. We used the reciprocity method to calculate the maximum emission cross-section of 3.0⫻10⫺20cm2 at 1.838
m for the polarization parallel to the Nmprincipal optical direction. These results agrees well with the experimental data. Experimental decay times of the3H4→3F4 and3F4→3H6 transitions have
been measured as a function of thulium concentration. © 2004 American Institute of Physics.
关DOI: 10.1063/1.1633985兴
I. INTRODUCTION
KGd(WO4)2 single crystals 共hereafter KGW兲 are very
attractive materials as laser hosts. Their monoclinic structure provides an appreciable optical anisotropy suitable for ob-taining polarized laser radiation. They are easily grown and Gd3⫹can be efficiently substituted by Tm3⫹ ions.1Thulium lasers are sources of light in the near infrared region, around 1.5m, on the3H4→3F4transition, which is very interesting
for telecommunications purposes, and around 1.8m, on the
3F
4→3H6 transition, which is used in remote sensing of the
atmosphere共LIDAR devices兲 and in developing medical la-ser technologies. Interest in thulium-doped crystals is moti-vated by progress in powerful, well-developed AlGaAs laser diodes, which are well suited for optical pumping at around 800 nm into the3H4 energy level of thulium ions.
The 1.5 m transition takes place between the3H4 and
the 3F
4 excited energy levels of thulium. This transition is
self-terminating because the lifetime of the3F4terminal level
is longer than that of the3H4 emitting level.2,3This creates a
detrimental bottlenecking effect because it is difficult to achieve the population inversion between the 3H
4 and 3F4
states without depopulating the lower state. On the other hand, this transition has two competitive transitions, the
3H
4→3H6transition, around 800 nm, and the3H4→3H5
tran-sition, around 2.3 m. Both situations are complicating the realization of a highly efficient optical amplification at 1.5
m. In 1983, Antipenko et al.4 demonstrated for the first time laser oscillations from the 3H4→3F4 transition in
BaYb2F8 and LiYbF4 single crystals.
The 1.8m transition occurs between the lowest excited state 3F4 and the ground state3H6 of thulium ions. The first
report of continuous wave room temperature 共hereafter RT兲 laser operation of the3F4→3H6 transition of Tm3⫹, pumped
by 785 nm laser diode, was in YAG by Kintz et al.5in 1988. However, the narrow absorption band of thulium in YAG
共and YLF兲 made diode pumping difficult. This laser
opera-tion was also achieved in monoclinic tungstates, in two sen-sitized compounds KY(WO4)2:Er3⫹, Tm3⫹ and
KGW:Er3⫹, Yb3⫹, Tm3⫹ single crystals at 1.92 and 1.93
m, respectively, by Kaminskii et al.6 in 1997 at cryogenic temperatures 共110 K兲, and in thulium-doped KY(WO4)2 single crystals at 1.95m, by Bagaev et al.7in 2000 at RT. They found that the thulium concentration must be high enough to ensure efficient pumping, but low enough to mini-mize concentration quenching effects due to cross-relaxation type (3H4⫹3H6→3F4⫹3F4) and nonradiative energy
trans-fer between active ions.
Thulium ions present another near infrared emission around 2.3 m, on the3H4→3H5 transition, for which laser
action has already been achieved.8This wavelength has ap-plications in gas detection, medicine and remote sensing.
In this paper, we have characterized the near infrared emissions at 1.48 and 1.84 m of thulium-doped KGW single crystals by pumping at 788 nm. We analyzed lumines-cence as a function of thulium concentration and tempera-ture. The reciprocity method has been used to calculate the 1.84 m emission section from the absorption cross-section and compared with the experimental results. The de-cay times corresponding to the emitting levels 3H4 and3F4
were measured at several thulium concentrations. II. EXPERIMENTAL
The single crystals were grown by the top-seeded-solution growth 共TSSG兲 slow-cooling technique.9 Electron probe micro analysis共EPMA兲 results showed that the dopant concentrations of the samples were 6.9⫻1019, 16.1⫻1019,
a兲Author to whom correspondence should be addressed. Electronic mail: [email protected]
919
25.7⫻1019, 37.8⫻1019, and 55.0⫻1019at/cm3, which corre-spond to molar percentages of Tm2O3 substituting Gd2O3 in
the solution of 1%, 3%, 5%, 7.5%, and 10%, respectively. We also obtained single crystals with 0.1% but the detection limit of EPMA is above this concentration.
For the absorption and emission experiments, the sample was a prism of KGd0.974Tm0.026(WO4)2 with a thulium
con-centration of 16.1⫻1019 at/cm3共3% in the solution兲, because this provided enough signal-to-noise ratio without saturating the detector. We cut and polished the prism with the faces perpendicular to the three principal optical directions, to a thickness of 1.11 mm for the Np and Nm, and 1.47 mm for the Ng. Optical absorption spectra were measured with a VARIAN CARY-5E-UV-VIS-NIR 500Scan Spectrophotom-eter. Emission spectra were obtained with an Optical Para-metrical Oscillator, VEGA 100, pumped by the third har-monic of a Q-switched YAG:Nd laser 共pulse duration: 7 ns, repetition rate: 10 Hz兲, SAGA 120, from B.M. Industries. Fluorescence was dispersed through a HR460 Jobin Yvon-Spex monochromator 共focal length: 460 mm, f/5.3, spectral resolution: 0.05 nm兲. The gratings used were a 600 grooves/mm grating blazed at 1 m and a 300 grooves/mm grating blazed at 2 m. The detectors applied were Hamamatsu: R5509-72 NIR photomultiplier, G5832-03 In-GaAs PIN photodiode, and a P5968-100 InSb photovoltaic. These were connected to a Perkin Elmer 7265DSP lock-in amplifier. Lifetime measurements were taken at various thu-lium concentrations. Time decay curves were recorded using a Tektronix TDS-714 digital oscilloscope. For low tempera-ture emission measurements, the samples were mounted into a closed cycle helium cryostat OXFORD CCC1104. III. LUMINESCENCE RESULTS
For the luminescence studies, we recorded excitation spectra monitoring 1.48 m while exciting the 3H4 energy
level between 760 and 820 nm. The maximum emission in-tensity was obtained by pumping at 788 nm. At this pump wavelength, the electronic population was excited from the ground state3H6to the3H4energy level, as illustrated in Fig.
1. The3H4energy level relaxes to the three lower states3H6, 3F
4 and3H5, generating the 801 nm, 1.48 m and 2.3 m
emissions, respectively. The 3H5 energy level is rapidly
de-populated by multiphonon processes to the 3F4 state, which
radiatively decays to the 3H6 ground state, generating the
1.84 m emission. We observed no radiative emission from the 3H
5 energy level. The3F4 energy level is also populated
via cross-relaxation mechanisms through the phonon-assisted self-quenching process10 3H4⫹3H6→3F4⫹3F4 共see Fig. 1兲. The effectivity of this quenching process increases with higher thulium concentrations. Note that we have two steady-state population inversions on the 3H4→3F4 and3F4
→3H
6 transitions.
We found that the intensity of these emissions was strongly affected by the concentration of thulium. Maximum emission intensity was in samples containing 3% thulium. The increase in emission intensity due to increases in the thulium concentration was limited by quenching phenomena. Figure 2 shows the RT emission spectra for a 3% sample of the 1.48 and 1.84 m emissions, corresponding to the 3H4
→3F
4 and3F4→3H6 transitions, respectively, after pumping
at 788 nm. At thulium concentrations from 1% to 10%, the 1.84 m emission intensity was stronger than the 1.48 m emission intensity, while at 0.1% it is the opposite. This can be explained because of the 3F4 state is highly affected by
cross-relaxation mechanisms (3H4⫹3H6→3F4⫹3F4), which
favored the3F4→3H6 transition.
Moreover, we analyzed the evolution with temperature of these emission channels. From the low temperature spec-tra we corroborated the corresponding energies of the Stark sublevels of the 3F
4 and 3H6 states obtained in previous
studies.11,12 Figure 3 shows the temperature dependency of the 1.48m emission spectrum from 10 K to RT. We labeled the n Stark levels, increasing from 0 to n in energy, n
⬘
for the upper level and n for the lower level. At 10 K the spectrum shows eight peaks at 1.440, 1.450, 1.452, 1.457, 1.482, 1.500, 1.502 and 1.508 m, which correspond to the elec-tronic transitions 3H4(0⬘
)→3F4(0), 3H4(0⬘
)→3F4(1), 3H4(0
⬘
)→3F4(2), 3H4(0⬘
)→3F4(3), 3H4(0⬘
)→3F4(4), 3H4(0
⬘
)→3F4(5), 3H4(0⬘
)→3F4(6) and3H4(0⬘
)→3F4(8),respectively. The emission peak between 3H4(0
⬘
)→3F4(7)overlaps the 3H4(0
⬘
)→3F4(6) transition and is located at1.504 m. We observed that the emission intensities
de-FIG. 1. Partial energy level diagram of Tm3⫹-doped KGW single crystals.
FIG. 2. Room temperature near infrared emissions spectrum of a 3% thulium-doped KGW sample by exciting at 788 nm.
creased when the temperature increased. This is due to the thermal population of the sublevels, so at 100 K some new peaks appeared that corresponded to the electronic transi-tions 3H4(9
⬘
)→3F4(1), 3H4(7⬘
)→3F4(0), 3H4(7⬘
)→3F
4(1), 3H4(4
⬘
)→3F4(2), 3H4(7⬘
)→3F4(6) and 3H4(4
⬘
)→3F4(7), which were located at 1.393, 1.404,1.413, 1.425, 1.463 and 1.476m, respectively. In Fig. 4 we present the temperature evolution from 10 K to RT of the 1.84 m emission. We observed five peaks at 1.770, 1.791, 1.808, 1.842 and 1.869m at 10 K, which correspond to the electronic transitions 3F 4(0
⬘
)→3H6(0), 3F4(0⬘
)→3H6(1), 3F 4(0⬘
)→ 3H 6(3), 3F 4(0⬘
)→ 3H 6(7) and 3F 4(0⬘
)→ 3H 6(9),respectively. These Stark sublevels of the ground state 3H6 are located at 0, 69, 119, 223 and 300 cm⫺1, respectively. The thermal behavior of the 1.84 m emission is similar to that of the 1.48m emission. At 100 K new peaks appeared at 1.684, 1.718, 1.744, 1.753 and 1.781 m, corresponding to the 3F4(6
⬘
)→3H6(0), 3F4(6⬘
)→3H6(3), 3F4(3⬘
)→3H
6(0), 3F4(2
⬘
)→3H6(0) and 3F4(5⬘
)→3H6(10)transi-tions, respectively.
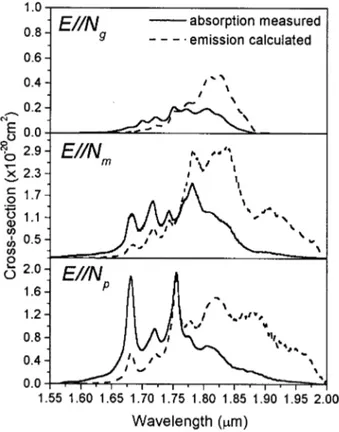
To quantify the 1.84m emission, we used the reciproc-ity method共RM兲13to determine the emission cross-section of the3F4→3H6transition. The emission cross-section (em) is calculated from the absorption cross-section (abs) and the splitting of the energy levels using the following equation:
em共兲⫽abs共兲 Zl Zu exp
冋
共EZL⫺h兲 kBT册
, 共1兲where Zl and Zu are the partition functions, and Ezl is the zero-line or energy separation between the lowest energy sublevels of the ground state 共lower兲 and the first excited state 共upper兲, respectively. The partition functions are calcu-lated from Z⫽
兺
k dkexp冋
⫺Ek kBT册
, 共2兲where dk and the Ek are the degeneracies and the energies, respectively, of each sublevel of the upper and lower energy levels involved. In our case the ratio Zl/Zuwas 1.21 and Ezl was 5651 cm⫺1. Figure 5 shows the calculated emission and experimental absorption cross-section for the three polariza-tions of the 3F
4→3H6 transition at RT in the 1.55–2.00 m
range. The maximum emission cross-sections are 3.0
⫻10⫺20cm2 for the polarization parallel to the N
mprincipal optical direction at 1.838 m and 1.9⫻10⫺20cm2 for the polarization parallel to the Np principal optical direction at 1.756m. Figure 5 shows that these spectra exhibit the char-acteristic optical anisotropy of the host KGW, where the spectrum for the E储Nm polarization is the most intense re-sulting in the highest possibility to obtain polarized stimu-lated emission. Figure 6 compares the experimental unpolar-ized 1.84 m emission at RT with the spectrum calculated with the reciprocity method, taking into account the
unpolar-FIG. 3. Temperature evolution of the 1.48m emission of thulium in KGW.
ized absorption spectrum at RT. We rescaled the experimen-tal spectrum to match the calculated spectra and compare its shape. There is good agreement between them, but the peak that appears in the calculated emission spectrum around 1.9
m was not found experimentally. It was produced by the numerical method that amplifies the absorption spectrum at long wavelengths. These absorption and emission cross-section spectra will be useful for designing and modeling CW and pulsed lasers. In Table I we report a bibliographic study and our results of the emission cross-section of the
3F
4→3H6 thulium transition obtained in other hosts. As can
be seen in Table I, the emission cross-section of thulium in KGW is higher than in the other crystals.
The 3F4→3H6 transition corresponds to a
quasi-three-level laser scheme in which the lower quasi-three-level is thermally populated at RT. This results in considerable reabsorption and an increased threshold for laser operation. Reducing re-absorption and maintaining efficient re-absorption of the pump light is one of the key issues in the design of thulium-doped laser systems on this transition. The reabsorption processes of the 1.84m emission by resonant transitions occurs when absorption and emission overlapping is important. As a first approximation, the threshold for light amplification is achieved when the emitted light counterbalances the absorp-tion losses. If is the population inversion rate, this condi-tion can be described as gain⫽•em⫺(1⫺)•abs, wheregainis the effective emission cross-section. Figures 7 and 8 show this condition for E储Nmand E储Nppolarizations in the 1.55–2.0 m spectral region for the3F
4→3H6
transi-tion. The population inversion rate needed to achieve ampli-fication is expected to be higher than 0.05. For a population inversion level of 0.2, the gain is produced in the 1.85–2.0
m region. The higher energy limit of this interval increased when the population inversion level was increased, reaching up to 1.75 m for a population inversion level of 0.5. For this level the maximum gain cross-section value was 1.06
⫻10⫺20cm2 at 1.84m for E储N
m and 0.53⫻10⫺20cm2 at
FIG. 5. Calculated emission cross-section at RT for the three polarizations of the3F
4→ 3H
6transition by the reciprocity method.
FIG. 6. Comparison of the unpolarized emission cross-section calculated by the reciprocity method and the experimental emission spectrum obtained at RT of the3F
4→3H6transition.
TABLE I. Summary of some published values of the3F 4→
3H
6 emission
cross-section and radiative lifetime of the3F
4state in different hosts.
Host:关Tm3⫹兴 em(⫻10⫺20cm2) (3F4(s)) Reference KGd(WO4)2:Tm共3%兲 3.0 1760 KY(WO4)2:Tm共15%兲 1.90 1470 7 YVO4:Tm共5%兲 1.60 800 15 YAlO3:Tm共6%兲 0.50 12000 16 KY3F10:Tm共1%兲 0.40 15400 17 SrGdGa3O7:Tm共3%兲 0.39 4700 18 LiYF4:Tm共1%兲 0.33 13000 19 LaF3:Tm共0.1%兲 0.25 11000 19 Y3Al5O12:Tm共1%兲 0.22 8500 19
FIG. 7. Gain cross-section of the 1.84m emission at RT for the E储Nm polarization at several inversion population rates.
1.88 m for E储Np. At this point we expect to find light amplification in future laser experiments for this emission.
Finally, we investigated the fluorescence dynamics of the
3H
4 and3F4emitting levels as a function of thulium
concen-tration ranging from 0.1% to 10%. The experimental lifetime of the3H4state decreased strongly as the thulium
concentra-tion increased 共see Table II兲. This is explained by the very efficient energy transfer mechanisms between thulium ions. At higher thulium concentrations the quenching phenomenon takes place because the Tm–Tm distances decrease. In con-trast to the 3H4 relaxation, the decay times of the transition
from the 3F4 level were constant for all thulium
concentra-tions共see Table II兲. The fact that the lifetime of the3F4state
does not depend on the concentration of thulium is due to two different mechanisms. The first one is the reabsorption effect, or the so-called self-trapping14 process between 3F
4
→3H
6 resonant transitions that produces radiative energy
transfer between thulium ions, and the second is a repopula-tion of the emitting level via the 3H4⫹3H6→3F4⫹3F4 self-quenching cross-relaxation mechanism. This transfer is phonon-assisted since the energy gaps 3H4→3F4 ⫽6629 cm⫺1 and3F
4→3H6⫽5963 cm⫺1 are slightly
differ-ent. The lifetime of the3F4 state is of the order of
millisec-onds because it is depopulated to the ground state 3H6 by
predominantly radiative decay. So the3F4state is the storage
reservoir and is interesting for laser operation because of its long lifetime. On the other hand, for the 1.48m transition, the lifetime of the3F4terminal level is higher than that of the
initial level. Such a long lifetime compared to that of the3H4
level makes the3H4→3F4 transition self-terminating.
IV. CONCLUSIONS
In conclusion, we studied the emission spectra for the 1.48 and 1.84 m near infrared emissions pumping at 788 nm. From the polarized RT optical absorption measurements we calculated the stimulated emission cross-section using the reciprocity method. The maximum emission cross-sections are 3.0⫻10⫺20cm2 at 1.838 m and 1.9⫻10⫺20cm2 at 1.756 m for the polarization parallel to the Nm and Np principal optical directions, respectively. We were therefore able to calculate the optical gain for several population in-version rates and determine the spectral region in which light amplification is possible for future laser experiments using this material for infrared emissions. From the gain versus wavelength, we found a tunability range of more than 300 nm for the3F4→3H6transition. The very long lifetime of the 3F
4 energy level of thulium in KGW shows that easy
popu-lation inversion is expected. This is needed for generating laser radiation. Our promising results encourage us to con-tinue our research into the laser action of thulium in KGW for the 1.84m emission.
ACKNOWLEDGMENTS
We gratefully acknowledge financial support from ClCyT under Project Nos. MAT2002-04603-C05-03, FiT-070000-2001-477 and FiT-070000-2002-461, and from CIRIT under Project No. 2001SGR00317. We also acknowl-edge financial support from MONOCROM S. L.
1M. C. Pujol, R. Sole´, J. Gavalda`, M. Aguilo´, F. Dı´az, V. Nikolov, and C. Zaldo, J. Mater. Res. 14, 3739共1999兲.
2R. C. Stoneman and L. Esterowitz, Opt. Lett. 16„4…, 232 共1991兲. 3
E. R. Taylor, L. N. Ng, N. P. Sessions, and H. Buerger, J. Appl. Phys. 92,
112共2002兲.
4B. M. Antipenko, A. A. Mak, O. B. Raba, K. B. Seiranyan, and T. V. Uvarova, Sov. J. Quantum Electron. 13„4…, 558 共1983兲.
5G. J. Kintz, R. Allen, and L. Esterowitz. Technical Digest, CLEO’88, OSA paper FB-2共1988兲.
6A. A. Kaminskii, L. Li, A. V. Butashin, V. S. Mironov, A. A. Pavlyuk, S. N. Bagayev, and K. Ueda, Jpn. J. Appl. Phys., Part 2 36, L109共1997兲. 7S. N. Bagaev, S. M. Vatnik, A. P. Maiorov, A. A. Pavlyuk, and D. V.
Plakushchev, Quantum Electron. 30„4…, 310 共2000兲. 8
V. Sudesh and J. A. Piper, IEEE J. Quantum Electron. 36, 879共2000兲. 9M. C. Pujol, M. Aguilo´, F. Dı´az, and C. Zaldo, Opt. Mater.共Amsterdam,
Neth.兲 13, 33 共1999兲.
10A. Brenier, C. Pedrini, B. Moine, J. L. Adam, and C. Pledei, Phys. Rev. B
41, 5364共1990兲.
11F. Gu¨ell, X. Mateos, J. Gavalda`, R. Sole´, M. Aguilo´, F. Dı´az, M. Galan, and J. Massons. Opt. Mat.共accepted兲.
12F. Gu¨ell, X. Mateos, R. Sole´, J. Gavalda`, M. Aguilo´, F. Dı´az, and J. Massons. J. Lumin.共accepted兲.
13
D. E. McCumber, Phys. Rev. 136, A954共1964兲.
14L. Laversenne, C. Goutaudier, Y. Guyot, M. T. Cohen-Adad, and G. Bou-lon, J. Alloys Compd. 341, 214共2002兲.
15K. Ohta, H. Saito, and M. Obara, J. Appl. Phys. 73, 3149共1992兲. 16
G. Rustad and K. Stenersen, IEEE J. Quantum Electron. 32, 1645共1996兲. 17A. Braud, P. Y. Tigreat, J. L. Doualan, and R. Moncorge´, Appl. Phys. B:
Lasers Opt. 72, 909共2001兲.
18W. Ryba-Romanowski, S. Golab, I. Sokolska, G. Dominiak Dzik, J. Zawadzka, M. Berkowski, J. Fink Finowicki, and M. Baba, Appl. Phys. B: Lasers Opt. 68, 199共1999兲.
19S. A. Payne, L. L. Chase, L. K. Smith, W. L. Kway, and W. F. Krupke, IEEE J. Quantum Electron. 28, 2619共1992兲.
FIG. 8. Gain cross-section of the 1.84 m emission at RT for the E储Np polarization at several inversion population rates.
TABLE II. Experimental decay times of the3H4and 3
F4energy levels of
Tm3⫹ in KGW single crystals as a function of thulium concentration 关Tm3⫹兴.
关Tm3⫹兴 0.1% 1% 3% 5% 7.5% 10%
(3H
4(s)) 242 175 94 41 20 8