i
Common factors and balance sheet structure
of major European banks
ANTONIO ROMA
1. Introduction
This paper explores the relationship between listed European banks' fundamental characteristics and the riskiness of their stock returns. In financial theory, the risk associated with stock returns is measured by the covariance, or more specifically a
factor loading,
on some funda-mental variable(s) affecting the return on all stocks in a systematic way.! I investigate whether the size of these factor loadings, and there-fore the stock riskiness, may be generated by specific fundamental characteristics of the listed bank.I measure the structural characteristics of banks through a num-ber of different balance sheet indicators and try to associate them to the stock riskiness, as measured by the factor loadings on specific fun-damental factors affecting the stock market at large. I specify and fit a factor model for banks' stock returns, and estimate factor loadings on common factors. The aim is to verify, through a cross-section analysis, whether any balance sheet characteristic of the banks examined may account for the size of their factor loading on specific fundamental common factors. I am not concerned with the analysis of banks'
fun-D Università degli Studi di Siena, fun-Dipartimento di Economia Politica, Siena (Italy) and London Business School, London (Great Britain); e-mai!: roma@unisi.it.
l Univariate models, like the CAPM, or multivariate models, see section 3.
124 BNL Quarterly Review
darnental balance sheet characteristics per se2 but only insofar as they
rnay contribute to explain the riskiness of stock returns and rnay pro-vide guidance for assessing stock trading strategies. Following an op-tion-based theory of banking activity (Merton 1974, 1977 and 1978), I expect the factor loadings of a bank's stock on its assets to vary in a systernatic way according to business conditions. In particular, 'weak-er' banks should becorne more risky in a recession. In this light, it is interesting to exarnine the cross-section of banks' factor loadings esti-rnated during a recession. I argue that the fundarnental factors that are best suited to such analysis are the fundarnental rnacroeconornic fac-tors proposed by Chen, Roll and Ross (1986), especially the terrn spread, default spread and rnarket index, which rnay direct1y proxy for . the value of banks' assets.
A larger body of literature exists on the connection between the structuralcharacteristics and rnarket value of US banks than for Euro-pean banks.
A first strearn focuses on the effects of diversification of banks' sources of incorne. Rogers and Sinkey (1999) exarnine the balance sheets of US banks which earn substantial non-interest incorne and find that they are generally the larger and safer banks with low interest rnargin. Brewer, Jackson and Mondschean (1996) study the effect of the diversification of US Savings and Loan associations into different types of loans and rnortgages on stock return volatility and find that, for specialized financial institutions, stock return volatility decreases with investrnent diversification. For European banks, Vennet (2002) also presents the view that 'universal' banks that diversify their in-come are less risky, in that they have a lower factor loading on a single risk factor: the rnarket index.
Other papers study the effect of individuaI balance sheet charac-teristics on stock returns. Flannery andJarnes (1984) find that the bank stocks' well docurnented3 sensitivity to unanticipated changes in inter-est rates (proxied by holding period returns on short terrn bonds) rnay be related to the banks' reported gap between short terrn assets and li a-bilities.
2 For example, an interesting paper by Cebenoyan and Strahan (2004) finds
regu-larities between European banks' pattern of loan trading and their capitalization ra-tios, without implications for stock returns.
Common faetors and balanee sheet strueture of major European banks 125
As far as bank loan loss reserves are concerned, some evidence exists that unexpected increases in banks loan loss reserves may have positive implications for bank stock prices (see Whalen 1994), and that in specific circumstances (loans to Less Developed Countries) provi
-sioning by one bank may have contagion effects on other banks (Grammatikos and Saunders 1990, Docking, Hirschey andJones 1997).
Brewer, Jackson and Moser (1996) investigate the relationship between the volatility of returns and fundamental variables for stocks of 99 US Savings and Loan associations, for the period 1985:3-1989:4. They find the volatility to be significantly related to financial institutions' lever-age, the maturity gap of the fixed income portfolio, liquidity, ratio of operating expenses to total income, as well as to derivative instruments activity.
Recent papers take into consideration the multivariate dimen-sion of stock market risk. Cooper, Jackson and Patterson (2003, here-after CJP) examine the risk-return characteristics of portfolios of US bank stocks sorted according to individuaI banks' fundamental vari-ables, including loan loss reserves and leverage. They conclude that sorting portfolios of bank stocks according to changes in single funda-mental variables like earnings per share, non interest income and lever-age, produces extra returns without any increase in risk. They test for the risk involved in the sorted portfolios by adopting a linear multi-factor model of the Fama and French (1992) type.
The present analysis is in the spiri t of CJP in that I use banks' characteristics in order to construct portfolios that are sorted accord-ingly. I conjecture that certain balance sheet features may indicate the ownership of riskier assets and therefore translate into higher factor loadings of the corresponding portfolio, also according to an option-based model of the banks' activity (Merton1978). I also try to relate the banks' different characteristics to different risk factors, i.e. exarnine whether banks with different characteristics are subject to significantly different types of risk. This analysis can be attempted in the context of a multi-factor framework, in which different activities carried out by banks contribute to different dimensions of risk, which we assess sepa-rately. Some of these risks may map well imo financial and macroeco-nornic variables.
The idea is that different bank activities are subject to different risk factors, and I argue that a 'macroeconomic' (to follow the defini-tion of Connor 1995) linear factor model along the lines of Chen Roll
126 BNL Quarterly Review
and Ross (1986, hereafter CRR) is more appropriate to examine the risk characteristics of bank stocks. This is because some CRR-type fac-tors, such as term and default spreads, map direct1y into the banks' sources of income.
The pIan of the paper is as follows: in section 2 I highIight theo-reticai arguments providing some guidance on the riskiness of different banks. In section 3 I first specify and estimate a multi-factor modei for the banking industry sector. In section 4 I estimate the same modei for individuaI banks. I adopt both a simpie and a more articuiate specifica -tion. I then carry out, in section 5, a preliminary cross-section anaIysis of the correiation between estimated factor Ioadings and banks' funda-mentai characteristics. In section 6 I sort banks into portfolios accord-ing to univariate fundamentai characteristics, and formally test whether the sorted portfolios have significantly different factor Ioadings on the CRR factors. Section 7 concludes the papero
2. Basic theory
The basic business of a bank, from the balance sheet point of view, may be characterized as the issue of unIimited Iiability riskIess debt in order to invest in risky assets.4 In order to be abie to repay the riskIess Iiabili-ties (deposits), a bank must aiso invest in an implicit put option on the risky assets, so that the nominaI value of deposits can aIways be recav-ered. This is because, as pointed out by Merton (1974, 1977 and 1978), a riskIess debt can be broken down into the sum of a risky debt and a put
4 A number of mechanisms are in pIace in order to guarantee the absence of risk for depositors, and prevent moral hazard that would lead bankers to gamble deposi
-tors' money in a ruthless way. OECD banks must maintain minimum capitaI require-ments (so-called Basle requirerequire-ments) and reserve ratios on deposits, which limit the amount of leverage that individuaI banks may achieve. In many countries, partial in-surance on deposits is provided by government or banking industry agencies. Also, in the norma! course of their business, banks set aside a portion of their operative earn-ings as provisions against the default of some of their assets. Given that banks make a positive spread between lending and deposit rates, the present value of which is lost in the event of default, an incentive may arise not to destroy goodwill by over leveraging. In order to maintain sound reserves against bad assets, banks generally set aside as pro-visions for future losses a portion of operative earnings exceeding what is considered tax deductible in their jurisdiction, in order not to eat into regulatory capitaI in case of loan losses.
i
Common facrors and balance sheet structure of major European banks 127
option on the assets backing the risky debt. In such a stylized characteri-zation, a bank can purchase the put option from a third party (e.g. a government agency as in the case of the United States FDIC) in order to partially or completely cover the value of outstanding deposits. An alter-native route is to set aside enough reserves to equal the value of the put option. In this sense, the level of reserves against bad loans maintained by banks through the management of loan loss reserves may be viewed as the premium paid to offer their borrowers a put option on their as-sets. Should a risky loan default, the bank will absorb the loss through the loan loss reserves and keep depositors insulated from the loss.
If
banks' reserves against loan losses are indeed maintained at the correct level implied by the 'put option theory', basic option pricing principles will imply, other things being equal, that the correct level of banks' reserves should be a monotonically decreasing function of the value of the assets, and a monotonically increasing function of the riski-ness of banks' assets, i.e. of the volatility of the assets. Banks which hold the more volatile assets should maintain, over time, a higher level of re-serves against loan losses per unit of investment.5 However, the same theory will also yield implications for the value of banks' equity, i.e. the market value of banks' stock. Merton (1978) fully spells out the symmet-ric implications for the value of a bank's equity as a function of the val-ue and 'quality' (volatility) of the assets in which the bank has invested. One interesting implication is that, in fact, the value of a bank's stock is a non linear function of the value of its assets. When the value of the risky assets a bank has invested in goes sufficiently low while the bank is stilI in operation, even if the bank maintains appropriate reserves, the value of the levered equity (the value of the assets plus the value of the put option minus the nominaI value of deposits) of a bank holding riski-er assets will move more, as a function of the undriski-erlying assets, than the value of a safer bank. In other words, in the case of a bank with more volatile assets the factor loading on the value of the underlying assets will be higher when banks approach the bankruptcy boundary.Such a pure theory may be difficult to test directly due to the un-observability of the prices and volatilities of banks' assets, as discussed
5 li the risky assets against which insurance is sought are tradable, standard op-tion pricing methods could be used to asses the correct Ievei of these reserves. Bank as-sets are not fully tradable, although tranches of Iarge bank Ioans often are, and it is in generaI not possible to evaluate the true riskiness of an individuaI bank's portfolio of Ioans in detail fròm the olltside.
128 BNL Quarterly Review
in the next section. I cannot test whether banks' reserves are continu-ously maintained to mimic the value of a put option on ~he banks' as-sets.
If
they were, a testable implication would be that, if we consider sample periods around a market crash and/or deep economic reces-sion, when banks are more likely to go bankrupt, the stocks of 'riskier banks' should have a higher factor loading on the value of the assets they invested in. This is evident from equation 14 for the value ofbank equity in Merton (1978), for example.
From an empirical perspective, we may adopt the assumption that higher loan loss reserves are at least one of the parameters of a riskier bank. Financial analysis of bank stocks usually adopts a few in-dexes derived from balance sheet data to summarize the quality of a bank and its resilience to adverse business conditions. Generally speak-ing, a high capitaI base and high operational efficiency denote a less risky bank. At the same time, the relative composition of revenues (in-terest in come versus non-in(in-terest income) may indicate a bank more geared towards interest rate or securities market risk. In traditional analysis, abundant loan loss reserves per unit loan, being a 'coverage indicator', may be associated with a less risky bank. However, from the e1ements of bank valuation theory just recalled, this last conclusion is not automatically warranted, and we may instead expect a positive association between higher loan loss reserves and bank stock riskiness. Moreover, the different characteristics of a riskier bank may be corre-lated, and therefore should aH be taken into consideration. In broad terms, we would expect reserves and provisions against loan losses to
be positive1y related to factor loadings for the reasons just mentioned, Oow) efficiency indicators to also be positively re1ated to factor load-ings, and capitaI adequacy to be negatively related to factor loadings. Different types of revenues may be positively or negative1y related to factor loadings. I attempt be10w to highlight empirical regularities in the riskiness of bank stocks.
3. Determinants of bank sector stock returns
My aim is to test whether there is an association between banks' differ-ent balance sheet structures and their factor loadings on macroeco-nomic factors. From the preceding discussion, we also have a theory
Common faecors and balanee sheet strueture of m.jor European banks 129
predicting that, in bad times, the value of the equity of banks that have invested in more risky assets will be more sensitive to the change in value of the assets. To test this hypothesis we would need to observe the value and quality of the banks' assets. Unfortunately, as already mentioned, it is not really possible to direct1y observe whether a bank holds assets that are riskier than those held by another bank. Howev-er, if we hypothesise that banks that hold larger reserves against bad loans do own more risky loans, i.e. loans whose value is more volatile, in bad times (when the value of assets is very low) the equity of these banks should consequent1y have a higher factor loading against the val-ue of the underlying assets. This effect should be even more pro-nounced if reserves are under dimensioned. Given that we cannot ob-serve the change in value of the exact portfolio of assets held by indi-viduaI banks, the value of these assets can only be proxied by one or more market indicators. I choose to proxy the value of assets by many different indicators. This results in a multi-factor model for the value of banks' equity, where the independent variables may also be inter-preted as proxies for the value of banks' assets. The variation in banks' equity (the difference between assets and liabilities) arises to a large ex-tent from the default risk of risky loans, term structure risk, stock market risk and the generallevel of economic activity. But these are precisely the CRR factors. In other words, the reference portfolio of banks' assets is unobservable and we can only proxy it by market in-dexes and fundamental variables.6 More specifically, in CRR variation in stock prices is explained by real economic growth (as far as the real component is concerned) and by inflation, as well as by variables that affect the state of the economy, such as the oil price. Key explanatory variables are also
z)
variation in the market return,il)
variation in the default premium andiii)
variation in the term premium. However, in the case of banks, not only the stock price, but also the value of their assets will be a direct function of the factorsi),
ù) and iii) and, to a less-er extent, a function of real production and inflation.7 Banks assets and6 This is akin to the well-known problem of the impossibility of observing the market portfolio in tests of the CAPM, but far less serious in that we know the com-position of banks' balance sheet by asset class; we just do not have information about individualloans.
7 AIso, in addition to exerting a generai influence on ali stock valuations, the market factor may directly impact banks profitability through the commission in· come. The commissions that banks earn for their asse t management/ administration services will be a -function of market trends, as in declining markets asset management
130 BNL Quarterly Review
equity are obviously directly subject to default risk and term structure risk, as they issue liabilities with certain values (riskless deposits) to in-vest in risky credits and in generaI fixed income assets with longer ma-turity. The market factor, in addition to exerting a generaI influence on all stock valuations, may directly impact banks' profitability through the commission income earned on asset management services. However, given the nature of banks' assets, finding suitable proxies is straightforward. The fundamental factors proposed by CRR will proxy for the dynamics of banks' assets and will explain the behaviour of banks' stock exactly because they mimic the value of banks' assets. Following the theory summarised in section 2, some systematic cross-section differences in estimated CRR factor loadings should emerge during economi c and market recessions.
The CRR macro-factor specification has been subject to consid-erable debate, especially when contrasted to the Fama and French (1992) interpretation of fundamental factors as the return on portfolios mimicking firms' characteristics. The Fama and French approach, which explains stock returns with the return on specially selected port-folios of stocks, typically delivers a superior statistical fit. This may render CRR factors redundant when associated with Fama and French factors (He and Ng 1994). Flannery and Protopapadakis (2002) provid-ed evidence that the effects of macroeconomic variables on stock prices may be reliably detected using a heteroscedastic specification of the CRR-type factor model applied to daily stock market data. In my em-pirical application, I seek to explore the determinants of returns on bank stocks. As I have argued, CRR-type factors are definitely more appropriate as they effectively capture the key fundamental determi-nants of banks' activity and valuation.8
If CRR factors proxy for the value of the banks' assets, when we estimate a linear factor model on banks' stock returns we may gain some insight into the relationship between the value of banks' assets and the value of their equity. This relationship may not be constant or linear, as highlighted in section 2.9
services will be less apfealing to bank customers (although structured products embed-ding different forms o risk protection may be sold in bear markets).
8 Fama and French (1992, p. 429) specifically exclude financial firms from their factors as they are not well suited for their mode!.
9 It is dear in my analysis that a formai test that banks with riskier assets have higher factor loadings in bad times is also a test of the joint hypothesis that high re-serves for unit loan signal riskier assets.
"
Common factors and balanee sheet structure of major European banks 131
3.1. Stock return model
I consider a CRR-type stock return model, incorporating heteroscedas-ticity along the lines of Flannery and Protopapadakis (2002). In the model, the stock return depends on common systematic factors and on macroeconomic news which is released only on specific dates. More-over, given that daily stock return data are used, day of the week dum
-my variables are also included. The stock specific error in the equation describing returns is considered to be heteroscedastic. Its variance de-pends on past values, on the macroeconomic news periodically re-leased and on the day of the week. Formally we have:
K M 4
rit = ai
+
L
~fFkt
+
LOkDMkt+
L"{kDkt+
Ut, (1)k-l k-l k-l
M 4
h~ = h6
+
aU~_l+
~h~_l+
L
.:lkDMkt+
L
rkDkt· (3)k-l k-l
In the model rit denotes return on day t on the ith stock (or portfolio of
stocks) which is determined by a number of (ideally uncorrelated) fac-tors
(Fk,).
One of the common factorsFk
may be the return on the mar-ket as a whole. However, we assume (and test) that additional factors may explain stock returns. There is an extensive body of literature on the nature of the additional factorsFk
(see
Connor 1995 for a synthetic treatment).10 Following CRR, I use the term spread (TERMSPRE), the default spread (DEFSPRE), the percentage variation in oil price and in US$/ euro exchange rate (OIL and ER), and the market return (STOXX).In summary, TERMSPRE represents the difference between the holding period return on a long term government bond and the risk-free rate; DEFSPRE represents the difference between the holding pe-riod return on a long-term corporate bond and on a long-term
govern-IO Essentially, either macroeconomic variables are used, or portfolios of stocks mirnicking company /industry characteristics, or statistically extracted factors, which cannot however De fully re-conducted to real world variables.
132 BNL Quanerly Review
ment bond; both TERMSPRE and DEFSPRE were constructed ac-cording to the CRR definition; OIL is the percentage variation in the oil price; ER is the percentage variation in the US$/ euro exchange rate; STOXX is the percentage variation in the Stoxx index. I denote by BANKS the percentage variation in the Stoxx Banks index. See ap-pendix A for precise definitions of variabies.
In the return and vari ance equations 1 and 3 DMkt represents news on macroeconomic variabIes, which is released at a frequency Iower than that of stock returns. DMkt will be equai to zero for most t, and differs from zero when unanticipated information hits the market.
D
kt is a day of the week dummy variabIe, for Monday, Tuesday, Thursday and Friday.Turning to the macroeconomic news DMkt, I considered the vari-abies that have been found in the Iiterature to have significant impact on stock returns. Fiannery and Protopapadakis (2002) find that for US stock market returns only news about the Consumer Price Index (CPI), Producer Price Index (PPI), money growth (M2), and Housing Starts influences returns, while GDP news (negatively) affects vari-ance. I used similar variables released for the euro zone (countries adopting the euro), and computed the unanticipated component by subtracting the market anticipation of each release (as provided by Bloomberg) from the data released. The Bloomberg published surveys are monitored by alI market participants and immediately compared with the data release.
I was not able to use the equivalent of Housing Starts for the eu-ro zone. Given the short sample period, I also included monthly In-dustriaI Production news, instead of the quarterly GDP news, folIow-ing CRR. Of course the right-hand side of the return equation 1 can al-so be viewed as a model for the value of banks' assets.
By disregarding equations 2 and 3 we obtain a homoscedastic model, and by further setting Dk and
Y
k to zero we obtain the CRR
model (model1'): .
K
rit = ai
+
L
~fFkt
+
Uit· k-lCommon factors and balanee sheet structure of major European banks 133
3.2. Factor data
Daily data for the above described variables for the period January 4, 1999 to ApriI 30, 2003 were obtained from Bloomberg. To put the sample period considered into perspective, figure 1 shows the time se-ries behaviour of the SX5E (Stoxx) index. The year 1999 was character-ized by a sharp market rally towards the end of the year, which started to fa de in 2000, turning into the economie downturn and market crashes of 2001 and downtrend of 2002.
FIGURE 1 STOXXINDEX 150 140 130 120 110 100 90 80 ~---~---r---~----~ 31-12-98 31-12-99 31-12-00 31-12-01
In particular, the year 2001 was characterized by a pronounced variation of all factors. Stock market variability was high (the Stoxx annualized volatility was 28%), with the burst of the 'new economy bubble' early in the year, and the dramatic crash and subsequent recov-ery of the markets following the September 11 attack in the USo The period from March 2001 to November 2001 was declared by the NBER as an official recession in the USo Monetary policy reaction during the year caused the euro l-month interest rate to drop from 4.84% at the beginning of the year to 3.32% at the end of the year, and to 2~89% at the end of 2002. The oil price also moved substantially,
es-pecially in the last quarter of 2002, due to political fears about a poten-.:.'
134 BNL Quarterly Review
tiai Middie East crisis. The euro weakened throughout against the US dollar throughout the periodo However, as figure 2 dearly demon-strates, the default spread voiatiIity was aiso highest in 2001, with
flights to quaIity following every stock market drop.
110
105
100
95
31-12-98
GOVERNMENT AND CORPORA TE BOND INDEX
, I " '\\1 ""\' • l , , \ (l" III' , I l l
, ,
, l', ,
" ~ FIGURE 2 31-12-99 31-12-00 31-12-01The figure shows the behaviour of the government bond index (solid line) and corporate bond in-dex (dashed line)
The high variation in all the variabies may have provided the op-timai sampie to test the theory from the econometrie point of view. The sharp market drops of 2001 and 2002 raised concerns about banks' profitabiIity, and represent an interesting and extreme period to test
whether banks' individuaI characteristics affected their stock return. In
particuIar, given the sharp decrease in the value of banks' main assets, we can try to test whether we can notice a 'flight to quality' among banks' sharehoIders in this period, whereby banks that appear to own riskier assets are more heavily penaIized by the market.
,
l
,\l
"
'l
,,:
Common factors and baIance sheet structure of major European banks 135
3.3. Statistica! ana!ysis 01 common lactors and 01 the bank sector index The time series behaviour of the chosen factors and their relationship with the bank sector index return (BANKS) was preliminarily investi-gated for the sample period January 4, 1999 to December 31, 2002 (1006 daily observations). Results are reported in table 1. In the table, Panel A reports the correlation among the factors. The term structure (TERMSPRE), default spread (DEFSPRE), and exchange rate variable (ER) are significantly correlated with the market index (STOXX) over the sample periodo TERMSPRE is also significantly correlated with DEFSPRE (as expected, given that the definition of DEFSPRE includes TERMSPRE - see Appendix A) and with the exchange rate variable.
TABLE l FACTORS CORRELA nON AND INDUSTRY INDEX REGRESSIONS
PANELA
TERMSPRE DEFSPRE OIL ER STOXX
TERMSPRE l
DEFSPRE -0.408 1
OIL -0.013 0.003 1
ER 0.197 -0.111 -0.023 l
STOXX -0.254 0.322 0.045 -0.185 l
Pane! A shows the correlation matrix for the factors considered (s.e. = 0.03) and the Stexx index
return. C 0.0127 (0.499) -0.0006 (-0.024) PANELB TERMSPRE DEFSPRE -0.5718 (-5.865) 1.8292 (16.154) OIL ER 0.0079 -0.3958 (0.844) (-10.519) STOXX· R' 0.7776 0.74 (53.48) 0.7481 0.75 (48.420)
Pane! B shows the results of the regression BANKS - C+ b, TERMSPRE + b, DEFSPRE +b, OIL, +b.ER, +b, STOXX, +E, (t-stats in parenthesis).' ' , * When more than one factor is considered, the residuaIs of a regression of STOXX on the other factors are used.
136 BNL Quanerly Review
Estimation results for the model
K M •
BANKS, - ( l + h ~kFk,+h Ok DM k, + h'YkDk'+ U, .. -1 .. -1 Il .. l
over the entire sample period 1999-2002. In the table, factor loadings F" k - 1, 5 are denoted TERMSPRE, DEFSPRE, OIL, EUR, MK. The macroeconomic va~iables'dummies DM", k - l, 4 are denoted CPI, INT, PPI, IND. The day of the week dummles D" k - 1, 4 are denoted MON, TUE, THU, FR!. t-stats are in parenthesis. '
PANELC
C TERMSPRE DEFSPRE DII. ER STOXX· R'
-0.Q20 -0.735 2.153 -0.019 -0.422 0.748 0.78
(-0.413) (-7.670) (14.870) (-2.325) (-10.185) (37.824)
CPI INT PPI IND MON TUE THU FRI
-1.215 -0.004 -1.604 0.028 -0.014 0,017 0.106 0.019
(-0.901) (-0.005) (-1.793) (0.118) (-0.211) (0.251) (1.490) (0.266)
ho (l
P
0.021 0.071 0.894 (1.758) (3.443) (24.679)
Panel C shows the estimates of the factor loadings obtained.
" When more than one factor is considered, the residuals of a regression of STOXX on the other factors are used.
In order to soften the effect of colIinearity between the market
index variable STOXX and the other factors, a new market variable,
MK, was defined (folIowing McElroy and Burmeister 1988) as the
residuals of a regression of STOXX on the other four factors. The market factor thus defined summarizes alI the market forces that can-not be explained by macro-factors.
Next, the relationship between the factors and bank sector index
returns, BANKS, was investigated using regression analysis' (model
l'). Panel B of Table 1 reports the results. With the exception of OIL,
alI other factors are significant in explaining BANKS. However, the
ad-Common faetors and balanee sheet strueture of major European banks 137
dition to the market. Nevertheless, maintaining the five factor struc-ture allows more structural insight as it makes it possible to properly attribute explanatory power to the factors underlying the behaviour of the stock market index. For example, it is well known that banks have a high
f3
on the market. However, once the effect of the default spread is disentangled from the market factor, it appears that some of the vari-ability of banks' stocks with respect to the market can be traced back to their exposure to the default spread.The modell, 2 and 3 was also estimated for BANKS, but it was not possible to obtain a reliable estimate for the coefficients on the dummy variables in the vari ance equation 3, due to a convergence problem in the maximum likelihood procedure. A simplified equation for variance dynamics was therefore adopted. Nevertheless, the esti-mates of the factor loadings obtained are very similar to those obtained under modell' and discussed above (panel
C)
. The dummy variables
for the macroeconomic announcements and the day of the week are not statistically significant, while there is some evidence of heteroscedas-ticity.4. IndividuaI banks
We now focus on European bank stocks listed on different European exchanges. Following the introduction of the euro to European finan-cial markets in January 1999, these stocks are quoted in the same cur-rency. The aim is to measure whether banks with higher Oower) lo ad-ings on factors proxying for the value of their assets are also the banks with higher Oower) balance sheet indicators of risky positions. In oth-er words, we try to ascoth-ertain whethoth-er fundamental balance sheet indi-cators can be taken to be the factor loadings.
The factor model was estimated on individuaI banks' stock re-turns. The sample of banks consists of 27 banking groups listed on the main markets of the euro zone (Germany, France, Italy, Ireland, Spain, Portugal, Belgium, Holland), i.e. with shares traded in euro. These banks are well covered by analysts of at least three mai n global brokers in Europe (this, and market capitalization, were the criteria for selecting them), and their fundamentals are well know in the mar-ket. The names and descriptions of these banks appear in table 2. I
con-i:
,
.'i I , 11 , " l138 BNL Quarterly Review
TABLE2
SAMPLE OF EUROPEAN BANKS USED IN TRE INDIVIDUAL SECURlTIES ANAL YSlS Bank
Bankname*
I
CountryI
Approx. market capcode euro bn (end of 2002)
dexb-bb Dexia Belgium 13.0
bpin-pl BancoBPl Portugal 1.6
bkir-id Bank of lreland lreland 10.0
forb-bb Fortis Belgium 21.0
bep-pl Banco Comereial Portugues Portugal 5.3
bkt-sm Bankinter Spain 1.8
besnn-pl Banco Espirito Santo Portugal 3.7
aaba-na ABN AMRO Holding Holland 24.3
pop-sm Banco Popular Espanol Spain 8.6
bip-im Bipop-Carire (Fineco) Italy 1.6
kbc-bb KBC Bankverzekerings Belgium 9.0
albk-id Allied lrish Banks lreland 12.0
bpvn-im Banco Popolare di Verona ltaly 4.0 e Novara
dbk-gr Deutsche Bank Germany 26.0
cbk-gr Commerzbank Germany 4.0
bpl-im Bipielle Investimenti Italy 1.7
hvm-gr Bayerishe H ypo- und Germany 7.8
Vereinsbank
bmps-im Monte dei Paschi ltaly 6.0
bbva-sm Banco Bilbao Vizcaya Spain 30.0
Argenta
gle-fp Société Générale France 24.0
ue-lm Unicredito Italiano Italy 24.0
spi-im San Paolo Imi Italy 12.0
bnl:im Banca Nazionale del Lavoro Italy 2.4.0
bnp-fp BNP Paribas France 35.0
cl-fp Crédit Lyonnais France 19.0
bin-im Banca Intesa Italy 14.0
brm-im Banca di Roma (Capitalia) Italy 3.0
* Ali banks' names are as of May 2002.
,
'~:
,. ;
Common factors and baI ance sheet structure of major European banks 139
sidered daily data on these stocks for the period 4 January 1999 to 30 ApriI 2003, obtained from Bloomberg.ll
IndividuaI stock returns were regressed on the five common fac-tors (using the variable MK as the market factor) for the four-year peri-od 1999-2002, and separate1y for each calendar year (mperi-odell'). Table 3 summarizes the results.
1999 2000 2001 2002 99-02 1999 2000 2001 2002 99-02
SIZE AND SIGNIFICANCE OF ESTIMA TED FACTOR LOADINGS* PANEL A: NUMBER OF SIGNIFICANT FACTOR LOADINGS
I
TERMSPREI
DEFSPREI
OILI
ERI
MKI
9 5 4 16 26
3 13 3 3 26
8 26 9 5 27
24 25 1 3 26
18 26 2 19 27
PANEL B: AVERAGE FACTOR LOADINGS
I
TERMSPREI
DEFSPREI
OILI
ERI
MKI
0.52 -0.29 0.03 -0.30 0.71 0.18 1.69 0.01 -0.11 0.44 -0.65 1.96 -0.05 -0.14 0.73 -2.98 2.09 0.01 -0.20 0.73 -0.72 1.84 -0.01 -0.23 0.69 TABLE3 CONST 1 o 2 1 o CONST 0.08 0.06 -0.08 0.05 0.00 * The Table summarizes by sample period the number of significant factor loadings at the 5% confidence leve! in the individuaI securities regression rit- C+ bli TERMSPRE, + b" DEF-SPRE + b
"
OIL + b4iER + b" STOXX H , (pane! A) and the average value of the estimated fac-t I t t I)y.. t u
tor loadings across ali banks \rane! B).
While the market factor
(MK)
is statisticaHy significant at the 5% leve1 in each year and in the entire 1999-2002 sample, the number of sta-tisticaHy significant coefficients for the other factors vari es across the years. However, the DEFSPRE coefficient is significant for aH banks11 As each national market observes different holidays, daily data on the
funda-mental factors for each stock were aligned with that of the stock, resulting in slight!y different samples that differ according to the few differences in holidays.
140 BNL Quarterly Review
but one in the entire 1999-2002 period, and significant for almost aH banks for the years 2001 and 2002. It is likely that the strong signifi-canee of this variable for the entire sample 1999-2002 depends on the behaviour in the subsamples 2001 and 2002. In the presence of weak economie conditions, the value of banks' stock appears significant1y re-lated to the value of a proxy for the banks' main assets, i.e. risky loans.
On the other hand, the number of significant coefficients for the other factors vary considerably across the five different samples. In 1999 and in 2000 the significance of factors other than the market fac-tor is also scattered and cannot be generalized.
A similar analysis was carried out for the model1, 2 and 3 and is reported in Table 3bis. However, this non-linear model was successful-ly estimated for each bank only for the enti re period 1999-2002, due to convergence problems in the maximum likelihood procedure in the subsamples. The significance of factor loadings on both MK and DEF-SPRE remains very high (over 2/3 of significant coefficients), although in a few cases the additional explanatory variables tend to capture some of the stock price variation (Panel A). Moreover, for the entire 1999-2002 period, the coefficients estimated on the factors
Fk
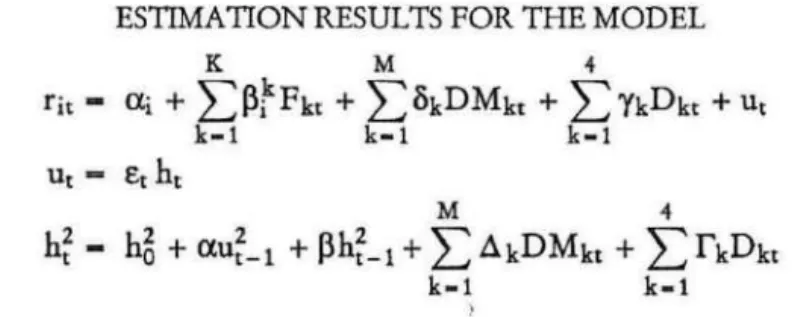
are very similar to those obtained for the simple homoscedastic model1 I (panel B). In the subsequent analysis, coefficients from modell' have been used, although the cross-sectional analysis of section 5 was also carried out using factor loadings from model1, 2 and 3.TABLE 3BIS ESTIMATIONRESULTSFOR THEMODEL
K M 4
Ci, - ai + L~tFk, + LOkDMk, + LYkDk, + U,
k-I k-I k-I
U, - E, h,
M 4
h: - h~ + aU:_I + ~h:_1 +
L
AkDMk, + LrkDk,k-I , k-I
over the entire sample period 1999·2002. In the rable, factor loadings Fh, k - 1,5 are denoted
TERMSPRE, DEFSPRE, OIL, EUR, MK. The macroeconomic va~iables dummies DM,., k - 1,
4 are denoted CPI, INT, PPI, IND. The day of the week dumffiles D", k - 1, 4 are denoted
'"
PANEL A: NUMBER OF SIGNIFICANT COEFFICIENTS
ai TERMSPRE DEFSPRE OIL EUR MK CPI INT PPI IND MON TUE THU FRI
3 12 21 1 14 20 4 2 1 2 4 2 1 2
[
-h"
a p CPI INT PPI IND MON TUE THU FRI -----12 13 11 1 3 1 O 2 2 1 . O
PANEL B: A VERAGE VALUE OF THE COEFFICIENTS
ai TERMSPRE DEFSPRE OIL EUR MK CPI INT PPI IND MON TUE THU FRI
0.09 -0.64 2.15 -0.02 -0.24 0.69 3.03 0.09 -0.80 -0.33 -0.15 -0.12 -0.06 -0.10
h"
a p CPI INT PPI IND MON TUE THU FRI1.89 0.09 0.70 2.52 7.65 12.43 0.25 0.24 0.28 0.43 0.21
Q
~
"
.,.
14 o ;;l ~ cr .,;:;-"
R ~ ::r " ~ :'l 2 14"
Cl o....
3 ~. o ., tT1"
., o'"
" ~ cr .,"
ef-
....
-142 BNL Quarterly Review
. The size and cross-sectional variation of the estimated factor loadings were examined next. Given the strong association of the DEFSPRE variable with stock returns and its low variability com-pared to MK, significant factor loadings on DEFSPRE are expected to be larger than factor loadings on MK. In the samples in which the de-fault spread is significant for almost alI banks (1999-2002, 2001 and 2002) according to model 1', the cross-sectional variation in the DEF-SPRE coefficient is high. For the enti re sample in 1999-2002 this factor loading has values between 0.16 and 2.97. This variation is greater than the cross-section variation of the MK factor loadings (0.24 to 1.09 for MK). Factor loadings on TERMSPRE, when significant, are generalIy negative, while no clear sign pattern emerges for factor loadings on
OIL
and ER.The significance of the default spread is not at alI surprising given that banks' equity variation will be strongly associated with this vari-able. However, banks are also subject to term structure risk, but this effect do es not show up systematicalIy in the cross-section of factor loadings. Part of the reason may be due to the negative correlation be-tween TERMSPRE and DEFSPRE, which decreases their significance (especially in the case of the weaker explanatory variable TERM-SPRE). In addition, if we consider the impact of term structure effects on bank stock price resulting from the variation of banks equity, we realize this is very lirnited. In fact, for the majority of the banks exam-ined, quantitative assessment of market risk (following the Basle I di-rective) seems to have been implemented and term structure risk ap-pears very much under controI. AlI the banks exarnined emphasize their approach to risk management in their annual reports, aimed at controlling all market risks, and often report the average Value at Risk
CV
AR) of their securities portfolio. The bulk of market risk is usualIy interest rate risk, which is subject to some kind of Asset Liability Man-agement approach. The reported V AR numbers are generalIy reassur-ing.12 On the other hand, if the amount of term structure risk (and12 This is not to say that banks are not subject to significant interest rate risk.
However, interest rate risk may be re!ated in a more cyclical fashion to (short and long) interest rate fluctuations. Interest rates are in fact a typical business cycle vari-able, and their variation affects banks' earnings both at the top line leve! (interest rate margin is affected by interest rate variation via the different stickiness of lending and
deposit rates at different interest rate leve!s), and at the provisions level via the effect on bad loans. Typically, banks cannot compress deposit rates at low levels of interest
com-Common factors and balance sheet structure of major European banks 143
generally market risk) on the banks' books could be quantified, the impact on share price could in principle be marked to market. This would require access to a bank's internaI information. However, the message that comes from the annual reports of the banks examined is that term structure risks are very limited, and therefore should not be very important in explaining the high frequency variation in the price of their equity. Table 4 summarizes the information available on mar-ket risk from the 2001 consolidated annual reports of the banks exam-ined. Although trading portfolios (mainly fixed income securities) are much larger than banks' equity, daily VAR represents on average less than 0.25% of equity. Given these numbers, it is not surprising that, in most of the cases, the term spread variable does not significantly ex-plain bank stock returns.
On the other hand, credit risk, which is the bulk of banks' oper-ating risk, is of a completely different order of magnitude and not yet subject to detailed quantitative measurement. From my time series analysis, the effect of credit risk on bank stocks, as proxied by the de-fault spread, is clearly quite pronounced.13
5. Cross-section variation of the factor loadings
In this section I try to understand whether the difference in balance sheet indicators of European banks is also reflected in the factor load-ings of their stock on fundamental factors, which may proxy for the value of their assets. I am especially interested in the correspondence between balance sheet indicators relating to reserves for loan losses and factor loadings. In fact, according to the theory summarized in section 2, if we accept the assumption that higher reserves for loan losses sig-nal riskier assets, the bank stock should consequently have a higher factor loading on market factors that proxy, in a significant way, for
pressed. On the contrary, with an increasing interest rate, lending rates increase faster and the interest rate margin increases. These will be 'slow' effects that build up over the bank reponing period, and will not be easy to detect in daily share price variation.
1) V AR, on a daily basis, is on average well below 0.25% of banks' equity. Due to active ponfolio management and stop losses, it is unlikely that this measurement can
be annualized in a linear fashion. The stock of credit risk, as measured by loan lossre
VALUE A T RISK OF TRADThfG PORTFOUO*
Shareh. Trading
Avg. VAR, Avg. VAR Avg. VARto VAR Confidence
Bank equity, portf.,
euro mi to shrh. eq. trading port % horizon interva! %
euro mi euro mi %
dexb-bb 8,337 116,780 18,125 0.22 0.02 10 days 99
bpin-pl 909 2,859 n.a. n.a. n.a. n.a. n.a.
bkir-id 3,798 8,673 8 0.21 0.09 1 day
forb-bb 13,844 19,447 n.a. n.a. n.a. n.a.
bcp-pl 2,187 4,783 4,5 0.21 0.09 10 days 99
bkt-sm 847
m
9,38 1.11 1.21 1 day 95besnn-pl 1,404 5,489 31,22 2.22 0.57 10 days 99
aaba-na 11,787 152,455 41 0.35 0.03 1 day 99
* The table repons information about the banks' risk control derived from their 2001 consolidated financia! statements.
TABLE4
Notes
A verage of first 9 and last 3 months, where trading expo-sure was quite different Adopts maturity gap and V AR approach
Effect of 1% parallel upward shift in term structure
Uses basis point sensitivity of swap curve rates, V AR and duration of net equity
1% parallel shift of yield curve,
historica! stress tests
Stress test (125 b.p., -30% on stock market, 5% change in FX, volatility 60%) Stress test
-...
...
~
,o"
" ::\ '"%
f
~Shareh. Trading
Avg. VAR, Avg.VAR Avg. VARto Bank equity, pom.,
euro mI to shrh. eq. trading port %
euro mI euro mI % pop-sm 2,296 617 0,269 0.Ql 0.04 fco-im 2,119 n.a. n.a. n.a. kbc-bb 9,480 66,224 13,98 0.15 0.02 albk-id 5,626 20,414 13 0.23 0.06 bpvn-im 1,937 2,787 n.a. n.a. n.a. dbk-gr 35,663 365,319 41,02 0.12
om
cbk-gr 12,043 104,455 13 0.11 0.Qlbpl-im 1,756 5,208 n.a. n.a. n.a.
VAR Confidence honzon interval % l day 95 l day 99 10 days 99 1 day 99 l day 99 7 days 99 TABLE 4 (eont.) Notes ,
Stress tests, duration, senSl~
tivity to shift in yield curve and change in volatility VAR at 31.12.01
-
303M whereas tbe 10 day V AR was 10.7mAv. V AR is for equity port- I folio only. Basis point value: cbange in pomolio value for trading equity pomolio only Interest sensitivity gap analysis Av. V AR is total for corporate and investment bank. group division trading units. Stress testing
Stress testing
Covariance approach, stress tests
()
I
::> ~ o o: ~ P-cr' e. ~ n " ~ P'" " ~ ~2
2
Cl O....
a
~. ~ tT1 c;: ... o 'O " " ::> cr' ~ tr-...
\.IOShareh. Trading
Avg.VAR, Avg.VAR
Bank equity, porn.,
euro mi to shrh. eq. euro mi euro ml % hvm-gr 25,110 n.a. 76 0.30 bmps-im 5,308 11,467 9,77 0.18 bbva-sm 17,498 93,246 24,18 0.14 gle-fp 15,750 128,597 38 0.24 UC~lID 9,466 29,367 3,69 0.04 spi-im 8,002 16,798 7,5 0.09 bnl-im 3,613 6,471 13,5 0.37 bnp-fp 24,610 98,559 30 0.12 cl-fp 8,207 17,816 19 0.23 bin-im 14,061 56,419 15 0.11
cap-im 5,624 16,179 n.a. n.a.
'''', :~.",.:.:.~'" ", ~ ... -';'~-.,
' ..
-Avg. VARto VAR Confidence
trading pon % horizon interval %
n.a. l day 99 0.09 1 day 99 0.Q3 l day 99 0.03 l day 99 0.01 1 day 99 0.04 10 days 99 0.21 1 day 99 0.03 10 days 99 0.11 1 day 99 0.03 1 day 99 n.a. l day 99 - -·;:.w:,,,,.;;:i:2~~· TABLE 4 (cont.) Notes Sensitivity analysis Sensitivity analysis
Stress test, sensitivity, Vega Duration
Sensitivity analysis (100 b.p.),
worst case scenario
Av. V AR is for Dee. 200l.
Year avo approx. 8 mill.
Gross Earning at Risk (GEaR),
stress tests
50 stress scenarios
Volatility sensitivity (Vega), Delta risk V AR at 3l.12.01-24.8M, 30.6.01-15M, 3l.122000- 10M. Expected shornall method '--",,~.,. "-"-". ...
...
'"
~
,o"
,.. ;J " ~ ::<' ~ ~ ->lCommoo factors and balance sheet structure of major European banks 147
the value of its assets. This pattern should emerge in economie down-turno By including other possible balance sheet indicators in the analy-sis, I try to understand whether this effect may also be captured by other banks' characteristics, i.e. given, for example, by differences in leverage (Tier 1 capitaI), or generaI bank efficiency. In the literature a number of fundamental characteristics that affect banks' stock returns have been identified (see section 1). I try to explain why, in specific
cir-cumstances, stock returns should be affected by the value of funda-mental indicators and, in particular, whether the evidence is consistent with an option based approach to the valuation of banks.
5.1. Fundamental indicators
The set of characteristics considered are those that capture the main items of the operating margin (interest income, commission income, loan loss provisions, administrative expenses) and of the balance sheet Oeverage, reserves for loan losses). Freedom of establishment for finan-cial institutions within the European Union and the consequent har-monization of their business, as well as relatively similar accounting standards, make the banks considered fairly homogeneous. Neverthe-less, it was necessary to carry out a careful analysis of the financial
re-porting conventions of banks Iocated in different European countries to assess their fundamental balance sheet characteristics in a consistent way. See Appendix B for more detaiis.
A Iarge set of fundamentai indicators was initially used to de-scribe banks' fundamentai characteristics, including most of the indica-tors considered in the previous literature, but the focus was narrowed down to the most meaningfui ones.14
For each of the banks considered and for each year the following indicators were computed (from the consolidated financial statement):
11 For example, a number of different measures of asset quality were considered,
but some indicators were eliminated from the analrsis as they were strongly correlated
with others (namely non-perforrning loans to tota loans, coverage ratio, loans to total
148 BNL Quarterly Review
ASSET QUAUTY INDICA TORS
NII- Net Interest Income
Total Income
COM- Commission Income Total Income
Tier1 - Tier 1 ratio, as reported by each bank
14 - Reserve for Loan Losses x 100 Total Loans
15 - Provision for Loan Losses A verage T ota! Loans x 100
CI - Income Cost
I focused on the components of the operating margin and elimi-nated from the analysis indicators that are highly influenced by ex-traordinary items, such as earning per share. It is also difficult to gath-er consistent data on off-balance-sheet commitments for Eurapean banks. With these qualifications, I looked at essentially all the funda-mental indicators previously considered in the literature.
The definition of the fundamental accounting indicators was stan-dardized across the different European banks as far as possible. A1-though banks' financial results will be simultaneously influenced by the state of the economy, we could expect their structure (percentage inci-dence of different prafit and 10ss items on operating margin, or on bal-ance sheet) to be relatively constant in the short term. I test below the hypothesis that some key ratios are stable over time.
If
this is the case, these ratios could then be considered (following the originaI idea of Rosenberg 1974) as structural characteristics through which the factors considered affect banks' stocks, i.e. as proxies for factor loadings.These asset quality indicators appear to be fairly stable over time. Table 6 reports a transition matrix analysis in which, after ranking an indicator in a particular year as High, Medium or Low (three tiles, H, M, L), the probability of the indicator being in the same quan-tile the following year is reported. As can be seen, the probability that a bank ranking H, M or L according to a fundamental indicator will continue to have the same rank the following year is very high.
I then tried to assess whether the different sensitivity of the main European banks' stock price to the common factors may be due to the different va1ue of the indicators of their fundamental characteristics.
"
Common factors and balance sheet structure of major European banks 149
While l have a theory for the effect of loan loss reserves (14, and
possi-bly 15) on factor loadings, l also try to verify whether the other
indica-tors have any systematic effect. Intuitively, we may think about
mech-anisms through which different balance sheet indicators can expose a
bank to CRR factors in a different way. Intuitively, the term structure
factor may be associated with interest income, the market factor may
be associated with commission income, the default spread will be
asso-ciated with provisions. CRR factors may impact different1y on banks
with different structures of assets and revenues.
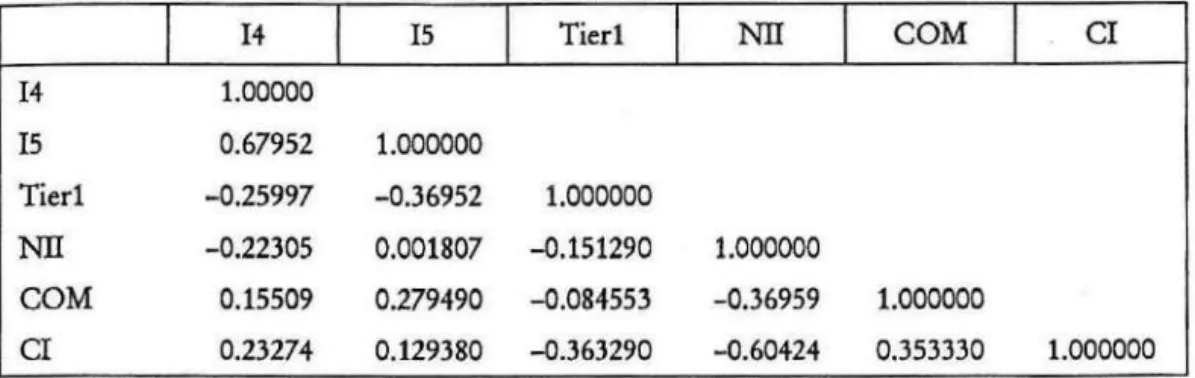
TABLE5
CORRELA TION BETWEEN FUNDAMENT AL INDICA TORS*
I
14I
15I
TierlI
NnI
COMI
CI 14 1.00000 15 0.67952 1.000000 Tierl -0.25997 -0.36952 1.000000 Nn -0.22305 0.001807 -0.151290 1.000000 COM 0.15509 0.279490 -0.084553 -0.36959 1.000000 CI 0.23274 0.129380 -0.363290 -0.60424 0.353330 1.000000* Correl.tion m.trix between the aver'ge value (over the four years considered) of the funda men-t.l indicators of the banks studied.
Table 5 reports the cross-sectional correlation between the
four-year average of the fundamental indicators considered. Given the small
cross-section sample, it is not possible to detect many significant
corre-lations. However, in many cases the correlation is on the edge of
sig-nificance. This implies that the fundamental indicators other than 14
and 15 (on which we are focusing) may also in tum be systematically
correlated with factor loadings.
5.2. Cross-section regressions
I carry out a preliminary exploration to gain a better insight before
testing the empirical implications of the theory put forward in section 2 more formally.
As a first exploratory analysis, l cross-sectionally regressed the
es-timated factor loadings on common factors of all the banks on the
fun-damental indicators. Factor loadings estimated from model l, 2 and 3
150 BNL Quarterly Review
were used when the entire sample 1999-2002 was considered, and fac-tor loadings from the simpler model l' were considered in the sub-pe-riods.15 This gives an initial indication as to whether the fundamental characteristics of European banks influence their sensitivity to move-ments in the key factors.16
As some of the indicators are correlated in the cross-section (see Table 5) and therefore provide the same type of information (and giv-en the very small sample), in the giv-end a parsimonious regression specifi-cation was adopted in which factor loadings for each factor were re-gressed in tum against a single fundamental indicator. The factor load-ings of all banks against each factor were regressed on each of the asset quality indicators for each year and for the period 1999-2002. The cross-section regressions take the form:
hkt ki ki it ~i = a
+
b IND i+
ei" hwhere
f3;'
is the estimated factor loading of bank stock i on factork
in period t (i = 1, ... ,27; t = 1999,2000,2001, 2002 and 1999-2002);INDl'is the value of the fundamental indicator
j (j=I4, 15, Tier 1, NII, COM, CI) of banki in period
t;k
= TERMSPRE, DEFSPRE, ER,OIL, MK. This results in 30 regressions for each estimation period (5 factors on 6 asset quality indicators).
Given the strong persistence of fundamental indicators highlight-ed by table 6, the contemporaneous value of the fundamental indica-tors was used as an explanatory variable in these regressions, i.e. the fundamental characteristics of each bank as of 31.12.99 were correlated to the factor loadings estimated with 1999 daily data. This may be jus-tified not only because of the strong stability of the banks' ranking ac-cording to these indicators, but especially because of the heavy cover-age of these banks by financial analysts of major brokerage houses, which results in their balance sheet items being quite well anticipated by the market. For the period 1999-2002 the average value of each
indi-15 The results of the cross·section regressions for the entire period .1999-2002 are
not materially different if estimates from model (1 ') are considered.
16 A cross-section regression like those used here was employed by Flannery and
James (1984) to assess whether banks' factor loading on short-term bond holding
peri-od returns was related to the balance sheet mismatch between short term assets and lia-bilities.
l'
Common factors and balance sheet strueture of major European banks 151
TABLE6
RANK STABILITY"
I
14I
15I
Tier 1I
NIII
COMI
CI1999 0.8519 0.7407 0.6800 0.7692 0.6154 0.7308
2000 0.8519 0.6667 0.7407 0.8889 0.7407 0.7778
2001 0.7407 0.6667 0.5926 0.m8 0.8148 0.8148
* The table reports the probability that a bank with a certain rank according to the value of a
fun-damental indicator maintains its rank in the subsequent year. After ranking the bank as High,
Medium or Low, according to the value of the indicator in a particular year, the probability of
the indicator, being in tbe same percentile the following year, is computed and reported.
eator aeross four years was used. A generaI eaveat is in order, as these
expIoratory regressions are earried out on very few observations and
the dependent variabies are potentially very noisy estimates of faetor
Ioadings. Appendix C reports the results of the same anaIysis earried
out through a pooling regression, whieh alIowed me to make
simulta-neous use of fundamentai indieators and faetor Ioadings estimates ob-tained for different years.
If
the entire 1999-2002 period is considered (Tabie 7), banks' assetquaIity indieators (14 and 15) positively affeet the size of estimated
fae-tor Ioadings on DEFSPRE and MK (14 only). Reeall that the faetor
Ioadings of alI banks on DEFSPRE and MK are the only two that are
TABLE7 CROSS-SECTION REGRESSIONS 1999-2002
I
TERMSPREI
DEFSPREI
OILI
ERI
MK14 -0.0864 0.2145'" 0.0012 -0.0216 0.0538' (0.0559) (0.0828) (0.0032) (0.0253) (0.0322) 15 -0.3760 1.1621" -0.0034 -0.0489 0.1941 (0.3329) (0.4913) (0.0188) (0.1494) (0.1939) Tier 1 -0.0390 -0.0129 0.0027 -0.0652" 0.0256 (0.0748) (0.1197) (0.0041) (0.0303) (0.0433) NII 2.0409" -1.6779 0.0365 0.1129 -1.0080" (0.7932) (1.3803) (0.0486) (0.3906) (0.4758) COM -2.9366'" 2.9743' 0.0512 -0.0510 1.0687' (1.0018) (1.7509) (0.0631) (0.5092) (0.6379) CI -2.3018" 3.7029" -0.0510 -0.2124 1.5227'" (0.9673) (1.5367) (0.0581) (0.4679) (0.5408)
The Table reports the resu!ts of univariate OLS regressions in which the factor loadings of ali
banks on common faetors, estimated aver the period 1999-2002, are individually regressed aver
the aver age value of the banks' fundamental indicators and a constant (not reported). In the table
the regression coefficients of each faetor loading on each of the fundarnental indicators are
report-ed, with standard errors in parenthesis .... , .. and • denote significance respeetively at the 1%, 5%
152 BNL Quarterly Review
consistently statistically significant in explaining the ti me series of bank stock returns (Table 3). Results for asset quality indicators are therefore entirely consistent with my argument that if we interpret a high value of 14 and possibly 15 as a feature of a bank with riskier as-sets, then higher estimated factor loadings should follow. The weaker impact of asset quaIity on the MK factor loading is not too surprising considering that the market is itself a proxy (although a worse one than DEFSPRE) for the value, and indirect1y the financial stabiIity, of the companies banks lend money to. Results for sub-samples also ap-pear to be in accordance with my conjecture, as discussed below.
The results in Tabie 7 for the capitaI adequacy indicatar Tier 1 seem to indicate that banks with higher capitaI are perceived as Iess subject to exchange rate risk. However, factor Iaadings on ER are anIy cansistent1y significant far a small portian of the sub-sampies (namely 1999), and results are mare difficult to interpreto
The fundamentai indicators that capture the praportion af banks' net revenues derived fram interest incarne and commissian in-come
(NII
and COM) affect factor loadings on TERMSPRE as expect-ed. They also, with opposite sign, affect the factor laadings an DEF-SPRE, although in a marginaI way, and on MK (Table 7). The positive effect of NII on the TERMSPRE factor Ioading seems to indicate that banks that have a Iarger share of their revenue deriving fram interest incarne are more exposed to term structure risk.In interpreting these results it must be taken into account that the NII and COM indicators are negatively correlated in the cross-se c-tion af banks, as a bank that derives a higher percentage af its revenues from interest income will inevitably derive a lawer percentage af its revenues fram cammissian income. Hence the effect of NII and COM on the estimated factor Ioadings will in generaI be af apposite sign. Other caveats in interpreting these results stem fram the facts that TERMSPRE and DEFSPRE are negatively correlated by canstruction and opposite effects of NII and COM on TERMSPRE and DEFSPRE factor Iaadings may be a purely statistical feature, and the fact that esti-mated factor Ioadings on TERMSPRE are again anly significant in one of the sub-sampies (namely 2002).
It is interesting to see that the factar laadings an the market fac-tar are pasitively associated with alternative incarne, i.e. a Iarger share of incorne coming from commissians (COM) and consequently nega-tively assaciated with interest income share (NII). The market factor
,
.. ,I~
!. Common factors and balanee sheet structure of major European banks 153
MK is orthogonal to other factors, so this result is not a statistical con-sequence of correlation between factors. As observed in previous sec-tions, a bank with higher commission income is more exposed to the market through its intermediation and asset management lines of busi-ness, and therefore the effect on the rnarket factor loading is consistent with expectations.
Frorn table 7 we also note that the cost-incorne ratio has also an effect on factor loadings, especially those on TERMSPRE (negative), on DEFSPRE (positive) and on MK (positive). These results are aga in not easy to interpreto The cost-incorne ratio appears (also frorn the cor-relation matrix in table 5) as a sort of 'catch all' indicator, correlated with alI the others. That is, a bank with a high-cost incorne ratio is in generaI a lower quality bank, which has also high provisions for bad loans, low Tier 1 capitaI and low interest income. The cost-incorne in-dicator may provide a synthesis of a bank's riskiness that is useful in explaining factor loadings.
When the same cross-section estimation is carried out through a pooling regression (Appendix
C),
the estimated effects are quite similar and the qualitative results are alrnost identical, but the statistical signif-icance of the results already presented in table 7 is enhanced. The only differences between the results of the pooling regression and those pre-sented in table 7 are that Tier 1 no longer affects factor loadings on ER but appears instead to affect factor loadings on DEFSPRE in a negative way (which is a sensible result, as higher capitaI adequacy should rnake a bank less sensitive to bad loans). Meanwhile, COM no longer posi-tively influences the factor loading on DEFSPRE, which reinforces the idea that the effect of COM on DEFSPRE might be spurious and due to the correlations between NH and COM on the one hand, and TERMSPRE and DEFSPRE on the other.When looking at individuaI years (Tables 8-11), the results are more variable. However, some significant association between factor loadings and asset quality can be detected for the years 2002, 2001 and, rnarginally, 2000, while no association is found for 1999. In particular, for 2001 the result shows that the balance sheet indicator 14 (reserves for loan losses over loans) and 15 (provisions for loan losses over loans) do have explanatory power for the size of the banks' factor loading on
the default spread and the market. The association between the 14 indi-cator and the default spread factor loading is rernarkable (see figure 3). It is interesting that the measure of 'bad loans risk' more strongly
asso-154 BNL Quarterly Review
ciated with market behaviour is based on a baI ance sheet stock variabie (a proxy for totai stock of bad Ioans) rather than on the same year pro-vision against new bad Ioans. Also, the high responsiveness of 'bad banks' stock return to default spread seems to kick in at a time of a sharp economie and stock market downturn, when investors start to be highIy concerned about the downside risk of their equity invest-mento This is consistent with the theory referred to in section 2.17 AIso, commission income and, to a Iesser extent, interest income and cost income ratio appear associated with the factor Ioading on the mar-ket in most years, but especially in the bull marmar-ket period of 2000, when asset quaIity do es not appear to influence stock riskiness.
TABLE 8
CROSS·SECTION REGRESSIONS 1999*
I
TERMSPREI
DEFSPREI
OILI
ERI
MK14 -0.0053 -0.0085 -0.0001 -0.0403 0.0119 (0.0460) (0.0916) (0.0088) (0.0403) (0.0200) 15 0.1863 0.1706 -0.0481 -0.0293 0.0882 (0.3188) (0.6381) (0.0607) (0.2868) (0.1397) Tier 1 -0.0350 -0.1787' 0.0266'" -0.1092" -0.0130 (0.0572) (0.1080) (0.0095) (0.0463) (0.0249) NII -0.3059 -1.5828 -0.1530 0.1046 -0.6186 (0.9347) (1.8168) (0.1751) (0.8344) (0.3830) COM -2.3561" 0.8536 0.2349 -0.5007 1.0899" (1.0562) (2.2793) (0.2150) (1.0290) (0.4472) CI 0.7955 -1.1654 -0.0092 0.1195 -0.2949 (0.9063) (1.7979) (0.1748) (0.8200) (0.3917)
• The table reports the results of univariate OLS regressions, in whieh the faetor loadings of ali banks on eommon faetors (estimated in 1999) are individually regressed over the value of the banks' fundamental indieators at the end of 1999, and a eonstant (not reported). In the table I report the regression eoeffieients of eaeh faetor loading on eaeh of the funda!p.ental indieators, with standard errors in parenthesis. "', " and ' denote signifieanee respectively at the 1%, 5%
and 10% leve!.
17 To understand why asset quality should affeet the value of banks, remember
that majority of bank assets are loans. In normal times, the provisions against loan losses set aside in the accounting period (charged in the Profit and Loss account) should approximately cover the amount of loans going bad in the year. In bad years, the incidence of the provisions for loan losses over loans will increase. However, in catastrophic times such provisions may not be sufficient, and the probability that
re-serves already accumulated in the balance sheet will be burned increases. Therefore, a bank with worse asset quality indicators will be riskier, and this may be reflected in a higher sensitivity to the relevant factors.