Contents lists available atScienceDirect
Journal of Asian Earth Sciences: X
journal homepage:www.journals.elsevier.com/journal-of-asian-earth-sciences-x
Fragments of asthenosphere incorporated in the lithospheric mantle
underneath the Subei Basin, eastern China: Constraints from
geothermobarometric results and water contents of peridotite xenoliths in
Cenozoic basalts
Yan-Tao Hao
a,⁎, Costanza Bonadiman
b,⁎, Massimo Coltorti
b, Qun-Ke Xia
a aSchool of Earth and Space Sciences, Zhejiang University, Hangzhou 310027, ChinabDepartment of Physics and Earth Sciences, University of Ferrara, Via Saragat 1, 44121 Ferrara, Italy
A R T I C L E I N F O Keywords: Water contents Fertile mantle Melting models Water diffusion Asthenosphere/lithosphere A B S T R A C T
Anhydrous, medium/coarse-grained spinel bearing mantle xenoliths from the Subei Basin, Eastern China have mineral arrangements that reflect low energy geometry. Because of clinopyroxene modal contents, they are grouped into cpx-rich lherzolites (cpx ≥ 14percentage), lherzolites (8 < cpx < 14%), cpx-poor lherzolites (6 < cpx ≤ 8%) and harzburgites (cpx up to 4%), without relevant textural differences from the most fertile to the most depleted lithotypes. The cpx-rich lherzolites have mineral chemistry close in composition to Primitive Mantle (PM), whereas cpx-poor lherzolite (and lherzolite) and harzburgite groups cannot be considered as a result of direct melting of the PM source. In addition, the high LREE, Th and U contents, coupled with a Sr enrichment of clinopyroxenes in these lithotypes, indicate the circulation of a silicate melt (with crustal com-ponents) in a variably depleted mantle sector well before the entrapment of the xenoliths by the host basalt.
Despite the large differences in refractory lithophile element contents (i.e. Ca, Al and REE), the equilibrium temperatures never exceed 1021 °C with a constant difference (< 200 °C) from harzburgites to cpx-rich lher-zolites. Measured mineral water contents indicate that the whole rock contains, on average, 19 ± 7 ppm of H2O without any systematic variation among rock types nor correlation with Al2O3, light-REE and Yb (or Y) contents of cpx. The cpx H2O contents of cpx-rich lherzolites (41–96 ppm) are, on average, one order of magnitude lower than those theoretically expected (214–530 ppm) for a residuum after a maximum of 3% of PM fractional (≈ bulk) melting in the spinel stability field.
The proposed dehydration model suggests that the cold highly refractory harzburgites and cpx-poor lher-zolites (and lherlher-zolites?) may represent old cratonic lithospheric mantle modified at depth by the interaction with silicate melts, which may also have involved crustal components. In turn, cpx-rich lherzolites constitute fragments of upwelling fertile asthenosphere, which caused the removal/erosion of the lowermost part of the lithospheric mantle. This asthenosphere portion may have been incorporated in the lithospheric region since the Jurassic and it may have progressively cooled down after one (or more) partial melting episodes. The water depletion can be accounted for a continuous loss by diffusion during the subsolidus chemical-physical read-justment, well after (> 5My, based on modelled H2O solid-solid diffusion rate) the occurrence of the last melting episode.
1. Introduction
The North China Craton (NCC), characterized by crustal remnants older than 3.8 Ga (Liu et al., 1992), represents a unique large craton of eastern Eurasia and its formation and subsequent evolution are well preserved in the Phanerozoic geology of eastern China. In recent years, geological, geophysical and geochemical studies have converged to
suggest that the Eastern Block of the North China Craton (NCC) has lost > 100 km in thickness of its lithospheric root (Windley et al., 2010; Menzies et al., 2007and references therein). However, currently the subject of debate, is how and when the Archaean sub-continental li-thospheric mantle was delaminated/thinned (e.g.Griffin et al., 1998, 2009; Xu, 2001; Zhang et al., 2003; Rudnick et al., 2004; Wu et al., 2006; Deng et al., 2004; Gao et al., 2004; Ying et al., 2013; Tang et al.,
https://doi.org/10.1016/j.jaesx.2019.100006
Received 5 September 2018; Received in revised form 26 December 2018; Accepted 12 January 2019 ⁎Corresponding authors.
E-mail addresses:[email protected](Y.-T. Hao),[email protected](C. Bonadiman).
Journal of Asian Earth Sciences: X 1 (2019) 100006
Available online 23 January 2019
2590-0560/ © 2019 The Author(s). Published by Elsevier Ltd. This is an open access article under the CC BY license (http://creativecommons.org/licenses/BY/4.0/).
2013; Chen et al., 2016; Wu et al., 2017). Present day models can be broadly grouped into “top-down” or “bottom-up” models. The top–-down delamination models imply rapid removal (less than 5 Ma) of the entire sub-continental lithospheric mantle, including parts of the lower crust (Gao et al., 2004, 2008); whereas the bottom-up thermal/che-mical erosion models imply a protracted up to ∼100 Ma lithospheric thinning. However, low water contents in the nominally anhydrous minerals of peridotite xenoliths (Bonadiman et al., 2009) from the eastern part of the NCC have been initially interpreted as the presence of ancient lithospheric mantle’s relicts, rather than a juvenile accreted asthenospheric mantle (Xia et al., 2010; Hao et al., 2012).
One critical line of investigation that may be used to address the questions regarding the nature and evolution of the sub-continental lithospheric mantle of the NCC is to examine the mantle-derived peri-dotite xenoliths. In fact, the majority of periperi-dotite xenoliths, which formed in the sub-continental lithospheric mantle, are rapidly trans-ported to the surface, along with their host magmas, in a matter of few hours/days. Thus, they represent snapshots of the sub-continental li-thospheric mantle and have the great potential of unravelling the nature and evolution of their source. The Subei basin occupies a critical position at the southern edge of the NCC and is located within the collision zone between the NCC and the South China Block (SCB), with a northward-directed subduction (Li, 1994; Chung, 1999). Conse-quently, the peridotite xenoliths from the Subei basin have the potential to reveal not only the nature of the sub-continental lithospheric mantle and their possible relationship with the asthenosphere, but also to shed light on the metasomatic processes associated with subduction.
In this paper, with obtained new trace element data of clinopyr-oxene (cpx), we characterize the mantle domain beneath the Subei basin, eastern China, through a detailed geochemical study of peridotite xenoliths hosted by the Cenozoic basalts from Lianshan (LS). The major and trace element chemistry (including H2O) of peridotite minerals provides a coherent petrological history of this geodynamically com-plex region.
2. Geological background
The geological architecture of the eastern part of China resulted from the amalgamation of two large tectonic blocks, the NCC and the SCB. The latter can be divided into the Yangtze block to the northwest
and the Cathaysia block to the southeast. The NCC is separated from the Xing-Meng Block by the Central Asia Orogen to the north and from the Yangtze block by the Triassic Qinling-Dabie orogen to the south. A continental scale Tan-Lu fault cuts both the Xing-Meng block and the NCC. The eastern part of NCC experienced widespread lithospheric thinning and evolved from a thick (∼200 km), cold (∼40 mW/m2) and highly refractory lithospheric mantle in the mid-Ordovician to a thin (60–80 km), hot (60–80 mW/m2) and fertile lithospheric mantle after the late Mesozoic (Menzies et al., 2007, and references therein).
From Early Triassic to Late Jurassic, the SCB and the NCC con-verged, forming the Qinling-Dabie-Sulu orogen and a large ultra-high pressure suture zone (e.g.,Li et al., 1993). This was transected during middle Triassic to early Cretaceous by the Tan-Lu sinistral strike slip fault, which moved the Sulu orogeny northward (Zhu et al., 2009). The superficial tectonics indicates that the suture between the SCB and the NCC eastward of the fault is placed slightly north of the Sulu terrain. However, based on linear aeromagnetic anomalies, deep seismic pro-files and regional geology,Li (1994) proposed a crustal detachment model. This model postulates that during the mid-Mesozoic a collision between the two continental blocks occurred: the upper crust of the SCB in the Subei Basin-Yellow Sea region was detached from the lower crust and thrust over the NCC for more than 400 km, whereas the lower part of the lithosphere was subducted under the NCC along a subsurface suture located east of Nanjing (Fig. 1). Recently,Su et al. (2013) pro-posed a similar subsurface boundary, based on the study of Sr–Nd–Pb–Hf isotopic systems of Cretaceous granitic plutons. The Subei basin is located east of Tanlu fault, just north of the proposed subsur-face suture. It is still unclear whether the mantle lithospheric roots beneath the Subei basin belong to the NCC or the SCB.
The Subei basin experienced widespread Cenozoic volcanism, which can be either directly or indirectly related to the lithospheric thinning of the NCC. The volcanism includes minor tholeiitic products mainly erupted during the early Paleogene, and xenolith-bearing alkali basalts extensively erupted during the Neogene (Fig. 1). The integration of sulfide and whole-rock Re–Os data suggests that the oldest part of the lithospheric mantle sampled by the peridotite xenoliths beneath Subei basin may be Paleoproterozoic in age, and subsequently modified during Mesoproterozoic and Phanerozoic times (Reisberg et al., 2005; Xu et al., 2008).
The studied peridotite xenoliths are from Lianshan in the Subei Fig. 1. Simplified map of Eastern China (a) main tectonic lines separating the actual lithospheric blocks (afterXia et al., 2010) and location of the Subei Basin. (b) distribution of the Subei Basin Cenozoic mantle xenolith bearing volcanism; in red, the LS sample locality of this study. (For interpretation of the references to color in this figure legend, the reader is referred to the web version of this article.)
basin, located in northwestern Jiangsu Province (Fig. 1) and are con-tained in the alkali basalts of the Huanggang volcanic group, dated between 10 and 12 Ma (Shao et al., 1989).
3. Material and analytical methods
3.1. Petrography and modal composition
The LS sample collection is entirely constituted by spinel-bearing peridotite without any evidence of hydrous phase. Twenty-two samples out of about forty xenoliths were selected for this study, based on xe-nolith size and representativeness of the different lithology. They range in size from 5 to 10 cm and do not show any evidence of alteration or host basalt infiltration.
As the thin section includes just a small amount of the xenoliths in relation to the grain size, mass balance calculations between whole rock and mineral major element compositions are generally preferred in determining modal percentages of the minerals. However, for the LS xenoliths, whole rock analyses were possible for seven samples only, thus the mineral proportions of all samples were estimated by thin section point counting (Table 1). This method can be confidently ap-plied, since the grains are all < 3 mm in size; because of the good match between the two methods observed for seven samples, we felt confident in classifying the entire sample collection by point counting.
The majority of the samples are lherzolites. The samples can be sub-divided in three groups depending on the clinopyroxene (cpx) modal contents: cpx-poor lherzolites (6 < cpx ≤ 8%), lherzolites (8 < cpx < 14%) and cpx-rich lherzolites (cpx ≥ 14%, with LS04 being the most fertile with up to 18% cpx) and harzburgites (up to 4% cpx). This last group is represented by only two samples (LS26 and LS16).
According toMercier and Nicolas (1975), the most common texture shown by the LS xenolith population is the protogranular type and, generally, they do not show any pronounced fabric orientation. No hydrous phases, nor metasomatic textures, glassy patches and sieved-spongy crystals were observed. The peridotite samples are textually remarkably different from those studied byLu et al. (2013)and sam-pled in the same area; the latter have dominantly “porphyroclastic fine-grained microstructures” and evident superimposed metasomatic tex-tures (i.e.: spongy cpx, containing CO2fluid inclusions and secondary minerals). Relatively coarse olivine and orthopyroxene (opx) grains (3–5 mm) show curvilinear crystal boundaries. Due to strain, the crys-tals may be polygonized in medium-grained substructure, with evi-dence of recrystallization (LS06,Fig. 2) from a previous coarse-grained assemblage (LS17,Fig. 2). Large grains of olivine in almost all samples show kink banding. The orthopyroxenes do not show evident degree of deformation, they are texturally homogeneous except for the samples LS01 and LS31, where the grains are particularly coarse (up to 5 mm) and exsolved fine lamellae of cpx were observed (LS31;Fig. 2). Clin-opyroxene and spinel occur as fairly smaller grains (< 3 mm) and blebs either within orthopyroxene or in contact with it (LS26; Fig. 2). In samples LS01, LS06 and LS23, the spinel is anomalously large (up to 4 mm), sometimes aligned and with the typical “holly-leaf” outline. No relevant textural differences were observed from the most fertile to the most refractory lithotype.
3.2. Analytical techniques
Trace element compositions of cpx were obtained by LA-ICP-MS on separate grains fixed in epoxy mounts at the University of Science and Technology of China. Mineral grains were ablated in situ with GeoLas pro ArF excimer laser system with beam wavelength 193 nm at 10 Hz repetition rate and 10 J/cm2 energy per pulse. The ablation crater diameters were about 60 μm in size and the sample aerosol was carried to PerkinElmer DRCII ICP-MS by high purity Helium with flow rate of 0.3 L/min. The analysis consists of 80–100 replicates within 80–100 s and was processed by LaTEcalc software. The commercial software
GLITTER 4.0 (Macquarie University;Griffin et al., 2008) was used for data reduction with NIST 610 silicate glass as external standard and 44Ca as the internal standard using values for CaO from the electron microprobe analyses for clinopyroxene. USGS glass BCR-2G was mea-sured as an unknown in every session as quality control and always yielded values within 10% of the published values. Despite the general primary protogranular characters of all the lithotypes, in any case care was taken to analyze only unaltered grain areas, which was an issue with the clinopyroxenes. Prior to each spot analysis the target area was checked in reflected and in transmitted light to ensure clear, crack-free and unaltered spots. The time-resolved signals for each individual analysis were screened for inclusions or cracks (identified by spikes in the time-resolved signal) and affected areas or complete analyses were discarded accordingly.
Major element compositions of LS peridotite minerals were de-termined using a JEOL Superprobe (JXA 8100) at Nanjing University (China). Detection limits were generally between 0.01 and 0.07 wt%. The operating accelerating voltage was 15 kV and 20 nA and 10 to 20 s counting time for all phases; the beam size was 2 μm. Natural minerals and synthetic oxides were used as standards for calibrations. ZAF pro-cedure was used for data correction.
4. Results
4.1. Mineral chemistry
The average values of major elements for olivine, cpx, opx and spinel. of most LS peridotites are reported inXia et al. (2010, inTables 1–4). In the paper, we report the detail analysis of spots for each mi-nerals in Table S1.
4.1.1. Olivine, orthopyroxene and spinel
Olivine shows in all groups the same textural features and within individual sample has similar inter-grain compositions. Mg# (Mg2+/ (Mg2++ Fe2+) *100, all Fe was assumed as Fe2+) values range from 89.15 (lherzolites, LS22) to 91.90 (harzburgite, LS16). NiO contents vary from 0.21 to 0.48 wt% (weight percent), with, on average, a po-sitive correlation with Mg#. The majority of samples are coherent with the Ni contents of residual olivine after the extraction of partial melts (e.g. Mysen, 1978). Olivine from spinel peridotites typically has 0.31–0.43 wt% of NiO, with an average value of 0.37 wt% (Korenaga and Kelemen, 2000). The NiO contents for Primitive Mantle (PM) oli-vine are 0.28–0.30 wt%. In this range fall the great majority of olioli-vine from cpx-rich lherzolites (Fig. 3).
Orthopyroxene in lherzolites groups and harzburgite shows re-stricted inter-grain compositional variations. Mg# values vary between 89.44 (lherzolites LS22) and 92.44 (harzburgite LS16); Al2O3contents range from 1.63 wt% (harzburgite LS16) to 4.65 wt% (cpx-rich lher-zolites LS04), showing a negative correlation with Mg# (Fig. 4). In-teresting to note, LS opx in cpx-rich lherzolites are all < 4.65 wt% Al2O3contents, in spite of any Mg# values variation (Fig. 4a). An ideal negative correlation between Al2O3 contents and Mg# are observed. Opx shows low to very low TiO2contents (< 0.2 wt%), which decrease with increasing Mg# (Fig. 4b). The low CaO contents (< 0.71 wt%) show no correlation with Mg#, but are roughly correlated with Na2O contents (< 0.18 wt%).
Spinel grains from individual samples are homogeneous within analytical error, with less than 10% intra-grain compositional varia-tions for Cr# (Cr/(Cr + Al)*100) and Mg#. They vary from 10.48 to 49.03 and 66.16 to 79.77, respectively. These two ratios show the usual negative correlation similar to residual abyssal, plagioclase-free peri-dotite (Dick and Bullen, 1984). TiO2contents are less than 0.15 wt% and, just in harzburgite LS26 up to 0.27 wt%. Moreover, the correlation of spinels from cpx-rich lherzolites (LS 23) and lherzolites (LS22, LS20, LS06; LS05), with the bulk rock composition (Al2O3= 1.72–3.37 wt%; TiO2= 0.06–0.16 wt%) is consistent with variable extents of PM melt
Table 1 Mineral modal, temperature and oxygen fucaity estimate of Lianshan peridotites and summary of geochemical parameters. Sample rock type Mode (%) point counting Mode (%) mass balance WR Mg# Mg# ol Temperature Δlog fO2 OH (ppm wt) ol opx cpx sp ol opx cpx sp TBKN (opx-cpx) TNWB (ol-sp) Ballhaus CPX * OPX * WR ** LS16 hz 75 19 4 2 91.83 833 *** 883 −1.1 LS26 hz 72 20 4 4 90.93 837 907 −0.8 57 19 11 LS03 cpx-poor lh 72 20 6 2 70 20 8 2 91.13 *** 91.47 941 905 −0.5 41 17 9 LS12 cpx-poor lh 74 15 8 3 91.75 916 925 −0.2 78 32 17 LS15 cpx-poor lh 69 21 7 3 91.32 858 908 −1.3 LS17 cpx-poor lh 73 18 8 1 75 16 7 1 93.75 *** 91.74 884 1012 −0.6 37 17 9 LS19 cpx-poor lh 66 26 7 1 90.52 856 932 −1.2 89 45 24 LS21 cpx-poor lh 78 13 6 3 91.49 895 894 −1.6 16 0 LS01 lh 55 28 12 5 90.09 849 929 −1.1 55 18 15 LS05 lh 56 29 13 2 60 28 11 1 91.10 *** 90.37 810 998 −0.7 90 34 27 LS06 lh 60 26 11 3 65 24 10 2 91.98 *** 89.84 969 1021 −1.3 73 32 21 LS08 lh 66 20 10 4 90.13 888 973 −1.0 42 15 10 LS09 lh 65 20 11 4 90.30 802 911 −1.2 LS20 lh 74 14 11 1 79 10 10 1 93.27 *** 90.33 1015 876 −1.7 84 34 20 LS22 lh 59 26 13 2 63 24 12 2 90.57 *** 89.23 903 930 −1.6 102 41 31 LS30 lh 62 24 12 2 89.84 970 917 −2.0 92 29 24 LS02 cpx-rich lh 52 30 14 4 89.79 890 982 −1.8 41 13 12 LS04 cpx-rich lh 50 29 18 3 89.55 1001 1004 −0.9 56 28 22 LS07 cpx-rich lh 57 27 14 2 89.97 970 988 −1.3 96 30 28 LS23 cpx-rich lh 60 24 14 2 62 22 15 2 91.42 *** 89.71 1014 875 −2.2 73 32 23 LS24 cpx-rich lh 45 34 17 4 89.89 968 1013 −1.2 80 34 30 LS31 cpx-rich lh 53 27 17 3 89.32 829 940 −1.1 55 16 17 average hz 91.38 ± 0.45 835 ± 2 895 ± 12 −1.0 ± 0.2 57 19 11 cpx-poor lh 91.38 ± 0.86 891 ± 36 929 ± 36 −0.9 ± 0.7 61 ± 24 25 ± 9 15 ± 6 lh 90.02 ± 0.79 901 ± 39 944 ± 68 −1.3 ± 0.7 77 ± 35 29 ± 11 21 ± 11 cpx-rich lh 89.70 ± 0.38 945 ± 116 967 ± 92 −1.4 ± 0.8 67 ± 26 26 ± 13 22 ± 10 * Data from Bonadimann et al. (2009). ** Data from Xia et al. (2010) . *** Whole rock X-ray Florescence (XRF) analyses on a pressed powder dish were carried out at the Department of Physics and Earth Science, University of Ferrara, on advant-X Thermo ARL mass balance: see text for full description.
depletion (Workman and Hart, 2005; Craddock et al., 2013). Spinels from cpx-rich lherzolites are analog to the most fertile spinel of the abyssal field (Craddock et al., 2013).
4.1.2. Clinopyroxene
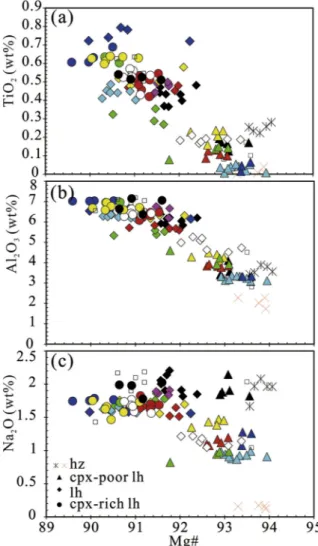
Clinopyroxene in LS xenoliths displays a textural equilibrium with opx, but reflects a larger intra-grain zonation for FeO contents, sensi-tively affecting Mg# (i.e. lherzolites LS22, (Fig. 5). On average Mg# varies between 89.59 (cpx-rich lherzolites LS04) and 94.07 (harzburgite LS16). By contrast, TiO2 and Al2O3 contents are very homogeneous among grains of the same sample. Both oxides show a negative corre-lation with Mg#, with Al2O3contents varying from 7.15 to 1.73 wt% and TiO2from 0.79 wt% to detection limit (Fig. 5a and b). The Al2O3contents in cpx-rich lherzolites do not exceed a cpx value of 7.15 wt%. Na2O contents follow the same geochemical behavior of Al2O3, being buffered at 2.0 wt% in cpx-rich lherzolites (Fig. 5c). This indicates that, at least for the most “fertile” LS lherzolites, the Al2O3(and Na2O) contents result saturated by the bulk peridotite system. In cpx-rich lherzolites, cpx-poor lherzolites LS21 and harzburgite LS16, Na2O is constant at 1.47–1.99 wt %, independent of Mg# values (Fig. 5c). On the other hand, for lherzo-lites, cpx-poor lherzolites and harzburgite LS26, Na2O contents system-atically decrease (down to 0.12 wt%) with increasing Mg#.
Clinopyroxene is the most important phase hosting trace element in anhydrous spinel peridotites. In the majority of LS peridotite xenoliths, the differences between individual analyses of the same mineral are within analytical error, except for LS08 and LS30, which show some heterogeneity in Light Rare Earth Elements LREE (Table 2).
Fig. 6a and b shows REE and incompatible trace element distribu-tions of harzburgite and cpx-poor lherzolites groups. Harzburgite LS16 shows a highly enriched REE pattern from Er to light (L) REE with La about 40 times chondrite and (La/YbCh= 10.8). The sample presents strong Ti and Zr negative anomalies (Ti*=0.33, Ti*=2 × TiPM/ (EuPM+ GdPM) and Zr* = 0.64, Zr*=2 × ZrPM/(NdPM+ SmPM), a feeble Sr positive anomaly (Sr* = 1.85, Sr*=2 × SrPM/(PrPM+ NdPM) and, together with the cpx-poor lherzolites LS15 and LS17. It presents the highest contents of Th and U (15 and 20 times primitive mantle value respectively) of the entire LS xenolith population. By contrast, the other harzburgite (LS26) shows the lowest trace elements (including REE) contents. This sample is characterized by flat REE pattern with (La/Yb)Chabout 0.80 and (Sm/Yb)Chabout 0.6, with Ti, Zr and Sr,
which mimic the same anomalies observed in harzburgite LS16 (Ti* = 0.32, Zr* = 0.41 and Sr* = 1.56). Despite the well-equilibrated textural types, cpx in cpx-poor lherzolites and lherzolites groups records extremely heterogeneous intergroup incompatible trace element con-tents and distributions (Fig. 6a, b, c and d). On the other hand, the five cpx-rich lherzolites show almost identical REE and incompatible trace element profiles (Fig. 6e and f, respectively). Cpx in cpx-poor lherzolites records variable degrees of depletion, with YbChvarying from 3.3 to 6.4 (Fig. 6a). Four samples out of six show positive fractionated REE pat-terns (Fig. 6a, (La/Yb)Ch= 3.25–18.82) and high Th and U contents (ThPM= 6.82–55.17 and UPM= 8.41–24.07;Fig. 6b). Conversely, cpx-poor lherzolites LS12 and LS19 show slightly depleted LREE patterns ((La/Yb)Ch= 0.20–0.65), comparable to the majority of cpx in lherzo-lites group (Fig. 6c) but at lower Heavy (H) REE and highly depleted Th and U contents (ThPM= 0.08–1.18 and UPM= 0.15–2.03). The cpx of this group presents ubiquitous negative Ti (Ti*=0.17–0.42) and posi-tive Sr (Sr*=1.42–4.01) anomalies (Fig. 6b).
Clinopyroxene from lherzolites group has higher HREE contents (YbCh= 8.34–11.48) than cpx-poor lherzolites with homogenously flat profiles, which evolve from highly depleted (LS09-LS05) to slightly enriched (LS20), with (La/Yb)Chratios ranging between 0.04 and 4.42 (Fig. 7c). The LREE highly depleted cpx are associated with the general depletion trend of the most incompatible elements and feeble Zr and Ti negative anomalies (Zr* = 0.25–0.59; Ti* = 0.54–0.56). The pro-gressive LREE increase is accompanied by remarkable Th, U enrich-ments and variable Sr contents (Sr* = 0.64–2.31).
The cpx-rich lherzolites group is characterized by flat HREE and Middle (M) REE, ((Sm/Yb)Ch= 0.79–1.02), with YbChcontents ranging from 10.51 to 13.04 and a regularly decrease from Sm to La (LaCh= 4.7–5.1), with the LS31 cpx showing the steepest decrease (LaCh= 1.39). The cpx of this group contain systematically low Th and U contents always lower than the PM reference value, weak Ti negative anomaly Ti* = 0.52–0.6 and negligible Zr negative and Sr positive anomalies.
4.2. Mineral equilibrium, temperature, oxygen fugacity and water content estimates
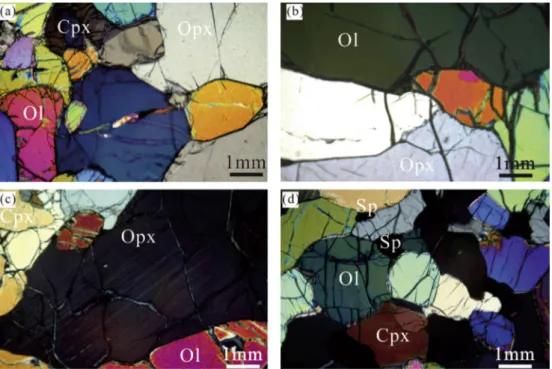
The LS peridotites are texturally well equilibrated with grain boundaries slightly curved or with 120° triple junctions, geometry of Fig. 2. Cross polarized light photo-micrographs of LS xenoliths illustrating the petrographic features of the four lithop-types. (a) medium/coarse grained lherzo-lites LS16 showing polygonized cpx, olivine and opx grains; (b) coarse-grained mineral assemblage of the cpx-poor lherzolites LS17-scale as in (a); (c) exsolved fine lamellae of cpx in opx in cpx-rich lherzolites LS31- scale as in (a); (d) medium grained harzburgite LS16 with cpx and spinel reflecting low en-ergy geometry.
Table 2 Trace element concentrations in ppm for clinopyroxenes of Lianshan peridotite samples. Sample LS16 1σ LS26 1σ LS03 1σ LS12 1σ LS15 1σ LS17 1σ LS19 1σ LS21 Rock type hz cpx-poor lh n. 5 5 6 5 5 4 8 6 Ba 0.072 0.084 0.089 0.045 0.071 0.068 0.023 0.002 1.881 3.136 8.596 ##### 0.186 0.189 0.518 Th 1.206 0.150 0.010 0.003 0.580 0.055 0.007 0.006 4.689 0.380 4.263 0.542 0.100 0.031 1.205 U 0.401 0.042 0.002 b 0.177 0.016 0.006 0.006 0.569 0.051 0.505 0.058 0.043 0.022 0.398 Nb 0.124 0.021 0.064 0.013 0.790 0.089 0.137 0.024 0.251 0.079 0.242 0.030 0.217 0.030 0.177 Ta 0.067 0.019 0.010 0.004 0.002 0.003 0.012 0.008 0.023 0.012 0.013 0.004 0.016 0.007 0.077 La 10.39 0.27 0.34 0.03 3.92 0.90 0.27 0.04 12.96 6.61 10.81 3.46 0.95 0.21 11.60 Ce 22.69 1.22 0.84 0.04 4.64 1.40 0.97 0.03 15.98 7.73 13.17 1.87 2.21 0.38 28.16 Pr 2.493 0.179 0.119 0.020 0.391 0.093 0.189 0.014 1.481 0.393 1.368 0.066 0.346 0.048 3.408 Sr 319.3 15.6 14.9 0.9 109.7 24.1 63.1 0.7 223.9 171.6 172.4 75.3 47.7 1.1 339.0 Nd 9.91 0.68 0.64 0.07 1.60 0.25 1.16 0.14 5.03 1.02 5.20 0.27 2.03 0.11 13.90 Zr 41.6 1.0 1.9 0.2 4.2 0.2 2.5 0.1 45.5 3.0 41.6 1.4 23.1 0.6 38.7 Hf 1.088 0.099 0.057 0.028 0.186 0.047 0.133 0.024 1.147 0.204 1.018 0.062 0.620 0.048 0.872 Sm 1.891 0.132 0.165 0.035 0.539 0.080 0.489 0.032 0.837 0.077 0.724 0.049 0.787 0.082 2.747 Eu 0.690 0.029 0.069 0.013 0.245 0.024 0.212 0.028 0.197 0.031 0.184 0.023 0.389 0.029 0.941 Ti 1510 40 162 13 670 35 750 17 503 11 247 5 1221 100 1033 Gd 1.69 0.08 0.22 0.02 0.96 0.12 0.93 0.12 0.58 0.09 0.60 0.07 1.26 0.07 2.27 Tb 0.241 0.027 0.034 0.006 0.178 0.019 0.190 0.017 0.093 0.010 0.088 0.018 0.243 0.012 0.322 Dy 1.38 0.06 0.25 0.04 1.34 0.12 1.43 0.10 0.62 0.10 0.60 0.02 1.68 0.12 1.61 Y 7.0 0.1 1.6 0.1 8.0 0.1 8.8 0.1 3.4 0.1 3.4 0.1 10.1 0.3 8.1 Ho 0.272 0.020 0.061 0.009 0.308 0.012 0.328 0.013 0.135 0.009 0.130 0.020 0.386 0.024 0.307 Er 0.687 0.017 0.166 0.023 0.839 0.095 1.004 0.043 0.378 0.045 0.366 0.009 1.129 0.033 0.769 Tm 0.093 0.004 0.038 0.006 0.125 0.004 0.149 0.003 0.069 0.006 0.063 0.006 0.155 0.006 0.101 Yb 0.688 0.062 0.305 0.045 0.864 0.078 0.964 0.059 0.494 0.065 0.511 0.023 1.050 0.089 0.720 Lu 0.103 0.004 0.048 0.006 0.111 0.009 0.133 0.011 0.088 0.010 0.084 0.009 0.163 0.009 0.118 Sample 1σ LS01 1σ LS05 1σ LS06 1σ LS08 1σ LS09 1σ LS20 1σ LS22 1σ Rock type lh n. 5 10 4 10 7 4 9 Ba 0.339 0.041 0.018 0.121 0.075 0.125 b 0.260 0.178 0.786 1.334 0.031 b 0.254 0.320 Th 0.081 0.048 0.014 0.004 0.003 0.015 0.009 0.499 0.210 0.002 b 0.744 0.040 0.060 0.011 U 0.052 0.020 0.009 0.018 0.018 b.d. 0.286 0.363 b.d. 0.183 0.028 0.014 0.009 Nb 0.080 0.318 0.030 0.022 0.009 0.106 0.029 0.176 0.109 0.010 b 0.000 0.067 0.149 0.028 Ta 0.033 0.027 0.011 0.004 0.004 0.020 0.015 0.025 0.029 0.002 0.090 0.023 0.059 0.010 La 0.76 0.97 0.05 0.12 0.02 1.13 0.04 2.85 1.93 0.04 0.01 8.98 0.12 3.24 0.24 Ce 2.84 3.03 0.22 0.88 0.09 4.08 0.12 4.80 3.13 0.13 0.02 20.80 0.30 10.36 0.34 Pr 0.495 0.534 0.034 0.267 0.033 0.711 0.029 0.646 0.189 0.031 0.008 2.696 0.088 1.757 0.063 Sr 56.4 60.3 1.5 27.0 2.6 77.0 1.3 119.0 60.7 3.3 0.6 210.3 0.8 91.3 2.0 Nd 2.23 3.37 0.23 2.19 0.25 4.26 0.11 3.45 0.39 0.31 0.03 12.28 0.47 9.55 0.44 Zr 1.4 23.7 0.3 14.6 1.6 32.4 0.7 25.7 8.5 1.5 0.1 45.8 21.3 38.2 0.6 Hf 0.078 0.709 0.078 0.648 0.113 0.983 0.095 0.778 0.233 0.118 0.017 0.639 0.101 1.279 0.070 Sm 0.373 1.501 0.112 1.252 0.217 1.773 0.118 1.429 0.170 0.389 0.051 2.937 0.278 2.916 0.150 Eu 0.154 0.584 0.056 0.572 0.044 0.666 0.068 0.584 0.073 0.197 0.025 1.052 0.075 1.098 0.051 Ti 58 2465 51 2590 131 2853 33 2398 87 994 33 1474 12 4325 152 Gd 0.25 2.27 0.19 2.27 0.30 2.39 0.07 2.12 0.12 0.98 0.08 2.92 0.18 3.53 0.26 Tb 0.014 0.423 0.018 0.450 0.054 0.437 0.029 0.395 0.038 0.233 0.030 0.493 0.020 0.582 0.036 Dy 0.08 2.91 0.05 3.18 0.43 3.09 0.16 2.70 0.28 1.81 0.05 2.85 0.24 3.72 0.13 (continued on next page )
Table 2 (continued ) Sample 1σ LS01 1σ LS05 1σ LS06 1σ LS08 1σ LS09 1σ LS20 1σ LS22 1σ Y 0.6 16.2 0.3 18.3 1.8 17.2 0.5 15.4 0.8 11.9 0.3 14.6 0.5 20.5 0.5 Ho 0.017 0.656 0.043 0.730 0.086 0.675 0.033 0.633 0.052 0.416 0.039 0.576 0.036 0.795 0.037 Er 0.036 1.810 0.068 2.064 0.290 1.812 0.107 1.706 0.181 1.366 0.090 1.445 0.052 2.138 0.148 Tm 0.010 0.263 0.009 0.300 0.042 0.265 0.018 0.251 0.024 0.204 0.013 0.209 0.008 0.304 0.012 Yb 0.081 1.673 0.063 2.039 0.291 1.737 0.042 1.627 0.097 1.403 0.142 1.459 0.073 1.979 0.117 Lu 0.021 0.242 0.005 0.281 0.038 0.247 0.013 0.235 0.022 0.212 0.013 0.211 0.012 0.292 0.021 Sample LS30 1σ LS04 1σ LS07 1σ LS23 1σ LS24 1σ LS31 1σ Rock type lh cpx-rich lh n. 11 7 6 4 12 11 Ba 0.731 0.374 0.058 0.003 0.049 0.025 0.055 0.047 0.814 0.422 1.044 0.622 Th 0.201 0.071 0.015 0.009 0.011 0.007 0.015 0.009 0.017 0.009 0.034 0.050 U 0.072 0.041 0.021 b b.d. b.d. 0.022 0.018 0.010 0.006 Nb 0.182 0.032 0.118 0.037 0.119 0.031 0.109 0.019 0.080 0.029 0.073 0.059 Ta 0.012 0.006 0.017 0.013 0.006 0.006 0.013 0.005 0.014 0.010 0.006 0.003 La 1.37 0.44 1.08 0.06 1.11 0.06 1.18 0.04 1.23 0.05 0.33 0.04 Ce 2.85 0.32 4.01 0.10 4.13 0.11 4.27 0.03 4.46 0.24 1.77 0.21 Pr 0.487 0.020 0.714 0.030 0.736 0.016 0.770 0.018 0.803 0.035 0.429 0.039 Sr 68.9 7.4 81.9 1.0 79.0 0.9 84.5 1.2 85.2 2.5 55.4 3.6 Nd 3.26 0.34 4.48 0.27 4.42 0.15 4.65 0.26 4.96 0.35 3.30 0.30 Zr 24.3 0.6 35.0 0.7 33.8 1.2 34.1 0.6 35.2 1.0 27.6 1.1 Hf 0.787 0.053 1.105 0.072 1.026 0.117 0.964 0.089 1.087 0.107 0.987 0.167 Sm 1.290 0.133 1.860 0.060 1.784 0.108 1.818 0.190 1.901 0.157 1.579 0.171 Eu 0.585 0.041 0.762 0.015 0.728 0.036 0.766 0.064 0.787 0.048 0.726 0.092 Ti 2460 51 3498 22 2882 66 3554 77 3554 133 3110 84 Gd 2.09 0.11 2.70 0.08 2.47 0.13 2.73 0.13 2.68 0.18 2.76 0.40 Tb 0.404 0.024 0.500 0.017 0.453 0.025 0.498 0.008 0.499 0.032 0.500 0.046 Dy 2.93 0.18 3.44 0.10 3.10 0.10 3.38 0.09 3.39 0.16 3.61 0.32 Y 16.7 0.2 19.5 0.4 17.6 0.7 19.1 0.4 19.5 0.4 20.3 0.5 Ho 0.652 0.025 0.754 0.035 0.662 0.025 0.728 0.010 0.764 0.042 0.806 0.052 Er 1.845 0.088 2.099 0.074 1.920 0.088 2.078 0.059 2.142 0.113 2.210 0.198 Tm 0.263 0.020 0.306 0.012 0.268 0.010 0.302 0.008 0.313 0.025 0.327 0.037 Yb 1.718 0.109 2.027 0.103 1.787 0.094 1.992 0.064 2.072 0.116 2.217 0.272 Lu 0.252 0.024 0.285 0.015 0.253 0.019 0.292 0.018 0.296 0.033 0.316 0.039 Rock type as in Table 1 . n.: numbers of averaged samples when variations are within the analytical errors. b.d.: below detection limits. b: just one cpx available for the element average. See text for full description.
low energy for mineral arrangement at mantle depth. The textural equilibrium was chemically tested by Fe-Mg distributions among mi-nerals (Fig. 7), with the equilibrium lines derived from equations ex-perimentally obtained byBrey and Köhler (1990) and Liermann and Ganguly (2003)between silicate minerals and spinel. The equilibrium lines were calculated at pressure of 20 Kbar, with T of 800, 900 and 1100 °C. Taking into account Fe/Mg equilibrium models for olivine-opx and olivine-spinel pairs, the LS cpx-rich lherzolites reflect the ideal Fe/ Mg distribution at the temperature and pressure reference conditions (Fig. 7a and b). With respect to Fe/Mg opx-cpx equilibrium lines (Fig. 7c), “disequilibrium” is evident for the two harzburgite, cpx-poor lherzolites LS17 and lherzolites LS05, which lay outside the equilibrium region, towards low temperatures, with respect to the validity of the experimental formulations. Considering the different Fe-Mg diffusion rates among peridotite minerals, temperatures were calculated
(pressure arbitrarily assumed as 20 Kbar) with bothBrey and Köhler (1990, TBKN) andO’Neill and Wall (1987), as modified byBallhaus et al. (1991, TNWB) formulae, based on Fe and Mg exchanges between opx-cpx and olivine-spinel respectively (Table 1). The results of the two methods, as expected, large T differences, generally exceeding the error of the methods ( ± 30 °C). Besides, the LS xenoliths coherently record increasing temperatures from cpx-poor lherzolites and harzburgite (TBKN= 833–895 °C; TNWB= 883–894 °C) to cpx-rich lherzolites (TBKN= 829–1001 °C; TNWB= 875–1004 °C).
Oxygen fugacity (fO2) values were obtained from the equilibrium: 6Fe2SiO4 (olivine) + O2 (fluid) = Fe3O4 (spinel) + 3Fe2Si2O6 (opx) based on the semi-empirical oxygen barometer calibrated byBallhaus et al. (1991), using XFein spinel as Fe3+/total R3+, pressure of 20 Kbar and TNWB. The intrinsic errors of the formula as well as the errors de-rived by the Fe3+calculated by the stoichiometry of minerals are as Table 3
Parameters used for modelling original H2O contents in bulk rocks and cpx.
Partition coefficients ol/melt ref (opx/melt)* ref (ol/opx)** ref (ol/cpx)* ref (cpx/opx)* ref
Kd H2O 0.0014 2 0.018 2, 3 0.12 1 0.06 1 2 1
H2O (wt%) of primary melts min max(off-craton) max (on-craton)
0.68 1.5 2.6 4
Modes Ol Opx Cpx Sp
PM 0.52 0.27 0.18 0.03 5
Melt −0.05 0.08 0.87 0.10 6
References: 1 =Warren and Hauri (2014); 2 =Hirschmann et al. (2009); 3 = O'Leary et al. (2010); 4 =Luth (2013)and reference therein; 5 =McDonough and Sun (1995); 6 =Herzberg (2004).
* Al2O3in pyrxene from 4 to 6 wt%.
** Compilation of experiment and natural samples. Table 4
Rock and clinopyroxene water concentration in the upper mantle.
H2O contents of primary melts (wt%) From off-craton lithospheric mantle 0.68–1.5
From on-craton lithospheric mantle 2.6
PM cpx
H2O concentration of PM and cpx (ppm) (F = 3%) Minimum estimate 328 680
Maximum estimate (off-craton) 722 1500
Maximum estimate (on-craton) 923 2338
(F = 8%)* Minimum estimate 653 1356
Maximum estimate (off-craton) 1440 3190
Average 813 1813
* F = 8% PM on-craton maximum estimates has not petrological meaning.
Fig. 3. Compositional variation of olivines in LS mantle xenoliths; Mg# [Mg/(Mg + Fe2+) *100] versus NiO wt.% reflects, on the whole, a general positive cor-relation from cpx-rich lherzolites to cpx-poor lherzolites (and harzburgite).
discussed inBonadiman et al. (2014).
The fO2 values of LS samples, in terms of difference from the fayalite-magnetite-quartz buffer (ΔFMQ), always result below FQM buffer (ΔFMQ = −0.2 to −2.2), with the highest values recorded in the harzburgite and cpx-poor lherzolites groups (ΔFMQ range from −0.9 ± 0.7 to −1.0 ± 0.2) and the lowest values recorded in the cpx-rich lherzolites group (ΔFMQ = −1.4 ± 0.5,Table 1).
To better frame the volatile circulation in the LS mantle domain, we also reported the water contents measured in the nominally anhydrous minerals (olivine, opx and cpx) of these samples (Table 1). Detailed discussions of the data are reported inBonadiman et al. (2009) and Xia et al. (2010). On the whole, the water contents (H2O wt. %) in opx and cpx range from 13 to 45 ppm and from 37 to 102 ppm, respectively; it is negligible in olivine (in all samples it is always below the detection limits). In order to minimize the effect of H diffusion in ol, the parti-tioning between olivine, opx and cpx was used to calculate the whole-rock water contents (Bonadiman et al., 2009; Xia et al., 2010). This calculation refers to the modal contents (Table 1), and to KdH2Ool/opx and KdH2Ool/cpx, based on a combination of available data from natural and experimental samples (Hauri et al., 2006; Novella et al., 2014; Tenner et al., 2009; Warren and Hauri, 2014), and assigns, as expected, the wettest lithology to the cpx-rich lherzolites (on average 22 ± 10 ppm;Table 1).
5. Discussion
5.1. Melting models
The abundance of the most fusible elements in the LS minerals systematically varies with Mg#. Such trends are usually interpreted as indicators of residues from different degrees of partial melting and melt extraction from a fertile lherzolite source.
The melting degrees (F) are provided by the major element mineral compositions following the experimental melting results in the CSMA (Fe) peridotitic system (Herzberg, 2004; Bonadiman and Coltorti, 2011). Theoretical melting curve for cpx was obtained for Si, Al, Fe, Mg
and Ca from theMcDonough and Sun (1995)primitive mantle major element composition, using the mass-balance calculation between the four peridotite phases (PM bulk composition olivine:opx:cpx:-spinel = 52:27:18:3) and progressive melting residua derived from the experimental results of Herzberg (2004). The curve was calculated considering the ideal basaltic melting behavior in the pressure range of the anhydrous spinel stability field (10–20 Kbar). In this model, the cpx is consumed at ∼30% of PM melting. Among the basaltic elements, Al, HREE (and Y) are the most sensitive to the melting degree (Ionov and Hofmann, 2007), thus Al2O3 versus MgO and YbPMversus YPM were chosen to describe the melting process (Fig. 8a and b). Since a complete data set (major and trace elements) is provided for cpx only, we refer to this phase to evaluate the residual character and processes of the LS mantle domain. In Al2O3versus MgO diagram LS cpx grade towards the hypothetical melting curve with the harzburgite group coherently in-dicating the highest melting degrees (18–24%) and lherzolites -group/ cpx-rich lherzolites groups showing the lowest (4–15% and 0–9%). In the spinel stability field, the Al2O3contents of cpx at the beginning of melting (F < 10%; Al2O3= 7.00–6.57 wt%) are not able to clearly discriminate in the curve a reduction of modal contents from 18% (PM) to 14% melting (Fig. 8a). In fact, the whole cpx-rich lherzolites group (modal cpx = 18–14%) coherently plots in this region of the curve. On the other hand, theoretically, a rapid Al2O3decrease is expected for F exceeding 10%. According to the model, the cpx of lherzolites group, with cpx modal contents confined in the range 8–14%, should reflect a Fig. 4. Plots of Al2O3(a) and TiO2(b) versus Mg# for orthopyroxenes. The line
in (a) indicates the buffered Al2O3contents for cpx-rich lherzolites group. Symbols and color code as inFig. 3legend; small open square: Lianshan peri-dotites fromLu et al. (2013).
Fig. 5. Plots of TiO2(a), Al2O3(b) and Na2O (c) versus Mg# for clinopyroxenes. The lines in (b) and (c) indicate the buffered Al2O3and Na2O contents for cpx-rich lherzolites group. Symbols and color code as inFig. 3legend; small open square: Lianshan peridotites fromLu et al. (2013).
residuum after theoretical melting degrees between ∼16 and ∼12%, but they span between 15 and 4% F (Fig. 8a). The same occurs for the cpx-poor lherzolites group (cpx = 6–8% corresponding to an ideal PM melting degree in the range of ∼20–22% F), which are placed in the curve between 16 and 20% F (Fig. 8a). Only LS15 and LS17 represent a residuum (F ∼ 20% PM melting) coherent with the observed cpx modal contents. In this model the cpx of two harzburgites (cpx = 4%) present higher Al2O3and lower MgO contents to be considered a direct melting of the PM source.
These results were compared to those obtained applying the more conventional near-fractional melting numerical model Zou (1998)to the cpx HREE (and Y) compositions (i.e. Johnson et al., 1990; Hellebrand et al., 2002; Liang and Peng, 2010) in the spinel stability field. As for the Al2O3-MgO model, the starting fertile cpx composition is calculated using the PM composition ofMcDonough and Sun (1995), cpx = 18%, and model parameters as inBonadiman et al. (2005) and Faccini et al. (2013).
A calculation approximation to the simple ideal, fractional melting equation ofJohnson et al. (1990)is applicable to ≤0.1 residual por-osity (Zou, 1998). In fact, the HREE (Yb) and Y of the cpx of the entire LS suite were reproduced by the simplest fractional melting model (Fig. 8b). In agreement with the Al2O3-MgO melting model, the esti-mated degrees of partial melting for the cpx-rich lherzolites are less than 3%, leaving an estimated residue which contains a modal clinopyroxene comparable to that measured in the samples (cpx = 14–18%). LS31 represents (trace and major melting modeling) the most fertile sample of the entire collection with the cpx modal content close to PM values (18%). The model assigns to the lherzolites-group (cpx = 10–13%) a melting degree spanning between F < 3%
and ∼7%, slightly lower than that predicted by the Al2O3-MgO model. LS05 and LS22 (cpx = 13%) have Yb and Y contents close to the PM values (Fig. 8b) approaching the modal composition of the cpx-rich lherzolites group. Except for LS15 and LS17, which represent a re-siduum (∼17% PM melting) consistent with their cpx contents (7% and 8% respectively), and analogously to what observed for the major element melting model (Fig. 8a), the cpx-poor lherzolites contain cpx with Yb and Y contents corresponding to those of a residuum after 8–13% PM melting, but the real abundance is lower than that theore-tically predicted (6–8% vs. 15–12% F). The harzburgite HREE (and Y) reproduce a residuum after a maximum of 21% degree of melting of PM cpx, too low with respect to the measured cpx modal content (4%), which would suggest a F > 25%. Following the fractional melting model at 4% of modal cpx, in fact, YbPM should be as low as ∼0.15–0.20 (F > 25%, rapidly approaching the cpx disappearing) with respect to the real YbPMcontent of LS26 (0.52–0.70).
To summarize, both the cpx major and trace element melting models, independently indicate that only cpx-rich lherzolites represent extremely fertile (close to the PM) mantle fragments fitting with the proper lithotypes (i.e. cpx modal contents).
Applying the same melting models (major and trace) to the cpx of Lu et al. (2013)xenoliths, it is evident that for all their studied samples the residual character was modified by enrichment events (Fig. 8a). In particular, cpx modal contents vs. Al2O3and Y (and Yb) contents cannot be explained by any melting model, including the one proposed by the authors (Hellebrand et al., 2002). These peridotites may have been metasomatized, and resemble the lherzolites and cpx-poor lherzolites groups of our xenolith collection.
Fig. 6. REE and trace element patterns of cpx in harzburgite and cpx-poor lherzolites groups (a and b), lherzolites group (c and d) and cpx-rich lherzolites group. Chondrite and Primitive Mantle Normalization values fromMcDonough and Sun (1995). Symbols and color code as inFig. 3legend.
5.2. Metasomatism
As shown in the previous section, most of the clinopyroxenes of lherzolites, cpx-poor lherzolites and harzburgite reflect anomalous Al2O3and REE enrichments with respect to the contents theoretically expected for residual cpx according to the melting models (Fig. 8). In terms of Refractory Lithophile Element (RLE), the high LREE, Th, and U contents, coupled with variable Sr enrichments of cpx in these litho-types (Fig. 6), indicate that a variably depleted mantle sector interacted with metasomatic melts. Lu et al. (2013) report abundant CO2fluid inclusions in spongy cpx, which present convex-down REE patterns and high contents of highly compatible elements (Th, U, Sr and LREE). The authors argue that a refractory mantle system interacted with silicate-to carbonatitic-melt/s at the time of the host basalt entrapment. In our sample collection the absence of carbonate, hydrous mineral phases (i.e. mica, amphibole or apatite), as well as metasomatic textures (i.e. spongy and/or secondary crystals, and/or glassy patches), rules out melt circulation at depth during, or before, the host basalt eruption (Coltorti et al., 1999; Ionov et al., 2002). Since no modal metasomatic minerals were observed and all lherzolites, cpx-poor (and harzburgite)
lithotypes are texturally well equilibrated, the geochemistry (major and trace elements) of clinopyroxenes is the solely indicator of the meta-somatic event(s) occurred in the LS mantle domains. Trace element patterns of hypothetical liquids in instantaneous equilibrium with the most enriched cpx (harzburgite and cpx-poor lherzolites) were calcu-lated with Dcpx/melt using the partition coefficients of Ionov et al. (2002). The theoretical compositions reflect the imprinting of the cir-culating melt, since in this xenolith population cpx is the sole mineral that can accommodate the incoming trace element budget (Fig. 9). The resulting melts do not show any correspondence with the compositional range of basalts from the region (Chung 1999; Zou et al., 2000), in particular regarding the remarkable Nb (and Ta) and Ti negative anomalies that were not observed in the Subei Basin basalts (Fig. 9).
5.3. Modeling the original water contents
Under the assumption that the Earth has a chondritic RLE compo-sition and that the H in the PM is associated with O in hydroxyl (OH) in minerals or, in minor amounts, in the form of structurally bound water molecules (H2O) (e.g.McDonough and Sun, 1995; Lodders, 2003; Drake and Righter, 2002; Kleppe and Jephcoat, 2006), the PM total abun-dance of H2O is estimated in the range of 850–1100 ppm wt. (Mottl et al., 2007; Palme and O’Neill, 2003). These values were determined by considering the hydrosphere (oceans, pore water in sediments and ice; 1.6 × 10²¹kg) as the water originally contained in the 50% de-gassed mantle (Mottl et al., 2007) and a subsequent ingassing Fig. 7. Fe/Mg equilibrium diagrams for olivine vs opx (a), olivine vs. spinel (b)
and opx vs. cpx (c). In (a) and (c) the equilibrium lines are fromBrey & Köhler (1990)at 800, 900 and 1100 °C. In (b) KDSpinel-Olivine is Fe-Mg partitioning between olivine and spinel determined on the basis of the Liermann and Ganguly (2003)model. (Fe/Mg) indicates Fe2+/Mg, as calculated by stoichio-metry for each mineral. Symbols and color code as inFig. 3legend.
Fig. 8. Clinopyroxene Al2O3vs. MgO (a) and Y and Yb contents (b) compare to calculated melting models in LS peridotitic samples. In (a) the Al2O3and MgO contents of PM were calculated based on the McDonough and Sun (1995) mantle model. Model parameters as inBonadiman et al. (2005) and Faccini et al. (2013). In (b) fractional melting model within spinel stability field based onZou (1998). See text for further explanation. Tick marks on curves indicate partial melting percentages (F), numbers in brackets are ideal cpx modal con-tents at F. Symbols and color code as inFig. 3legend.
contribution by the recycled crust into the mantle (ca. 200 ppm; Hirschmann, 2006), since the beginning of the Earth’s evolution (Palme and O’Neill, 2003; Arevalo et al., 2009). Alternatively, for a non-chondritic Earth’s model (i.e. O'Neill and Palme, 2008), which esti-mates that K abundances in the mantle were only about half of that expected from the chondritic model,40Ar (as mainly derived by40K) in the atmosphere would correspond to degassing of the entire mantle, not just 50% of it. Consequently, the PM water abundance would be 425–675 ppm, including the contribution of the recycled crust in the mantle (Palme and O’Neill, 2003).
A quantitative insight into the mantle H2O contents may also be obtained by measuring the water contents in mantle-derived magmas. This approach would immediately confine the discussion to the Earth’s upper mantle, but if referring to the whole mantle convection, it can ultimately reflect the PM water contents. Taking into account the in-traplate mantle-derived melts in both oceanic and continental settings, the water contents range from 0.05 to 1.60 wt% and from 1.50 to 2.60 wt%, respectively (Luth, 2014; White and Klein, 2014and refer-ences therein). These values do not include volatile-rich silicate magmas such as kimberlites (H2O = 5–12 wt%) and lamprophyres (H2O = 5–7 wt%), which are far from being the most common upper mantle derived melts (Kavanagh and Sparks, 2009; Luth, 2014 and reference therein). In our modelling we consider that 0.68–1.50 wt% could be a reasonable range of water contents in primitive mantle-de-rived melts; 2.60 wt% is indicated as the value representing the water contents of primary melts from on-craton lithospheric mantle (Peslier et al., 2012; Doucet et al., 2014). Based on experimentally determined H2O partition coefficients between mantle minerals and basic melts (Table 3;Hirschmann et al., 2009; O’Leary et al., 2010), and referring to the PM mineral proportions as described in “Section 5.1 Melting models” we can roughly estimate that the water contents of a fertile mantle, close in composition to the PM, are in the range 328–1440 ppm (Table 4). This range is obtained assuming that the PM source produced alkaline primitive magmas at partial melting degree (F) varying from 3 to 8% (Table 4). As spinel represents a negligible modal portion and contains no water, and considering the DMin/Min
H2O between olivine/opx and olivine/cpx, the cpxPM has H2O in the range of 680–3190 ppm (Table 4). This range corresponds to measured H2O contents in both natural (H2O = 600–960 ppm; Li et al., 2008; Wade et al., 2008) and experimental cpx (Al-bearing diopside (Di70-90CaTs30-10): H2O = 2600–1200 ppm;Gavrilenko et al., 2010).
The calculation of H2O contents of residual peridotite (or its cpx), determined by the application of conventional REE melting models, intrinsically has a large source of error. In fact, H2O does not follow the same melting model as REE, as erroneously supposed, considering the relatively constant H2O/Ce ratio in cpx (and whole rock) of mid-ocean ridge basalts (MORBs;Michael, 1995; Hauri et al., 2006; Green et al., 2010; Xia et al., 2013; Hao et al., 2014, 2016). Conversely, peridotites
show a considerable range of H2O/Ce ratios at both mineral and bulk rock levels. This discrepancy is partially due to the variable petrological models which link the mantle source to its basic melts (i.e. polybaric melting histories and fluid refertilization), but the principal source of error is due to the mineral/melt and bulk/melt H2O partition coeffi-cients applied (Hirschmann, 2006; Warren and Hauri, 2014). The var-ious set of published mineral/melt H2O partition coefficients are not always internally consistent: i.e. DCpx/Melt
H2O /DOpx/MeltH2O ≠ DCpx/Opx H2O (Warren and Hauri, 2014). This discrepancy is likely due to the dif-ferent reactivity of water in minerals during melting. In fact Dmin/melt
H2O also depends on the mineral composition, which changes at higher degrees of melting (Zou, 1998), thus H2O activities are not the same as those imposed by the full peridotite assemblage as applied in the equation of Novella et al. (2014). In order to better frame the H2O behavior of cpx during melting, we modeled the melting of the initial cpx (cpxPM) using the fractional melting equation ofShaw (1970), but calculating the global distribution coefficients (Dmin/melt
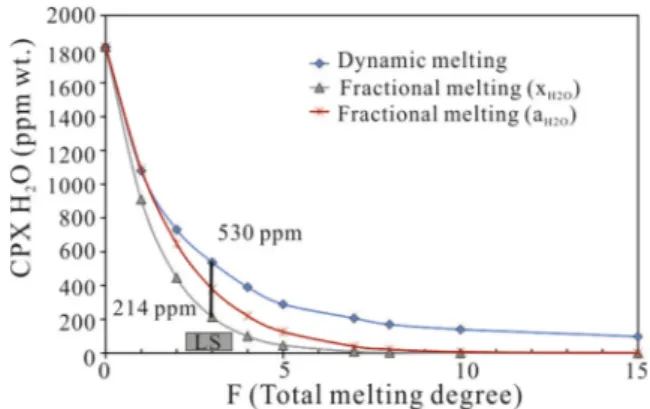
H2O and Pmin/meltH2O ) considering the activity model (Zou, 1998; Till et al., 2010). On the basis of major and trace (lithophile) element cpx modelling, the LS cpx-rich lherzolites correspond to a residuum after a maximum of 3% of PM fractional (≈bulk) melting in the spinel stability field. In terms of H2O contents these cpx residua should contain H2O in the range of 214–530 ppm, depending on the model applied (Fig. 10). The cpx H2O contents of LS cpx-rich lherzolites (41–96 ppm) are, on average, one order of magnitude lower than those of theoretically expected at 3% F (214–530 ppm). Taking into account the measured H2O contents in cpx from cpx-rich lherzolites, an unrealistic 7% of F would be envisaged for this lithotype (Table 1;Fig. 10).
The low to very low H2O contents should discharge the potential hydrogen addition from the host magma. The absence of water addition to the xenolith from the host magma is coherent with the mechanism of exhumation by fast ascent of the magma (several hours/days according to estimates of alkaline magma ascent rate) leaving no time for sig-nificant exchange of water with the entrapped xenoliths. Moreover, the homogenous H2O content within single pyroxene grains and the equi-librium H2O partitioning between the clinopyroxene and orthopyr-oxene (Bonadiman et al., 2009; Xia et al., 2010) disclaim a potential H-loss during the xenolith ascent. This difference outmatches the model uncertainties, therefore the measured H2O in cpx (at least in the center of the mineral grains) represent the H2O contents they had in the mantle prior to sampling by the host basalt.
5.4. Heat and H diffusivities
H diffusivities in mantle minerals (ol, cpx and opx) are very high Fig. 9. Plot of PM-normalized incompatible trace element patterns for the
calculated instantaneous equilibrium melts. Basalts from Subei basin (Chung, 1999and Zou, 2000) are plotted for comparison.
Fig. 10. Comparison of LS cpx H2O contents (grey box) with the ideal cpx H2O contents as residuum after 3% PM pure fractional (composition (X) and activity (a) distribution coefficient models) and dynamic (close to batch for F < 2%) melting models. At F = 3% (melting degree estimated for cpx-rich lherzolites), theoretical residuum cpx should contain H2O in the range of 214–530 ppm. See text for further explanations.
(D = 10−10–10−11m2/s at 900 °C;Ingrin and Blanchard, 2006; Farver, 2010; Bizimis and Peslier, 2015), and mainly controlled by volume diffusion (vacancy diffusion) through the crystal lattice (Farver, 2010). In turn, cation diffusion processes mainly control the trace element (REE) abundances in olivine (and pyroxene). Cation diffusion through minerals is slow (REE in diopside: 8 log units lower than H), conse-quently, the solid/melt interactions (metasomatic event) would pro-duce a chemical zoning (i.e. REE) of minerals which characterizes the solid until a new mantle process occurs. Moreover, despite the large differences in RLE contents of LS pyroxenes, the T° values from cpx-poor lherzolites (and harzburgite) to cpx-rich lherzolites, are in the narrow interval of 200 °C and never exceed 1021 °C (Table 1).
The thermal diffusivity of mantle rocks is known to remain almost constant (D = 4–7 × 10⁻⁷m2/s;Gibert et al., 2003) when measured in polycrystalline systems between 750 and 1350 °C, with local increase due to the reactive processes. The pressure dependence is expected to be low (Katsura, 1995; Gibert et al., 2003). Applying the simplest dif-fusion equation ofCrank (1975), valid for homogeneous diffusion rate on a finite isotropic plane medium at constant diffusion coefficient, we calculated that the residuum cpx (500 µm length) after 3% of PM melting progressively loses its initial H2O content (CoH2O214–530 ppm; Fig. 10) to reach 50 ppm (average of measured contents) in 40.000–70.000 years. If we extrapolate this punctual data to a column of mantle sector as large as the area of xenolith samples (1 Km2), we can estimate homogenous H2O contents (50 ppm) in a time span of 1.5–2.4 My. Taking into account the reduction of the parameters used for the calculations, these values contain large uncertainties; nevertheless, they give important information on the time scale of the dehydration pro-cess.
6. Conclusions
Within the LS xenoliths population, the cpx-rich lherzolites group shows the most fertile compositions: Mg# and NiO contents of olivine similar, on average, to the OlPMestimates (McDonough and Sun, 1995); the Al2O3,TiO2and Na2O contents of pyroxenes and Cr# of spinel are also close to the ideal PM values. The melting degrees estimated by clinopyroxene major and trace elements are very low (always < 3%), with coherent cpx modal contents (Fig. 8). Cpx trace element and REE patterns indicate no metasomatic effects for this lithotype.
In turn, harzburgite together with cpx-poor lherzolites (and lher-zolites) reflect variable enrichments superimposed on a variably de-pleted (8–23% of partial melting) mantle. The metasomatic event/s introduce Al2O3, LREE, even HREE, modifying the expected cpx/whole chemistry residual relationship. The reconstructed trace element pro-files (Fig. 9) of the hypothetical metasomatic melt/s show negative Ti, Nb-Ta and positive Sr anomalies as well as Th, U high contents; this, associated with Al2O3and HREE enrichments in cpx, would indicate the circulation of a silicate melt with crustal components (i.e.:Faccini et al., 2013).
The LS peridotites contain, on average, 22 ppm H2O, with the highest values up to 30 ppm recorded in cpx-rich lherzolites. In terms of major and trace element geochemistry, LS cpx-rich lherzolites reflect a mantle domain, which does not seem to have acted as magma source, or at least it represents a residuum of < 3% of PM melting in the spinel stability field. Comparing the water contents of cpx-rich lherzolites with the PM water estimates, it is evident that, while the RLE composition (i.e. REE and Al) of this lithotype perfectly fits the PM model (Fig. 8), the H2O contents are significantly lower than the theoretical values (Fig. 10). Water contents of LS peridotites are even lower than the mantle source (H2O ∼ 80 ppm; DMM, Workman and Hart, 2005) of the “driest” MORB (H2O ∼ 0.05 wt%;Luth, 2013). Overall, water contents of LS peridotites show no systematical variation among rock types (Table 1) and no correlation with Yb (and Y) or Al2O3contents of cpx. For instance, the harzburgite LS26 and cpx-rich lherzolites LS31 have similar water contents (57 vs. 55 ppm), but they represent different
mantle domains, probably adjacent at the time of basalt capturing. On the basis of the petrology and geochemical data reported above and accordingly to what proposed byLu et al. (2013)it is reasonable to infer that a cold highly refractory harzburgite and cpx-poor lherzolites could represent the old cratonic lithospheric mantle modified by in-teraction with metasomatic melts, involving crustal components. Cpx-rich lherzolites constitute fragments of upwelling cooled fertile asthe-nosphere after the removal/erosion of the base of the lithospheric mantle. This asthenospheric portion had higher T, lower fO2and higher water contents than the pristine lithosphere.
Since heat and H are the highest diffusive components (8–10 orders of magnitude higher than the highest diffusive RLE) and highly de-pendent on T, it would take < 5 Ma for a mantle portion about 1 km2in size to re-equilibrated with the surrounding old and cold lithosphere after the last partial melting episode.
Acknowledgments
We thank two anonymous reviewers and the editor for the com-ments and suggestions. This work was supported by the National Natural Science Foundation of China (nos. 41225005, 41672053).
Appendix A. Supplementary material
Supplementary data to this article can be found online athttps:// doi.org/10.1016/j.jaesx.2019.100006.
References
Arevalo, R., McDonough, W.F., Luong, M., 2009. The K/U ratio of the silicate Earth: Insights into mantle composition, structure and thermal evolution. Earth Planet. Sci.
Lett. 278, 361–369.
Ballhaus, C., Berry, R.F., Green, D.H., 1991. High pressure experimental calibration of the olivine-orthopyroxene-spinel oxygen geobarometer: implications for the oxidation
state of the upper mantle. Contrib. Mineral. Petrol. 107, 27–40.
Bonadiman, C., Coltorti, M., 2011. Numerical modelling for peridotite phase melting
trends in the SiO2-Al2O3-FeO-MgO-CaO system at 2 GPa. Mineral. Mag. 75, 548.
Bonadiman, C., Beccaluva, L., Coltorti, M., Siena, F., 2005. Kimberlite-like metasomatism and ‘garnet signature’ in spinel-peridotite xenoliths from Sal, Cape verde archipelago: relics of a subcontinental mantle domain within the Atlantic oceanic lithosphere? J.
Petrol. 46, 2465–2493.
Bonadiman, C., Hao, Y.T., Coltorti, M., Dallai, L., Faccini, B., Huang, Y., Xia, Q.K., 2009. Water contents of pyroxenes in intraplate lithospheric mantle. Eur. J. Min. 21,
637–647.
Bonadiman, C., Nazzareni, S., Coltorti, M., Comodi, P., Giuli, G., Faccini, B., 2014. Crystal chemistry of amphiboles: implications for oxygen fugacity and water activity in li-thospheric mantle beneath Victoria Land, Antarctica. Contrib. Mineral. Petrol. 167,
984.
Bizimis, M., Peslier, A.H., 2015. Water in Hawaiian garnet pyroxenites: Implications for
water heterogeneity in the mantle. Chem. Geol. 397, 61–75.
Brey, G.P., Köhler, T., 1990. Geothermobarometry in four-phase lherzolites II: New thermobarometers, and practical assessment of existing thermobarometers. J. Petrol.
31, 1353–1378.
Chen, C., Liu, Y., Foley, S.F., Ducea, M.N., He, D., Hu, Z., et al., 2016. Paleo-asian oceanic slab under the north china craton revealed by carbonatites derived from subducted
limestones. Geology 44 (12) e414-e414.
Chung, S.L., 1999. Trace element and isotope characteristics of Cenozoic basalts around the Tanlu fault with implications for the eastern plate boundary between North and
South China. J. Geol. 107, 301–312.
Coltorti, M., Bonadiman, C., Hinton, R.W., Siena, F., Upton, B.G.J., 1999. Carbonatite metasomatism of the oceanic upper mantle: evidence from clinopyroxenes and
glasses in ultramafic xenoliths of Grade Comore, Indian ocean. J. Petrol. 40, 133–165.
Craddock, P.R., Warren, J.M., Dauphas, N., 2013. Abyssal peridotites reveal the
near-chondritic Fe isotopic composition of the Earth. Earth Planet. Sci. Lett. 365, 63–76.
Crank, J., 1975. The Mathematic of Diffusion. Clarendon Press, Oxford, pp. 421.
Deng, J.F., Mo, X.X., Zhao, H.L., Wu, Z.X., Luo, Z.H., Su, S.G., 2004. A new model for the dynamic evolution of Chinese lithosphere, continental roots-plume tectonics. Earth
Sci. Rev. 65, 223–275.
Dick, H.J.B., Bullen, T., 1984. Chromian spinel as a petrogenetic indicator in abyssal and alpine-type peridotites and spatially associated lavas. Contrib. Mineral. Petrol. 86,
54–76.
Doucet, L.S., Peslier, A.H., Ionov, D.A., Brandon, A.D., Golovin, A.V., Goncharov, A.G., Ashchepkov, I.V., 2014. High water contents in the Siberian cratonic mantle linked to metasomatism: An FTIR study of Udachnaya peridotite xenoliths. Geochim. Cosmo.
Acta 137, 159–187.
Drake, M.J., Righter, K., 2002. Determining the composition of the Earth. Nature 416,
![Fig. 3. Compositional variation of olivines in LS mantle xenoliths; Mg# [Mg/(Mg + Fe 2+ ) *100] versus NiO wt.% reflects, on the whole, a general positive cor- cor-relation from cpx-rich lherzolites to cpx-poor lherzolites (and harzburgite).](https://thumb-eu.123doks.com/thumbv2/123dokorg/4719982.45616/8.892.55.841.122.236/compositional-variation-olivines-xenoliths-reflects-lherzolites-lherzolites-harzburgite.webp)