Role and regulation of miR-483 in cancer Index 1 INDEX INDEX 1 Abstract 2 Significance 2 Introduction 3
Materials and Methods 8
Results 15
miR-483-3p is over-expressed in Wilms’ tumor and common adult human cancers in
concert with IGF2 15
miR-483-3p protects cells from apoptosis 18
PUMA is targets of miR-483-3p 19
AMO-miR-483-3p but not IGF2 siRNA can inhibit in vivo tumorigenicity 23 miR-483-3p expression correlates with the mutational status of Wnt/β-catenin genes in
hepatocarcinoma (HCC) 24
The miR-483 locus is regulated by β-catenin 26
The zinc finger CCCTC-binding factor CTCF represses the genomic region upstream of
the miR-483 locus 28
The transcription factor USF1 serves as a mediator between β-catenin and the miR-483 30 miR-483-3p reveals a negative regulative loop by targeting β-catenin 34 The mutated form of β-catenin can evade the miR-483-3p regulative loop 36
Discussion 39
Conclusion and future perspectives 42
Role and regulation of miR-483 in cancer Abstract
2 Abstract
The hsa-mir-483 locus is located at chromosome 11p15.5 within intron 2 of the IGF2 locus. Because of its location, de-regulated in Wilms’ tumor and other neoplasia, I hypothesized that this microRNA had a potential role in tumors. By analyzing 19 Wilms’ tumors, I proved that miR-483-3p is indeed over-expressed in 100% of the cases and a co-regulation with the over-expression of IGF2 was found.
However, several other types of common adult cancers exhibit high or even extremely high levels of miR-483-3p expression without IGF2 over-expression. Indeed, independently from
IGF2, the expression of the miR-483-3p could also be induced by the oncoprotein -catenin
through a novel interaction with the basic Helix-Loop-Helix protein upstream stimulatory transcription factor 1 (USF1).
I also show that -catenin itself is a target of miR-483-3p, triggering a negative regulative loop that becomes ineffective in cells harbouring activating mutations of -catenin pathway. The potential oncogenic role of miR-483-3p was supported by the findings that its ectopic expression protects cells from apoptosis and, conversely, its inhibition increase the level of apoptosis. To understand the mechanisms of its action, I investigated potential gene targets. Among these, an important pro-apoptotic protein, Puma, were inhibited by miR-483-3p. My results indicate that miR-483-3p functions as an anti-apoptotic oncogene, coordinately over-expressed with IGF2 in Wilms’ tumors or induced by -catenin activation in other tumor types.
Significance
IGF2 is a fetal growth factor where abnormally high expression has been associated with the Beckhwith-Wiedeman syndrome that predisposes to the development of nephroblastoma, hepatoblastoma and rhabdomyosarcoma. Here I show that miR-483-3p, located within intron 2 of IGF2 gene, is overexpressed in all the Wilms’ tumors I studied. I also show this microRNA target a proapoptotic protein, Puma, and behave as an antiapoptotic oncogene. Moreover I demonstrate that dysregulation of miR-483-3p can also occur independently of
IGF2 dysregulation. In this case miR-483-3p is regulated by -catenin oncogene and may contribute to its antiapoptotic activity.
Role and regulation of miR-483 in cancer Introduction
3 Introduction
Genetic and epigenetic abnormalities at chromosomal region 11p15.5 have been associated with various human neoplasms and with the cancer-predisposing Beckwith-Wiedeman syndrome (BWS). In particular, loss of alleles and gene duplication at 11p15 are typically detected in more than 80% of Wilms’ tumors 1-5 and, albeit less frequently, in more common adult neoplasms 6-9.
Two close imprinted loci, that harbor at least eight mono-allelically expressed genes, are present at chromosome region 11p15.5. The aberrant regulation of genomic imprinting at 11p15.5 was involved in human cancer 10-12. Aberrant methylation at the H19 maternal locus leads to the reactivation of the silent IGF2 allele 10,13-16 and the loss of maternal allele methylation at the KvDMR1 locus was linked to reduced expression of the cyclin-dependent kinase inhibitor CDKN1C/p57 gene and other imprinted genes 11,12,17-19
. These studies point to the existence of oncogenic, IGF2, as well as tumor suppressive, CDKN1C/p57, functions within the 11p15.5 chromosomal imprinted region.
IGF2 is a fetal growth factor, whose abnormal expression has been involved in the Beckwith-Wiedemann syndrome, which predisposes to the development of nephroblastoma, hepatoblastoma, and rhabdomyosarcoma. Biallelic expression of IGF2 gene, consequent the loss-of-imprinting (LOI) at the IGF2 locus, occur in 40-50% of Wilms’ tumor 5,20 and it is thought to be an early event in carcinogenesis. So it has been suggested that increased IGF2 could lead to an enhanced cellular proliferation, differentiation failure and tumor development. However, a transgenic mouse model for IGF2 over-expression exhibited many of the features associated with the Beckwith-Wiedemann syndrome, including prenatal overgrowth, polyhydramnios, fetal and neonatal lethality, disproportionate organ overgrowth including tongue enlargement, and skeletal abnormalities, but did not develop tumors 21. These results suggest that additional cofactors cooperate with IGF2 in promoting human cancer. Recently, the IGF2 locus was shown to harbor a miRNA, the mir-483 locus, within its second intron 22.
Role and regulation of miR-483 in cancer Introduction
4
Fig.1 Genomic structure of the 11p15.5 chromosome region and its imprinted genes.(A) Location of the
genes mapping in the 11p15.5 chromosome region and their imprinted status. Red arrows, on the top of the panel, indicate the maternal allele expression, blue arrows the paternal allele expression whereas black arrows indicate the biallelic expression. (B) Simplified model of the imprinted status of the CDKN1C/KCNQ10T/KvLQT1 and IGF2/H19 genes imprinted locus (from J Clin Invest. 2000;105(3):247– 252). (C) Schematic representation of the tridimensional structure obtained by the interaction between CTCF-Cohesin, other proteins to permit the monoallelic expression of the IGF2 and H19 genes. DNA elements are indicated as follows: CTCF AD (red bar); ICR (purple bar), and CTCF DS (Cerise bar), Enhancer is yellow oval. Pink and pale blue ovals represent the CTCF/cohesin complexes. CpG methylation is depicted as filled lollipops. On the paternal allele, co localisation of CTCF and cohesin at CTCF AD, and CTCF DS brings these regions together. The methylated ICR does not bind CTCF and is thus excluded from CTCF/cohesin interacting regions. The exclusion of the ICR may enable the IGF2 gene promoters and H19 enhancer region to interact, (shown by yellow oval close to IGF2 arrow) even though they are on different looping domains. (The H19 domain is shaded.) On the maternal allele, CTCF/cohesin can bind to the unmethylated ICR which can then interact with other CTCF/cohesin sites.
Role and regulation of miR-483 in cancer Introduction
5
Fig.2 Wnt/β-catenin signaling (from Cell signaling technology, http://www.cellsignal.com). The figure show how β-catenin (blue oval) could be part of the membrane E-Cadherin/α-catenin complex, compounded to the APC/Axin/GSK3β/WTX complex for its degradation or be in the nucleus to act as a transcription factor. Every step of this pathway could be regulated by numerous protein/enzyme where the most important is by the Wnt-Frizzled molecules able to block the β-catenin degradation by the APC/Axin/GSK3β complex.
β-catenin is a multifunctional protein involved in cell-cell adhesion when it is localized to the cellular membrane 23, and in transcriptional regulation by translocation into the nucleus through the Wnt pathway 24. Wnt signaling is an important molecular pathway required for cellular differentiation, tissue homeostasis, and tissue morphogenesis. Wnt/β-catenin signaling is one of the most commonly activated pathways in cancer and several Wnt signaling related gene mutations have been described: adenomatous polyposis coli (APC)
Role and regulation of miR-483 in cancer Introduction
6 and protein phosphatase 2 regulatory subunit A (PPP2R1B) mutations in colorectal cancer 25, axin1 mutation in hepatocarcinoma 26, WTX gene mutations in Wilms’ tumor 27 and β-catenin gene (CTNNB1) itself was shown to be mutated 28-30 in the amino terminal region employed for degradation by the GSK3β -APC-Axin-WTX complex 27,31. These mutations prevent β-catenin degradation and result in its accumulation in the nucleus where it acts as a specific transcriptional co-activator of the DNA binding T cell factor/lymphoid enhancer factor protein family (TCF/LEF). Among the targets of this family are important genes involved in tumorigenesis such as MYC, CCND1, CJUN and FRA1. 32,33 (Fig.2).
Fig.3 Biogenesis of miRNAs and assembly into protein complexes. miRNA precursor molecules
(pri-miRNAs) fold into hairpin structures that contain imperfect base-paired stems in a two-step process catalyzed by two different RNase III-type endonucleases. Drosha first cleaves pri-miRNAs,forming _70 nucleotide hairpins (pre-miRNAs) in the nucleus. Subsequently, pre-miRNAs are transported to the cytoplasm by Exportin 5, where they are cleaved by Dicer to yield _20-bp miRNA duplexes. After processing, miRNAs are assembled into RNP (ribonucleic protein) complexes, called miRNPs, with proteins of the AGO family. miRNPs tether to the 3_UTR of a mRNA target to repress protein synthesis. In the case of perfect bp alignment, the miRNP complex cleaves the duplex miRNAmRNA; however, multiple mechanisms 34 are used on duplex miRNA:mRNA with imperfect
complementary.
MicroRNAs (miRNAs) are small non-coding RNAs that modulate gene expression by base pairing to the target messenger RNAs (mRNAs) and by inhibiting their translation and/or promoting their degradation 35 (Fig.3). MicroRNAs play a critical role in the normal maintenance of fundamental cellular processes and their deregulation in human neoplasm has been proven to affect a large number of molecular pathways related to cancer 36-38. Indeed
Role and regulation of miR-483 in cancer Introduction
7 microRNA aberrant expression of miRNAs has been detected in any human neoplasm and miRNAs were found to play a central role in all molecular pathways affecting cancer traits
36,38,39
. Since the miR-483 locus is dysregulated in tumors involving the β-catenin pathway
40-42
I investigated also their possible connection. Here I demonstrate that expression of
miR-483 can be induced independently of its host gene IGF2 by the oncoprotein -catenin through
a novel interaction with the basic Helix-Loop-Helix protein upstream stimulatory transcription factor 1 (USF1) . I also show that -catenin itself is a target of miR-483-3p, triggering a negative regulative loop that becomes ineffective in cells harbouring activating mutations of -catenin pathway.
Therefore, I illustrate the potential oncogenic activity of miR-483-3p, one of the mature products of the hsa-mir-483 locus, which is located within the IGF2 locus at chromosome 11p15.5. My results provide evidences for a role of this miRNA as an anti-apoptotic oncogene, which may cooperate with IGF2 in tumorigenesis.
Role and regulation of miR-483 in cancer Material and methods
8 Materials and Methods
Primary tumors. Primary tumor RNAs were obtained from 19 Wilms’ tumor, 3 adjacent patient normal tissues, 2 adult kidneys; 27 hepatocarcinoma (HCC), 7 cirrhotic and 2 normal liver tissues; 23 colorectal cancers (CRC) and 5 normal colon mucosa; 19 breast cancers (BrCa) and 4 normal breast tissues. All tissue samples were collected at surgery, immediately snap frozen in liquid nitrogen, and stored at -80°C until RNA extraction. Total RNA was isolated using Trizol (Invitrogen) according to manufacturer’s instructions.
Cell lines and transfection. HEK293 (ATCC number CRL-1573), HepG2 (ATCC number HB-8065), HCT116 (ATCC n. CCL-247) cell lines were cultured with Iscove’s modified Dulbecco’s medium with 10% fetal bovine serum. hsa-miR-483-3p precursor (Sanger accession MI0002467) and Negative control 2 ribo-oligonucleotide were from Applied Biosystems/Ambion. Anti-microRNA oligonucleotides (AMOs) against miR-483-3p and against the GFP gene (AMO Negative Control) were from Fidelity Systems (Gaithersburg MD, USA). RNA interfering for BBC3/PUMA and scramble control were from Santa Cruz (Santa Cruz, CA). . siRNA for MYC (cat. L-003282-00-0005), CTNNB1 (cat. L-003482-00) and scramble negative control (cat. D-001810-10-20) were from Dharmacon. Transfection of miRNAs, AMOs and expression vectors was carried out with lipofectamine 2000 (Invitrogen, cat. 116688-019) in accordance with manufacturer’s procedure.
Luciferase assays and vectors. The human 3’UTRs of BBC3/PUMA and CTNNB1 were amplified by PCR using the primers indicated in Table 1 and cloned downstream of the firefly luciferase gene in the pGL3-Control vector (Promega). Substitutions into the miR-483-3p binding sites of the 3’UTR genes were introduced by using Quick-Change Site direct Mutagenesis Kit (Stratagene, CA, USA) following the manufacturer’s instructions using the primers indicated in Table 1. As a reference, the pRLTK vector (Promega), which expresses the renilla luciferase, was used. Transfection was conducted in HEK293, HCT116 and HepG2 cells cultured in 24-well plates, each well was cotransfected with 400 ng of pGL3-control vectors together with 40 ng of pRLTK reference vector (Promega) and 30 pmol of
miR-483-3p or Negative control 2 or AMOs or methylated control oligonucleotide.
Twenty-four hours after transfection, firefly and renilla luciferase activities were measured using the Dual-Luciferase Report Assay (Promega). β-catenin and USF1 expression vectors were generated cloning β-catenin cDNA and USF1 cDNA into the pIRES-Neo2 (Clontech), and pCMV-Tag (Agilent Technologies) vectors see Table 2 for primers sequences. To test the β-catenin nuclear activity, the pGL3-OT and pGL3-OF luciferase responsive vectors were used
Role and regulation of miR-483 in cancer Material and methods
9
43
. pGL3-OT is a TCF-LEF responsive reporter, pGL3-OF is a negative control with a mutated TCF-LEF binding site. Each transfection was repeated at least twice in triplicate. To analyze the promoter of the miR-483 I used the pGL4 luc2 .1 (Promega) where I cloned the SV40 enhancer downstream the luciferase gene.
Western blots analysis. HEK293, HepG2 and SW480 cell lines were transfected with 30 pmol of miR-483-3p, AMOs and controls sequences in 24-well plates. After 48 hours cells were collected, lysed in Laemmli 2X buffer and analyzed by western blot to assess the expression of PUMA using monoclonal antibodies (Cell Signaling, anti-PUMA antibody #4976). Primary antibody was incubated 2 hours at room temperature and then peroxidase conjugated anti-mouse or anti-rabbit antibodies were incubated 30 minutes at room temperature. Detection was conducted by chemiluminescent enhanced assay (WesternBreeze Chemiluminiscent Kit cat. WB7104, Invitrogen). β-actin antibody (Cell Signaling, β-Actin Antibody #4967) or Ponceau staining were used to normalize protein loading. To quantify western blot signals, digital images of autoradiographies were acquired with Fluor-S MultiImager, and band signals were quantified in the linear range of the scanner using specific densitometric software (Quantity One).
RNA isolation and Quantitative Real time RT-PCR (qRT-PCR). Purification of total RNA using TRIzol reagent (Invitrogen, Carlsband, CA, USA) was carried out following the manufacturer’s instructions. Mature microRNA expression was assayed by Taqman MicroRNA assay (Applied Biosystem) specific for miR-483-3p (P/N: 4378094) and normalized on RNU6B (P/N: 4373381). Five ng of total RNA was reverse transcribed using the specific looped primer and real time quantitative PCR was conducted using the standard Taqman MicroRNA assay protocol on a Biorad-Chromo4 thermal cycler. The 20 μL PCR included 1.33 μL reverse transcription product, 1X Taqman Universal PCR Master Mix, No AmpErase UNG (P/N 4324018(Applied Biosystem), 0.2 μmol/L Taqman probe, 1.5 μmol/L forward primer, 0.7 μmol/L reverse primer. The reaction was carried out in a 96-well PCR plate at 95°C for 10 min followed by 40 cycle of 95° C for 15 sec and 60°C for 1 min. Each sample was analyzed in triplicate. qRT-PCR for mRNAs was performed using 500 ng of total RNA for each sample according to the manufacturers’ instruction (High capacity cDNA Reverse Transcription Kit, Applied Biosystems) and the real time reaction using SYBR green technologies (Power SYBR green PCR Master Mix, Applied Biosystems) on the Biorad-Chromo4 instrument. The 20 μL PCR included 1 μL reverse transcription product, 1X Power SYBR green PCR Master Mix, (P/N 4368577, Applied Biosystem), 0.4 μmol/L forward
Role and regulation of miR-483 in cancer Material and methods
10 primer, 0.4 μmol/L reverse primer. The reactions were incubated in a 96-well PCR plate at 95° C for 10 min followed by 40 cycle of 95° C for 15 sec and 60° C for 1 min. Each sample was analyzed in triplicate. TaqMan gene expression assays was performed for IGF2,
BBC3/PUMA and CDKN1A/P21, primiR-483 genes using primers and probes
(Hs01005963_m1, Hs00248075_m1, Hs99999142_m1) obtained from Applied Biosystems (Applied Biosystems, Foster City, CA).The expression of 18S RNA was used as endogenous reference control. ). To avoid genomic contamination in the quantification of the IGF2 intron 2 and primiRNA-483 RNA samples were previously treated with DNAse (TURBO DNA-free™ Kit, cat. AM1907, Ambion). The list of primers that I used herein is shown in Table 2. The level of miRNA and mRNA were measured using Ct (threshold cycle). The amount of target, normalized to an endogenous reference and relative to a calibrator, is given by: 2-∆∆Ct (Comparative Ct method, Applied Biosystem User Bulletin #2).
Northern blot analysis. RNA samples (10 µg each) were electrophoresed on 15% acrylamide and 7 mol/L urea Criterion precasted gels (Bio-Rad) and transferred onto Hybond N+ membrane (Amersham Biosciences). Membranes were hybridized as previously describes
44
with oligonucleotide probes corresponding to the complementary sequences of the mature miRNAs: miR-483-3p 5’-UCACUCCUCUCCUCCCGUCUU-3’ and the reference U6 RNA 5’-GCAGGGGCCATGCTAATCTTCTCTGTATCG-3’.
Cell death and cell viability assays. MTT assay was carried out on HEK293 cell line. HEK293 was cultured in 24-well plates the day before miR-483-3p or AMOs transfection. After 24 hours from transfection, cells were treated with doxorubicin (0.4 μg/ml) for additional 24 hours. The assay was performed in accordance with manufacturer’s protocol (Sigma, TOX-1). Each experiment was performed in triplicate. Nuclear fluorescein staining based on labeling of DNA strand breaks by Terminal deoxynucleotidyl transferase (TUNEL-reaction) was performed on HepG2 cell line according to the manufacturer’s instructions (In situ cell death detection kit, Cat. No.11684795910, Roche). The experiment was performed in triplicate and analyzed on microscope Zeiss Axiovert 200 at 100X magnification, images was acquire with the CCD Cascade Photometrics 512b. Quantification of positive nuclei was calculated by counting fluorescent spots in 10 images (10X10 magnifications) for each experiment. Caspase 3/7 activity assay was performed on HCT116 cell line. HCT116 was cultured in 96-well plates the day before miR-483-3p, AMOs and controls transfection. After 24 hours from transfection, cells were treated with Nutlin-3 (5 μM) or 5-Fluoruracil (from 0
Role and regulation of miR-483 in cancer Material and methods
11 to 50 μM) for additional 6/24 hours then the assay was performed in accordance with manufacturer’s protocol (Promega, Caspase-Glo 3/7 assay, G8090).
Generation of stable cell lines over-expressing miR-483-3p and antimiR-483-3p. HCT116 cells were infected with the PMIRH483 expression plasmid containing the full-length miR-483-3p and the GFP gene under the control of two different promoters (PMIRH483PA-1, System Biosciences, Mountain View, CA). HCT116 and HepG2 cells were infected with the pSIH vector (System Biosciences, Mountain View, CA) containing the antisense sequence for miR-483-3p (Table 1) using the Lentivector-based Anti-MicroRNAs technology (miRZIPTM, System Biosciences, Mountain View, CA). An empty vector was used as control. Pre-miR-483-3p, antimiR-483-3p expression and control constructs were packaged with pPACKH1 Lentivector Packaging Plasmid mix (System Biosciences) in 293-TN packaging cell line. Viruses were concentrated using PEG-it™ Virus Precipitation Solution and titers analyzed using UltraRapid Lentiviral Titer Kit (System Biosciences). Infected cells were selected by FACS analysis (FACS Calibur, Becton Dickinson Immunocytometry Systems). Infection efficiency >90% was verified by fluorescent microscopy.
In vivo studies. Animal studies were approved by institutional ethical committee. HepG2 cells were transfected in vitro with 2’-O-methyl RNA oligonucleotide complemenmtary to miR-483-3p (anti-miR oligonucleotide: AMO-483-3p), AMO-Negative control from Fidelity Systems (Gaithersburg MD, USA) and siRNA against IGF2 gene from Thermo-Scientific Dharmacon (Lafayette, CO, USA). At 24 h after the transfection, 107 viable cells per mouse were injected intraperitoneally into ten Nod-Scid mice (Charles River Breeding Laboratories). After 35 days, the mice were sacrificed, necropsies were performed, and all tumors per mouse were weighed. For athymic “nude” mice experiments, HepG2 cells (10 × 106 cells/200 ul) were injected subcutaneously into the flanks of nude mice 24 h after transfection with AMO-483-3p (4 injection), AMO Negative Control (4 injection) or siRNA IGF2 (6 injection). Tumors were counted after 20 days.
Protein isolation, immunoblot analisis and immunoprecipitation. Cells were collected from 6-well plates using trypsin-ethylenediaminetetraacetic acid (EDTA) (Sigma) and dissolved in lysis buffer (M-PER Mammalina Protein Extraction reagent, cat. 78501, Thermo Scientific) freshly supplemented with a complete protease inhibitor and phosphatase inhibitor cocktails 1 and 2 (Roche, Indianapolis, IN, USA) in accordance with manufacturer’s
Role and regulation of miR-483 in cancer Material and methods
12 procedure. Nuclear extracts were prepared dissolving cells in nuclear and cytoplasmic extraction reagents (cat. 7833, Thermo Scientific) and following the manufacturer’s procedure. After electrophoresis and blotting primary antibodies (Cell Signaling, anti-CTNNB1 #9562, anti-MYC #5605; Santa Cruz, anti-USF1 sc-229) were incubated over night at +4°C temperature and then peroxidase conjugated anti-mouse or anti-rabbit antibodies were incubated 1 hour at room temperature. Detection was conducted by chemiluminescent (Pierce ECL Western Blotting Substrate cat. 32106, Thermo Scientific). β-actin antibody (Cell Signaling, β-Actin Antibody #4967) or Vinculin antibody (Millipore, cat. MAB3574) were used to normalize protein loading. To quantify western blot signals, digital images of autoradiographies were acquired with Fluor-S MultiImager, and band signals were quantified in the linear range of the scanner using specific densitometric software (Quantity One). Immunoprecipitation was carried out with 100 µg of nuclear extracts in 500µl of binding buffer (10mM Tris, 50mM KCl, 1mM DTT; pH 7.5) with 2 µg of USF1 (Santa Cruz, sc-229) or CTNNB1 antibody (Cell Signaling, #9562) 2 hours at +4°C with gentle rotation. The immunoprecipitated was recovered by 25 µl of Protein A/G PLUS-Agarose (Santa Cruz, sc-2003) over night at +4°C with gentle rotation. Then the immunoprecipitated was washed in 0.1% NP40 three times and analyzed by western blot.
Electrophoretic mobility shift assay (EMSA). Protein/DNA binding was determined by electrophoretic mobility shift assay (EMSA) according to the manufacturer’s procedure with biotinylated probes (Pierce, LightShift Chemiluminescent EMSA kit cat. 20148), see Table 1 for oligo sequences. Samples were incubated with Ebox wt probe or the mutant form and with 100X Ebox wt unlabeled probe, and with specific polyclonal USF1 antibody (C-20, sc-229, Santa Cruz), before the addition of the probe. The DNA-protein complexes were resolved on 5% (w/v) nondenaturing acrylamide gels and visualized by exposure to autoradiographic films.
Pull down experiment. Pull-down assay was performed by using 10nmol of recombinant proteins GST (# ab85244, Abcam), GST-bcatenin (#ab63175, Abcam) and His-USF1
(#ab82069 Abcam). Reactions were carried out in binding buffer (150mM NaCl, 20mM Tris-HCl pH8, 1% NP40, 1mM EDTA), 1 mM PMSF and protease inhibitors at 4°C for 1 h of gentle rocking. The protein-protein complexes formed on the resin (Glutathione Sepharose 4 Fast Flow, Amersham or Ni-NTA Agarose, Qiagen) were brought down by centrifugation. The resin was washed five times for 5’ at 4°C with 1 ml of cold wash buffer (250mM NaCl, 20mM Tris-HCl pH8, 1% NP40, 1mM EDTA). The protein complexes were resolved on
Role and regulation of miR-483 in cancer Material and methods
13 SDS-PAGE, immunoblotted and detection was conducted by chemiluminescent metti l’ECL (Pierce ECL Western Blotting Substrate cat. 32106, Thermo Scientific).
DNA purification and Methylation analysis. Genomic DNA was isolated from cell lines and tissue by standard treatment with sodium dodecyl sulfate and EDTA in the presence of 200 μg/ml of proteinase K, followed by phenol / chloroform extraction and ethanol precipitation. The methylation status of miR promoters was determined by Bisulfite Sequencing PCR (BSP) 45. One microgram of genomic DNA was subjected to treatment with the EpiTect Bisulfite Kit (Qiagen) according to the manufacturer's instructions. Specific primers for PCR and sequencing were designed through the Methyl Primer Express v1.0 software (Applied Biosystems) (Table 1).
Role and regulation of miR-483 in cancer Material and methods
14
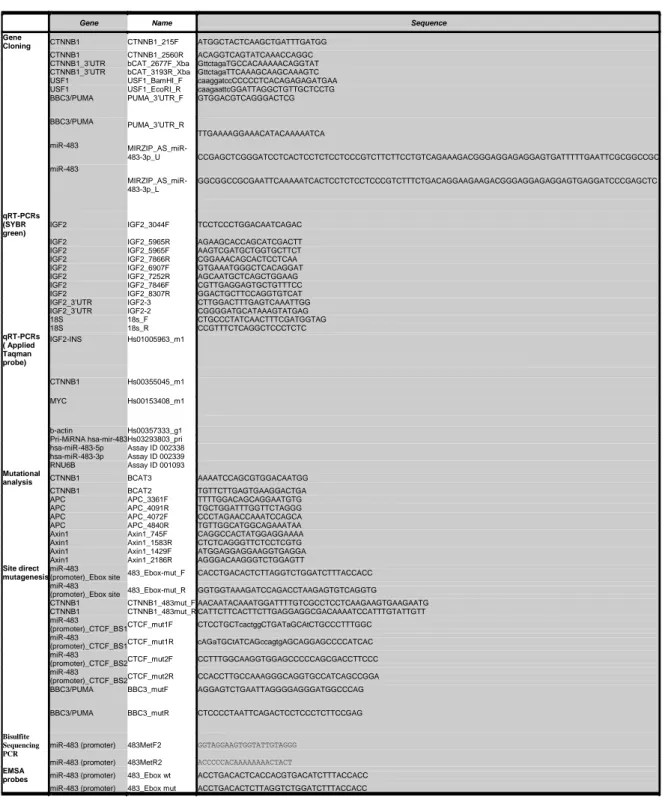
Table 1. Oligonucleotide sequences used for cloning, qRT-PCR, mutational analysis, site direct mutagenesis, bisulfate
sequencing and EMSA assay.
Gene Name Sequence
Gene
Cloning CTNNB1 CTNNB1_215F ATGGCTACTCAAGCTGATTTGATGG
CTNNB1 CTNNB1_2560R ACAGGTCAGTATCAAACCAGGC
CTNNB1_3’UTR bCAT_2677F_Xba GttctagaTGCCACAAAAACAGGTAT CTNNB1_3’UTR bCAT_3193R_Xba GttctagaTTCAAAGCAAGCAAAGTC
USF1 USF1_BamHI_F caaggatccCCCCCTCACAGAGAGATGAA
USF1 USF1_EcoRI_R caagaattcGGATTAGGCTGTTGCTCCTG
BBC3/PUMA PUMA_3’UTR_F GTGGACGTCAGGGACTCG BBC3/PUMA miR-483 miR-483 PUMA_3’UTR_R MIRZIP_AS_miR-483-3p_U MIRZIP_AS_miR-483-3p_L TTGAAAAGGAAACATACAAAAATCA CCGAGCTCGGGATCCTCACTCCTCTCCTCCCGTCTTCTTCCTGTCAGAAAGACGGGAGGAGAGGAGTGATTTTTGAATTCGCGGCCGC GGCGGCCGCGAATTCAAAAATCACTCCTCTCCTCCCGTCTTTCTGACAGGAAGAAGACGGGAGGAGAGGAGTGAGGATCCCGAGCTC qRT-PCRs (SYBR green)
IGF2 IGF2_3044F TCCTCCCTGGACAATCAGAC
IGF2 IGF2_5965R AGAAGCACCAGCATCGACTT
IGF2 IGF2_5965F AAGTCGATGCTGGTGCTTCT
IGF2 IGF2_7866R CGGAAACAGCACTCCTCAA
IGF2 IGF2_6907F GTGAAATGGGCTCACAGGAT
IGF2 IGF2_7252R AGCAATGCTCAGCTGGAAG
IGF2 IGF2_7846F CGTTGAGGAGTGCTGTTTCC
IGF2 IGF2_8307R GGACTGCTTCCAGGTGTCAT
IGF2_3’UTR IGF2-3 CTTGGACTTTGAGTCAAATTGG
IGF2_3’UTR IGF2-2 CGGGGATGCATAAAGTATGAG
18S 18s_F CTGCCCTATCAACTTTCGATGGTAG 18S 18s_R CCGTTTCTCAGGCTCCCTCTC qRT-PCRs ( Applied Taqman probe) IGF2-INS Hs01005963_m1 CTNNB1 Hs00355045_m1 MYC Hs00153408_m1 b-actin Hs00357333_g1
Pri-MiRNA hsa-mir-483 Hs03293803_pri hsa-miR-483-5p Assay ID 002338 hsa-miR-483-3p Assay ID 002339
RNU6B Assay ID 001093
Mutational
analysis CTNNB1 BCAT3 AAAATCCAGCGTGGACAATGG
CTNNB1 BCAT2 TGTTCTTGAGTGAAGGACTGA
APC APC_3361F TTTTGGACAGCAGGAATGTG
APC APC_4091R TGCTGGATTTGGTTCTAGGG
APC APC_4072F CCCTAGAACCAAATCCAGCA
APC APC_4840R TGTTGGCATGGCAGAAATAA
Axin1 Axin1_745F CAGGCCACTATGGAGGAAAA
Axin1 Axin1_1583R CTCTCAGGGTTCTCCTCGTG
Axin1 Axin1_1429F ATGGAGGAGGAAGGTGAGGA
Axin1 Axin1_2186R AGGGACAAGGGTCTGGAGTT
Site direct mutagenesis
miR-483
(promoter)_Ebox site 483_Ebox-mut_F CACCTGACACTCTTAGGTCTGGATCTTTACCACC miR-483
(promoter)_Ebox site 483_Ebox-mut_R GGTGGTAAAGATCCAGACCTAAGAGTGTCAGGTG
CTNNB1 CTNNB1_483mut_F AACAATACAAATGGATTTTGTCGCCTCCTCAAGAAGTGAAGAATG CTNNB1 CTNNB1_483mut_R CATTCTTCACTTCTTGAGGAGGCGACAAAATCCATTTGTATTGTT miR-483
(promoter)_CTCF_BS1 CTCF_mut1F CTCCTGCTcactggCTGATaGCAtCTGCCCTTTGGC miR-483
(promoter)_CTCF_BS1 CTCF_mut1R cAGaTGCtATCAGccagtgAGCAGGAGCCCCATCAC miR-483
(promoter)_CTCF_BS2 CTCF_mut2F CCTTTGGCAAGGTGGAGCCCCCAGCGACCTTCCC miR-483
(promoter)_CTCF_BS2 CTCF_mut2R CCACCTTGCCAAAGGGCAGGTGCCATCAGCCGGA
BBC3/PUMA BBC3_mutF AGGAGTCTGAATTAGGGGAGGGATGGCCCAG
BBC3/PUMA BBC3_mutR CTCCCCTAATTCAGACTCCTCCCTCTTCCGAG
Bisulfite Sequencing PCR
miR-483 (promoter) 483MetF2 GGTAGGAAGTGGTATTGTAGGG miR-483 (promoter) 483MetR2 ACCCCCACAAAAAAAACTACT
EMSA
probes miR-483 (promoter) 483_Ebox wt ACCTGACACTCACCACGTGACATCTTTACCACC
Role and regulation of miR-483 in cancer Results
15 Results
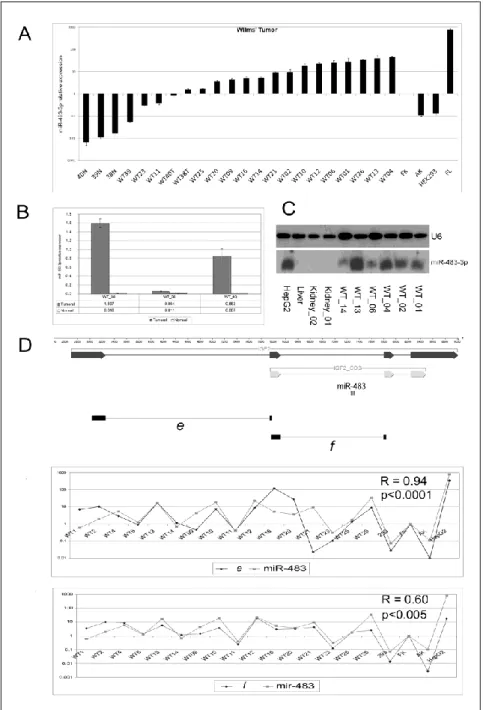
miR-483-3p is over-expressed in Wilms’ tumor and common adult human cancers in concert with IGF2. Because of its location within the IGF2 locus, I evaluated miR-483-3p expression in Wilms’ tumor. Biopsies from 19 Wilms’ tumors, four normal kidney tissues (three of which matched with Wilms’ tumor samples), one fetal kidney and one fetal liver as positive control were analyzed. Up-regulation (from 4 to 40-fold) of miRNA expression was found in 73% of Wilms’ tumors when compared with fetal kidney and in 100% of the cases when compared to non-tumoral kidney tissues (Fig. 3A-B). Northern blot analysis confirmed the qRT-PCR data (Fig. 3C).
Since mir-483-3p is located within the IGF2 gene, I compared their levels of expression: a positive correlation between IGF2 messenger RNA and miR-483-3p expression was found. By using two sets of primers spanning the junctions between exons 1-2 or 2-3 of the IGF2 cDNA sequence I found strong positive coefficients of correlation with miR-483-3p in both cases (R=0.94, p<0.0001 for product E, and R=0.60, p=0.004 for product F) (Fig. 3D). These results indicate that the joint over-expression of at least two functional elements from the IGF2 locus, the IGF2 protein and miR-483-3p, may act in Wilms’ tumors to promote tumorigenesis.
I investigated the potential involvement of miR-483-3p in common human neoplasms. I analyzed the expression of miR-483-3p in breast, colon and liver human cancers and I found that over-expression of miR-483-3p was indeed present, suggesting a wider involvement of this miRNA in human tumorigenesis. In primary colon, breast and liver carcinomas (Fig. 4A-C), I compared the expression of miR-483-3p of tumors with the average expression of non-tumor histological normal tissues. Considering the variability of miR-483-3p expression in non-tumor counterparts, only tumors exhibiting a fold-change > 10 in comparison with the average expression of non-tumor normal tissues were scored as over-expressed: 33% of HCCs, 31% of breast and 27% of colorectal cancers exhibited significant up-regulation. Interestingly, cirrhotic liver tissues, a condition that predisposes to HCC, already exhibited an increased miR-483-3p expression (from 3 to 14-fold) when compared to normal liver tissues (p-value < 0.05) (Fig. 4A).
I observed that, as in Wilms’ tumors, the up-regulation of miR-483-3p was linked with IGF2 expression: a positive Spearman coefficient of correlation of 0.69 for HCCs (p-value <0.0001) and 0.86 for CRCs (p-value <0.0001) (Fig. 4A-B).
Role and regulation of miR-483 in cancer Results
16
Figure 3. miR-483-3p and IGF2 expression in Wilms’ tumor. (A) miR-483-3p relative expression analysis by
quantitative real time PCR on 19 samples of primary Wilms’ tumor, 3 adjacent non tumoral tissues, fetal kidney, cell line HEK293 and fetal liver tissue. Each sample data was normalized to the endogenous reference RNU6B and related to the Fetal Kidney (calibrator) miR-483-3p expression (2-∆∆Ct method). (B) Different expression from normal to tumoral tissue was pointed out in samples WT_38, _39 and _40. (C) Northern blot analysis of miR-483-3p and RNU6B in 6 Wilms’ tumor samples, 2 normal adult kidney, 1 normal adult liver and HepG2 cell line. (D) Genomic structure of IGF2 gene (black arrow); coding sequence is depicted as light gray arrows, miR-483 is indicated in the second IGF2 intron. Black bars e and f show the cDNA amplified regions used to analyze IGF2 expression that was compared to the miR-483-3p expression in panels immediately below. IGF2 expression data were normalized on RNA 18S and related to IGF2 fetal kidney expression (2-∆∆Ct). Correlation coefficient (R)and the p-value (p) are shown.
Role and regulation of miR-483 in cancer Results
17 In spite of these significant positive correlations, some tumor samples (HCC_02, HCC_04, HCC_10, HCC_13, HCC_16, HCC_21, HCC_26, HCC_29, CRC_188, CRC_130, CRC_148) exhibited a divergent expression of IGF2 and miR-483-3p, suggesting the existence of multiple mechanisms of miR-483-3p regulation.
Figure 4. miR-483-3p and IGF2 expression in adult human cancers. miR-483-3p relative expression by
quantitative real time RT-PCR. The expression of miR-483-3p was normalized to the endogenous gene RNU6B (black bars) while the expression of IGF2 was normalized in 18S RNA (gray bars). Expression data were related to the average expression of normal samples of each tissue (2-∆∆Ct method). Expression of the locus IGF2/miR-483-3p was investigated in (A) 27 HCCs and 7 non tumoral cirrhotic livers (CE), which were related to 2 normal liver tissue samples, the positive correlation between IGF2 and miR-483-3p is indicated (R= 0.69, p<0.0001); (B) 22 colorectal cancer samples were related to 5 normal colon mucosa tissues, the positive correlation between IGF2 and miR-483-3p is indicated (R= 0.86, p<0.0001); (C) 19 breast cancer and 4 normal breast tissues samples were tested for the expression of miR-483-3p.
Role and regulation of miR-483 in cancer Results
18 miR-483-3p protects cells from apoptosis. To start unravelling the molecular basis of the potential oncogenic role of miR-483-3p, I focused on the apoptosis pathway because important pro-apoptotic human genes are predicted target by miRanda and TargetScan algorithms (BBC3/PUMA, AMID, BAX, BIK, SMAC/DIABLO, PDCD1, PDCD7). Thus, I evaluated apoptosis and cell viability in response to modulation of miR-483-3p in HEK293, HCT116 and HepG2 cells.
After treatment of HEK293 cells with doxorubicin to induce apoptotic cell death, transfection of miR-483-3p induced a low (10%) but significant increase in cell viability (p-value = 0.05), whereas transfection of anti-miR-483-3p AMOs induced a further 15% decrease in cell viability (p-value = 0.02) (Fig. 5A). These results indicate that miR-483-3p could promote cell survival.
HepG2 cells express very high level of miR-483-3p. Therefore, I evaluated only the effect of anti-miR-483-3p AMO in this cell line. Cell growth was 30 to 40% inhibited by transfection of anti-miR-483-3p AMO (Fig. 5B). Simultaneously, cells exhibited a 2.6 fold increase in the level of cell death than control cells transfected with a negative control AMO (p-value = 0.016) (Fig. 5C), as detected by in situ cell death using fluorescent labelling of DNA strand breaks with TdT (Terminal deoxynucleotidyl transferase).
To confirm that the mechanism was indeed apoptosis, caspase 3/7 activity was measured in HCT116 cells transfected with miR-483-3p or anti-miR-483-3p and treated with the apoptotic inducing factor Nutlin-3A. Compared to the controls, caspase activity exhibited an 80% increase in antimiR treated cells and a 60% decrease in miR-483-3p treated cells (Fig. 5D); moreover, I detected an inverse correlation between the amount of transfected miR-483-3p and caspase 3/7 activity, whereas a proportional increase was detected between AMO-483-3p and caspase 3/7 activity.
Role and regulation of miR-483 in cancer Results
19
Figure 5. AMO-483-3p induces cell death. (A) Cell
viability measured by the MTT assay in HEK293 cells. Each value represents the average absorbance ± standard deviation from three different experiments. The differences between miR-483-3p versus Negative Control 2 (p=0.002), and AMO_miR-483-3p versus AMO Negative Control (p=0.03) were both statistically significant. (B) Cell viability of HepG2 cells at 48 hours following transfection of AMO-miR-483-3p or AMO Negative Control. Each value represents average ± standard deviation from three different experiments (p=0.02 on AMO_miR-483-3p versus AMO Negative Control) and related to control data. (C) TUNEL staining of HepG2 cells after transfection of AMO-Negative Control or AMO miR-483-3p. Cells were stained 24 hours after transfection. Underneath the images, the average number of fluorescent spots is shown: data in each column represent the average ± standard deviation of fluorescent spots from three independent fields (p=0.0162). (D) Caspase 3/7 activity in HCT116 cells transfected with miR-483-3p, anti-miR-483-3p AMO or Negative controls; after 24 hours, cells were treated with Nutlin-3 (5µM) for additional 6 hours.
PUMA is targets of miR-483-3p. In the list of potential pro-apoptotic target genes, BBC3/PUMA (BCL2 binding component 3 / p53 upregulated modulator of apoptosis) gene was chosen for further analysis because of its known pivotal role in induced cell death 46. To test the direct interaction of miR-483-3p with 3’UTRs, the predicted wild type and mutant
miR-483-3p target sites of PUMA mRNA gene was cloned downstream of the luciferase
reporter gene of pGL3-Control vector. The HEK293 cells were used as biological system because they exhibit a low expression of miR-483-3p, HCT116 cells have a medium expression whereas the HepG2 cells exhibit a high expression of miR-483-3p (Fig. 6).
Role and regulation of miR-483 in cancer Results
20
Figure 6. miR-483-3p relative expression analysis by quantitative real time PCR on 14 cell lines. Each sample
data was normalized on the RNU6B (∆Ct method) and related to the HEK293 miR-483-3p expression (∆∆Ct method).
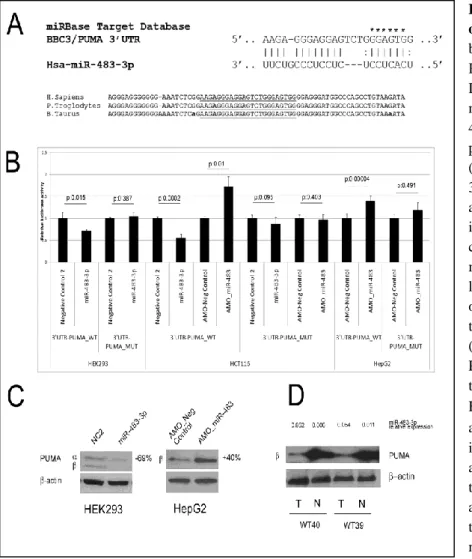
Dependently the miR-483-3p expression the miR-483-3p responsive vector was co-transfected with miR-483-3p into HEK293, either miR-483-3p or antimiR-483-3p oligonucleotide (anti-483-3p AMO) into HCT116 cells and only antimiR-483-3p into HepG2 cells (Fig. 7A). In comparison with control vector, miR-483-3p induced a decrease in luciferase activity of about 38% (HEK293) and 45% (HCT116) of the pGL3 vector carrying the PUMA-3’UTR, whereas in the mutated 3’UTR clone the luciferase activity was not significantly down-regulated by miR-483-3p. Conversely, the use of anti-miR-483-3p AMOs induced an increase in luciferase activity of about 70% and 39% for HCT116 and HepG2 cells, respectively (Fig. 7B).
To further confirm PUMA as target of miR-483-3p, its protein level was assessed by western blot analysis on HEK293 and HepG2 cells transfected with miR-483-3p or antimiR-483-3p respectively. Protein expression was reduced (70%) in HEK293 and induced (40%) in HepG2 cells when compared to the controls (Fig. 7C).
The analysis of two matched Wilms’ tumors / normal kidney samples for the expression of PUMA protein revealed that, as predicted by the molecular function of miR-483-3p, the level of expression of these two pro-apoptotic proteins was significantly lower in tumors, where
miR-483-3p is expressed at higher level (Fig. 7D).
To further support these data I generated stable cell lines over-expressing the miR-483-3p or the antimiR-483-3p to evaluate the expression of BBC3/PUMA after treatment with 5-Fluorouracil (5FU) as an apoptosis inductor factor that involve the P53 pathway. The HCT116
Role and regulation of miR-483 in cancer Results
21
Figure 7. BBC3/PUMA is target of miR-483-3p. (A) Putative
binding site of miR-483-3p in PUMA 3’UTRs (miRBase Target Database). Asterisks show nucleotides substituted in miR-483-3p predicted target site to perform luciferase assay (GGAGT>AATTA). (B) PUMA 3’UTRs regulates luciferase activity dependent on miR-483-3p in HEK293, HCT116 and HepG2 cell lines (WT, wild type; MUT, mutant; p, p-value). Firefly luciferase activity was normalized on Renilla luciferase activity of the cotransfected pRL-TK vector. (C) Western blot analysis of PUMA after miR-483-3p transfection in HEK293 and HepG2 cell line, the (23 KDa) and (18 KDa) isoforms are indicated. Cells were collected after 48 hours after miRNA transfection. (D) Western blot analysis of PUMA in Wilms’ tumor samples (T) and matched normal tissues (N).
cells were infected with lentiviral vectors over-expressing miR-483-3p (LV-483) or
antimiR-483-3p (LV-AS483), whereas the HepG2 cell line was infected with LV-AS483. An empty
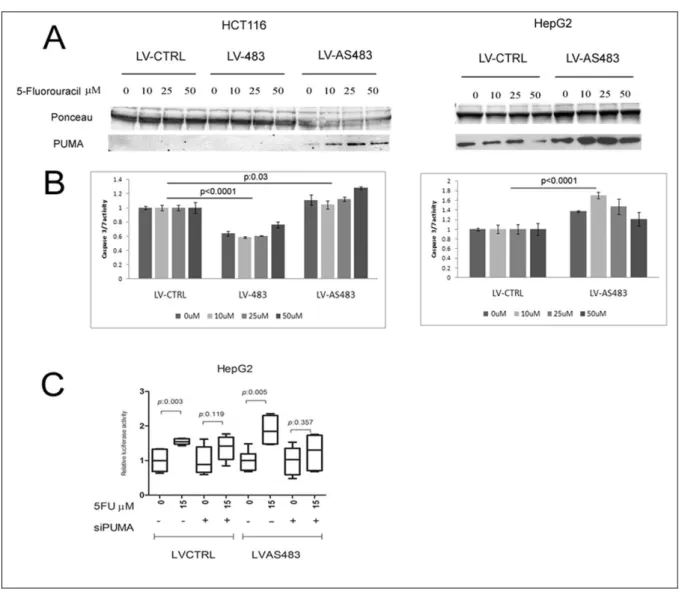
vector as control was used (LV-CTRL). The increased concentrations of 5FU match with the increased PUMA protein levels only in the HCT116 and HepG2 cells over-expressing the antimiR-483-3p (Fig. 8A), in spite of a homogeneous increment of BBC3/PUMA mRNA levels (Fig. 9A) in all stable cell lines. The induction of both BBC3/PUMA and CDKN1A/p21 mRNA levels by 5FU treatment suggest the activation of P53 pathway (Fig. 9A-B).
To assess the physiologic role of this finding, the caspase 3/7 activity of these stable cell lines was measured after 5FU treatment. Compared to controls the HCT116-LV-483 cells showed a reduced caspase 3/7 activity (24- 40%, p<0.0001) (Fig. 8B) whereas the HCT116-LV-AS483 exhibited an increased activity (4 to 28%, p: 0.03). As expected also in HepG2-LV-AS483 cells the caspase activity was increased (21 to 70%, p<0.0001) (Fig. 8B). To further prove the connection between miR-483-3p, PUMA and apoptosis, I proved that by knocking
Role and regulation of miR-483 in cancer Results
22 down PUMA by siRNA transfection, I could prevent the AS483-3p effect in HepG2-LV-AS483 cells (Fig. 8C). I used the HepG2 stable cell lines because the efficacy of the anti-miR-483-3p is more evident than the HCT116 model (Fig.8B).
Figure 8. Stable cell lines over-expressing antimiR-483-3p are more sensitive to apoptosis stimuli.
HCT116 cells over-expressing the miR-483-3p (LV-483) or the antimiR-483-3p (LV-AS483) and HepG2 cells over-expressing the antimiR-483-3p were treated with different concentration of 5-Fluorouracil. LV-CTRL indicates stable cell line with the empty vector. (A) Western blot analysis reveals an increment of PUMA protein levels only in the cells LV-AS483. (B) Caspase 3/7 activity was decreased in LV-483 cells and increased in LV-AS483 when compared with LV-CTRL cells. Data were normalized on LV-CTRL cells. (C) Relative caspase 3/7 activity in HepG2-LV-CTRL and LV-AS483 after treatment with 5FU and siPUMA (+) or siRNA scramble (-).Data were normalized on average of caspase activity of HepG2-LV-CTRL cells.
Role and regulation of miR-483 in cancer Results
23
Figure 9 CDKN1A/P21 RNA induction in stable cell lines
after 5-Fluorouracil
treatment. qRT-PCR analysis
of CDKN1A/P21 expression was normalized on 18S RNA.
AMO-miR-483-3p but not IGF2 siRNA can inhibit in vivo tumorigenicity. The potential oncogenic role of miR-483-3p was directly tested through tumorigenicity modulation of the human HepG2 cells, which over-expresses miR-483-3p. Twenty-four hours after transfection of AMO-483-3p or siRNA anti-IGF2 into HepG2 cells, a qRT-PCR confirmed the specific reduction of miR-483-3p or IGF2 mRNA, respectively (Fig. 10A). Then, 10×106 cells (cell viability greater than 97%) were intra-peritoneally injected into Nod-Scid mice. Mice were sacrificed on day 35 and all tumors for each mouse weighed. AMO-483-3p mouse group showed a significant reduction of number and weight of induced tumors compared to controls (p-value <0.05). On the contrary, repression of the IGF2 gene did not show any difference from controls (p-value >0.5) (Fig. 10B-C). The three groups of data (CTRL, AMO-483-3p, siIGF2) are comparable because of the same nature of the molecules used to silence the
Role and regulation of miR-483 in cancer Results
24
Figure 10. AMO-483-3p reduces tumors induced by HepG2 cells in vivo. (A) A qRT-PCR analysis to verify
reduction of miR-483-3p and IGF2 mRNA after transfection of AMO-483-3p or siRNA anti-IGF2 in HepG2 cells. (B) Tumors of each mouse were weighed: a significant difference (p<0.05) in tumor weights was found between 483-3p and AMO Negative control transfected (CTRL) cells, between siRNA IGF2 and AMO-483-3p (p<0.02) but not between siRNA IGF2 and AMO-CTRL transfected HepG2 cells (p>0.5). (C) Appearance of intraperitoneal HepG2 induced tumors in Nod-Scid mice: the white arrows indicate tumor formations.
miR-483-3p expression correlates with the mutational status of Wnt/-catenin genes in hepatocarcinoma (HCC). The Wnt/-catenin pathway is one of the most important pathways dysregulated in hepatocarcinoma (HCC), colorectal cancer (CRC) and Wilms’ tumor 47-49. Since I previously found that miR-483-3p is up regulated in these cancers as well, I investigated the possible involvement of Wnt/-catenin in miR-483-3p dysregulation. Since
miR-483-3p is located within intron 2 of the IGF2 gene I previously found a positive
correlation between IGF2 and miR-483-3p expression in HCC (R=0.69, p<0.0001), CRC tumor samples from HCC that have a low coefficient of correlation, exhibited a divergent expression of IGF2 and
Role and regulation of miR-483 in cancer Results
25
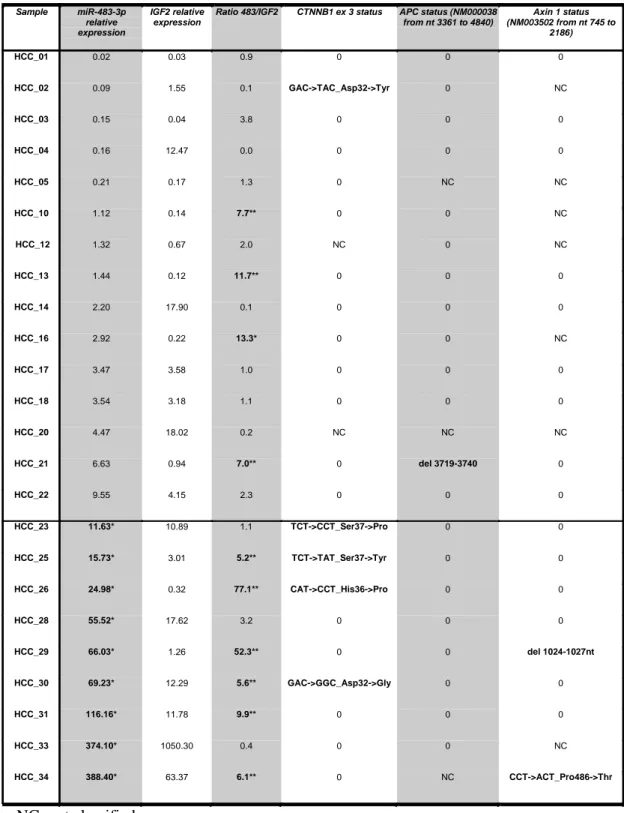
Table 2. Mutational status of Wnt/β-catenin genes is associated to miR-483-3p expression. 24 HCC samples
analyzed for IGF2, miR-483-3p expression and for the mutational status of CTNNB1 exon 3, APC and Axin genes.
Sample miR-483-3p relative expression
IGF2 relative expression
Ratio 483/IGF2 CTNNB1 ex 3 status APC status (NM000038 from nt 3361 to 4840) Axin 1 status (NM003502 from nt 745 to 2186) HCC_01 0.02 0.03 0.9 0 0 0 HCC_02 0.09 1.55 0.1 GAC->TAC_Asp32->Tyr 0 NC HCC_03 0.15 0.04 3.8 0 0 0 HCC_04 0.16 12.47 0.0 0 0 0 HCC_05 0.21 0.17 1.3 0 NC NC HCC_10 1.12 0.14 7.7** 0 0 NC HCC_12 1.32 0.67 2.0 NC 0 NC HCC_13 1.44 0.12 11.7** 0 0 0 HCC_14 2.20 17.90 0.1 0 0 0 HCC_16 2.92 0.22 13.3* 0 0 NC HCC_17 3.47 3.58 1.0 0 0 0 HCC_18 3.54 3.18 1.1 0 0 0 HCC_20 4.47 18.02 0.2 NC NC NC HCC_21 6.63 0.94 7.0** 0 del 3719-3740 0 HCC_22 9.55 4.15 2.3 0 0 0 HCC_23 11.63* 10.89 1.1 TCT->CCT_Ser37->Pro 0 0 HCC_25 15.73* 3.01 5.2** TCT->TAT_Ser37->Tyr 0 0 HCC_26 24.98* 0.32 77.1** CAT->CCT_His36->Pro 0 0 HCC_28 55.52* 17.62 3.2 0 0 0 HCC_29 66.03* 1.26 52.3** 0 0 del 1024-1027nt HCC_30 69.23* 12.29 5.6** GAC->GGC_Asp32->Gly 0 0 HCC_31 116.16* 11.78 9.9** 0 0 0 HCC_33 374.10* 1050.30 0.4 0 0 NC HCC_34 388.40* 63.37 6.1** 0 NC CCT->ACT_Pro486->Thr NC; not classified 0; not mutated
* miR-483-3p expression values greater than the considered cut-off (10)
Role and regulation of miR-483 in cancer Results
26
miR-483-3p suggesting alternative mechanisms regulating these two genes. I analyzed the
mutational status of APC, CTNNB1 and Axin1 in 24 HCC samples in which miR-483-3p and
IGF2 expression had already been assessed 40. Mutations in these three genes were previously
proposed as a major cause of activation of the Wnt/-catenin pathway in cancer 50 5128. With a miR-483-3p expression cut-off level of 10-fold over the average expression of the controls, I detected an association between miR-483-3p up regulation and mutational status of these genes (p=0.053; Fisher's Exact Test) (Tab. 2), whereas no association between IGF2 expression and the Wnt/-catenin mutational status was found (expression cut off = 10, p > 0.5; Fisher's Exact Test). These data suggest that -catenin may be involved in the regulation of 483-3p separately from IGF2. To prove this point I calculated the ratio between
miR-483-3p and IGF2 expression levels (median value =1.3) to identify samples in which they
were divergent (Tab. 2). A strong association between the miR-483-3p/IGF2 ratio and the mutational status of the Wnt/-catenin genes was observed when the ratio is greater than 5 (p=0.015; Fisher's Exact Test). Overall these data strongly suggest that expression of
miR-483-3p, but not that of IGF2, is associated with the mutational status of the Wnt/-catenin pathway.
The miR-483 locus is regulated by -catenin. Since -catenin is the principal transcriptional mediator of the Wnt/-catenin pathway, I investigated its involvement in the regulation of the IGF2/miR-483 locus. I cloned the coding sequence of the -catenin gene into the expression vector pIRES-Neo2, and tested its expression (Fig 11A top panel) and ability to activate the luciferase reporter vector pGL3-OT containing the -catenin/TCF responsive element (Fig.S1) 52. pGL3-OF, which carries a mutated -catenin/TCF binding site, was used as a negative control. Then I assessed the expression level of miR-483-3p in response to -catenin over-expression in HEK 293 cells. A significant increase in
miR-483-3p expression was detected in cells transfected with pIRES-Neo2-catenin vector compared
to cells transfected with the empty vector pIRES-Neo2 (Fig. 11A). To confirm these results, I transiently knocked-down -catenin by using short interfering RNA technology (siRNA) in HCT116 cells that exhibits a higher catenin nuclear activity, and miR-483-3p expression, compared to HEK293 cells. qRT-PCR verified the decrease of -catenin mRNA after siRNA treatment (Fig.S1B), and a significant reduction of miR-483-3p expression was detected only in cells transfected with -catenin siRNA (Fig.12B).
Role and regulation of miR-483 in cancer Results
27
Figure 11. Induction of
miR-483-3p expression by
β-catenin. (A) miR-483-3p was
induced by enforced expression of CTNNB1 wild type. Expression value was related to the miRNA expression on empty vector transfected cells (2-∆∆Ct).The expression of CTNNB1 was assessed by western blot (top panel). (B) Expression analyses across the IGF2 locus modulated by the enforced expression of β-catenin. Three PCR products were designed to amplify IGF2 exon junctions (Ex_1/2, Ex_2/3, Ex_3/4) and one its 3’UTR (3’UTR). One set of primers was located within intron 2 and was used to assess the expression of miR-483 precursor (intron_2). qRT-PCRs were carried out with SYBR green technologies. RNA was previously treated with DNAse to avoid genomic contamination. Black bars show the expression detected in cells transfected with the CTNNB1 expressing vector; white bars show the expression detected in cells transfected with the Empty vector. (C) Expression analysis of the miR-483-3p, miR-483-5p, primiR-483 and IGF2 genes assayed by qRT-PCR using TaqMan probes after LiCl treatment (20mM for 24hours) with and without siRNA for CTNNB1 gene. IGF2 expression was still induced, although more weakly than the control (Fig 11C). This IGF2 induction by LiCl has not been previously described and is not necessarily due to -catenin because of the large number of pathways affected by GSK3B inihibition. Single asterisk indicates a p value<0.02.
Next I investigated the effect of -catenin on IGF2 expression. By real time PCR (RT-qPCR) I evaluated the expression of different DNA segments across the IGF2 gene locus using 5 sets of primers spanning the junctions between the IGF2 cDNA sequence and the IGF2 intron 2. The only DNA segment whose transcription was induced by -catenin was within the second intron of the IGF2 that includes miR-483-3p (Fig 11B). Thus I concluded that -catenin activates a miR-483-3p promoter inside the second intron of IGF2.
Role and regulation of miR-483 in cancer Results
28
Figure 12. (A) Ability to activate the luciferase reporter vector pGL3-OT containing the b-catenin/TCF
responsive element by exogenous expression of b-catenin. pGL3-OF, which carries a mutated b-catenin/TCF binding site, was used as a negative control. (B) miR-483-3p (white bars) and CTNNB1 (black bars) relative expression in HCT116 cell line transfected with CTNNB1 and GAPDH siRNAs at 36 hours from transfection
To further confirm these results, I stabilized -catenin protein by treating HEK293 cells with lithium chloride (LiCl), an inhibitor of GSK3 which is responsible for -catenin degradation. Figure 11 shows that expression of the entire IGF2/miR-483 locus (miR-483-3p,
5p, pri-miR-483 and IGF2) was significantly activated (3 to 5 fold) by LiCl treatment.
Conversely, treatment with -catenin siRNA resulted in reduced expression of the miR-483 locus after LiCl treatment. IGF2 expression was still induced, although more weakly than the control (Fig 11C). This IGF2 induction by LiCl has not been previously described and is not necessarily due to -catenin because of the large number of pathways affected by GSK3B inihibition. Taken together, these results suggest that the miR-483 locus expression can be driven by -catenin independently from IGF2.
The zinc finger CCCTC-binding factor CTCF represses the genomic region upstream of the miR-483 locus. To explore the connection between -catenin and expression of the
miR-483 locus I cloned 4 fragments of different length including the putative miR-miR-483 promoter
(Fig 13A) upstream of the luciferase gene into the pGL4 enhancer vector (pGL4E). Figure 13B shows LiCl treatment causes significant induction of luciferase activity for all fragments except the small clone pGL4E-6907 (Fig 13B).
Role and regulation of miR-483 in cancer Results
29
Figure 13. Analysis of the miR-483 minimal
promoter region
responsive to
LiCl/CTNNB1 stimuli. (A) Genomic structure of
IGF2/483 locus from the reference AF517226 genomic sequence. Exons (black bars), start (ATG_5947) and stop codon (TGA_8745), the Ebox elements (gray triangle), the two predicted CTCF binding sites (black triangle), three CpG dinucletides around the CTCF binding sites (black circles), miR-483-3p and miR-483-5p (gray boxes) are shown. Are indicated the 5 genomic fragments cloned upstream the luciferase reporter gene in pGL4E for the analysis of the promoter on the bottom of the panel. The genomic region with insulator activity studied by Du et al. is indicated (broken line). (B) Luciferase activity of 4 genomic fragments cloned in pGL4E with and without LiCl treatment, the pGL4E empty vector was used as control. (C) Luciferase activity of the pGL4E_6487 wild type (WT) and the pGL4E_6487 mutated in the predicted CTCF binding sites (CTCFmut1and CTCFmut2). (D) Analysis of the Ebox element wild type (Ebox wt) and mutant (Ebox mut) by luciferase assay on the pGL4E_6487 CTCF mut1 and pGL4E_Ebox. Firefly luciferase activity was normalized on Renilla luciferase activity of the cotransfected pGL4R vector. Single asterisk indicates a p value<0.02, double asterisk indicates a p value>0.02.
Thus I inferred that the genomic region responsive to LiCl treatment is located between positions 6841 and 6907 of the reference sequence AF517226.
Because the luciferase activity in each of these vectors with or without LiCl treatment was always lower than the control (pGL4E empty vector), I suspected the presence of a repressive element within this region. Du et al. has shown that a 151 bp fragment (called IGF2-CBI by
the authors, Fig 13A), immediately upstream of the miR-483 stem loop, has strong insulator activity and binds to the CTCF repressor 53. CTCF is an important methyl sensitive regulator of transcription involved in the epigenetic regulation of genomic imprinted loci such as the IGF2/H19 locus in 11p15.5.
Role and regulation of miR-483 in cancer Results
30
Table 3. Methylation status of the 3 CpG dinucleotides close to the CTCF binding site
Cell line miR-483-3p relative expression Methylation status CpG 1 (%) Methylation status CpG 2 (%) Methylation status CpG 3 (%) H460 0.015 0 50 0 SNU 423 0.022 0 50 0 PLC/PRF/5 0.029 0 0 0 SNU 449 0.042 0 50 50 MDA MB231 0.23 75 100 50 K562 0.639 25 50 nc SW 480 0.697 0 0 nc SNU 387 0.759 25 50 nc SKHEP 1 0.789 0 0 0 HEK293 1 50 100 100 MCF7 3.543 75 100 100 HEPG2 23.87 100 100 100 HUH 7 44.985 100 100 100 HEPG2-C3A 51.464 75 100 100
CTCF binds DNA elements called insulators which set limits on the action of enhancer or silencer elements permitting to the genome to be organized in functional regulatory domains
54. It is involved in Wilms’ tumor 165556
, breast cancer 5758 and prostate cancer 59. I decided to determine if CTCF is also involved in the repression of the IGF2/mir-483 genomic regions I cloned. Using bioinformatics tools (http://insulatordb.uthsc.edu) I identified two possible CTCF binding sites (CTCF BS_1, CTCF BS_2) (Fig 13A). By transfecting the pGL4 vectors with mutated versions of either CTCF BS_2 or CTCF BS_1 to prevent CTCF binding, I observed a 2 or 4 fold increase of the luciferase activity compared to the wild type control (Fig 13C). Since the CTCF repressor only binds demethylated DNA, I analyzed the methylation status of 3 CpG dinucleotides close to the CTCF binding sites in a set of 14 cell lines. I found a significant positive correlation between the methylation level of the first CpG (CG_1, Fig 13A) and miR-483-3p expression (R=0.682, p=0.007), whereas the correlation with each of the other 2 CpGs was less significant (Tab 3). These data indicate that CTCF is an important regulator of the miR-483 locus and this regulation is likely affected by DNA methylation.
The transcription factor USF1 serves as a mediator between -catenin and the miR-483 locus. The minimal genomic region responsive to LiCl treatment (between nucleotides 6841 and 6907) contains an E-box motif (CACGTG) that could bind the basic Helix-Loop-Helix (bHLH) protein family. One of these bHLH proteins is the MYC transcription factor, a well known target of the Wnt/-catenin pathway, therefore it is reasonable to speculate that MYC
Role and regulation of miR-483 in cancer Results
31 could be involved in the LiCl regulation of the miR-483 locus. To test this hypothesis, I mutated the pGL4E-6487 in the E-box site and also mutated CTCF BS_1 to partially eliminate the repressive activity of this region. After co-transfection of -catenin and the reporter vectors into HEK293 cells there was a significant induction of luciferase activity in the wild type but not in the E-box mutant clone (Fig 13D). This confirmed the data obtained after LiCl treatment (Fig 13B) and identified within the E-box motif the sequence responsive to the -catenin/LiCl stimulation. Similar results were obtained with the vector clone containing only 69 base pairs around the E-box motif (pGL4E-6841-6910) (Fig 13D).
Figure14. MYC transcription factor repress miR-483 transcription. (A) PrimiR-483 expression in HEK293 cells
transfected with siRNA control (siCTRL) and specific a siRNA for MYC (siMYC), (B) on the same samples the MYC and CTNNB1 protein were assessed by western blot to ensure the MYC silencing and that CTNNB1 was not involved in this experiment (upper panel). The lower panel shows the MYC mRNA expression by qRT-PCR. (C) Luciferase activity of the pGL4E_Ebox wild type (wt) with and without treatment with LiCl in HEK293 cells transiently knocked down for MYC by siRNA (siMYC). Firefly luciferase activity was normalized on Renilla luciferase activity of the cotransfected pGL4R vector. Single asterisk indicates a p value<0.02, double asterisk indicates a p value >0.02.
Then I determined whether MYC is the -catenin mediator for miR-483 transcriptional activation. Since MYC is well expressed in HEK293 cells I knocked-down its expression using a specific siRNA and measured the relative expression of the precursor of miR-483 (pri-miR-483). Unexpectedly, this resulted in an increase in the expression of pri-miR-483 (Figs 14A-B). Similar results were obtained by a luciferase assay using the pGL4E-Ebox
Role and regulation of miR-483 in cancer Results
32 reporter vector in cells cotransfected with siRNA for MYC. These data indicate that MYC is not the responsible for the activation of the miR-483 locus after -catenin activation because of its suggested repressive role on miR-483 transcription.
Figure 15. USF1 serves a mediator between β-catenin and the miR-483 locus. (A) EMSA of
nuclear extract from HEK293 cells using the miR-483 Ebox probe. (lane 1-3, 5-7) or the mutant form (lane 4). The specific complexes are indicated by black arrows (b,c,d and e). Lane 7 shows the supershift generated by USF1 antibody (complex a). (B) Luciferase
assay of
pGL4E_Ebox wild type after enforced expression of USF1 and CTNNB1 using the pGL4E empty vector as control (left panel). The middle and right panels show the expression of miR-483-3p and IGF2 gene, respectively, after enforced expression of USF1 and CTNNB1. The miR-483-3p and IGF2 expression value of the empty vector were the controls. The exogenous expression of USF1 was assessed by western blot (upper panel). (C) Nuclear extract from HEK293 were immunoprecipitated with either USF1 (lanes 1-3) and CTNNB1 antibodies (lanes 4-6). After being washed, samples were run on SDS-PAGE gel and transferred to nitrocellulose. The blots were probed with USF1 and CTNNB1 antibody. (D) Nuclear extract from HEK293 with (lanes 1, 2) and without (lanes 3, 4) treatment with LiCl (20 mM for 24h) were imunoprecipitated with USF1 antibody and the blot probed for CTNNB1 protein. The Input shows an incremented quantity of CTNNB1 after LiCl treatment (lanes 5, 6). Vinculin protein expression was used as loading protein control. (E) GST-CTNNB1 and HIS-USF1 fusion proteins were subjected to GST (lanes 1,2) and HIS (lanes 3-5) pull-down analysis. Binding reaction products were washed, and proteins were separated by SDS-PAGE. The membrane was probed with both anti-CTNNB1, anti-USF1 and and GST antibodies. Single asterisk indicates a p value<0.02, double asterisk indicates a p value >0.02.
Role and regulation of miR-483 in cancer Results
33 Since the Ebox element can also bind to the Upstream Stimulating Transcription Factor 1 (USF1) I tested this interaction by Electrophoretic Mobility Shift (EMSA) and Super Shift assays, although no previous connection between USF1 and -catenin has been shown. USF1 is an evolutionary well conserved and ubiquitously expressed transcription factor involved in a wide number of cellular activities such as immune response, cell cycle and proliferation, and lipid and glucose metabolism 60. As shown in Figure 15A the EMSA assay generates a specific band shift pattern (complex b to e, lane 2, Fig 15A) that disappears in the mutant form of the Ebox element oligonucleotide (lane 4, Fig 15A). Moreover, by using the anti-USF1 antibody, a super-shift complex was generated (complex a, lane 7, Fig 15A) suggesting that USF1 recognizes the Ebox element upstream of the miR-483 locus.
Figure 16. (A) Western blot
analysis of catenin and USF1 in HEK293 cells transfected with the
catenin expression vector. Vinculin was used as protein load control .(B) Western blot analysis of USF1 protein in HepG2 cells transfected with USF1 siRNA at 72 hours from transfection (upper panel) and the corresponding miR-483-3p relative expression (lower panel). Single asterisk indicates a p value<0.02, double asterisk indicates a p value >0.02.
To confirm this result I cloned the coding sequence of the USF1 gene into pCMV-Tag vector and co-transfected it into HEK293 cells along with pIRES-Neo -catenin and the reporter vector pGL4E-6841-6910 with a wild type or mutant E-box (Fig 15B left panel). USF1 over expression was able to induce luciferase activity (2 fold) that was further increased in the presence of exogenous -catenin (about 3 fold) compared to the control. Similar results obtained by RT-qPCR for miR-483-3p showed that miR-483-3p was weakly induced by exogenous USF1 (p=0.05) but increased about 3 times with co-expression of USF1 and