Università degli Studi di
Salerno
Facoltà di Scienze Matematiche,
Fisiche e Naturali
“
Redox proteins for the
development of biosensors”
Corso di Dottorato in Chimica IX Ciclo
Anno Accademico 2007 – 2010Candidato
Franco De Martino ________________________
Tutor
A chi percorre la mia stessa strada . . . perché la felicità non viene stando seduti ad aspettarla.
Chapter one - Introduction ... 1
Abstract ... 1
Optical Biosensors ... 2
The proteins used in this work as molecular
recognition elements for toxic
gases... 4
Heme proteins ... 4
CcP (Cytochrome c peroxidase) ... 6
Mb (Myoglobin) ... 7
Fluorescence ... 8
F.R.E.T. (Forster resonance energy transfer) ... 10
The analytes under investigation: NO and H
2S ... 12
Nitric oxide ... 12
An application of the labeled –CcP system as NO
biosensor: an example in vivo ... 16
Hydrogen sulphide ... 19
List of abbreviation ... 23
Chapter two - Results and discussions ... 24
CcP: Nitric oxide Biosensor ... 24
Absorption spectra and F.R.E.T. system ... 24
Fluorescence spectroscopy ... 27
NO affinity and Determination of K
d... 30
Determination of NO binding kinetics ... 33
Selectivity and Control experiments ... 36
Immobilization in Sol Gel matrices ... 41
Application of the CcP_Atto620 NO Biosensor in
Arabidopsis thaliana suspended cells ... 45
Heavy metal stress and monitoring of the NO
production ... 45
Internal Cd
2+quantification ... 49
NO Quantification in Arabidopsis thaliana suspended
cells ... 50
Absorption spectra and F.R.E.T. system ... 52
Immobilization into sol gel matrices ... 57
Chapter three - Conclusions ... 59
CcP_Atto620. The Nitric oxide biosensor ... 59
CcP_Atto620 NO Biosensor in Arabidopsis thaliana
suspended cells ... 61
Myoglobin as a Hydrogen sulphide biosensor ... 63
Chapter four - Materials and Methods ... 64
Extraction and purification proteins ... 64
Protein labelling ... 64
Forster radius calculation ... 65
Absorption and fluorescence measurements ... 66
Release NO product and NO saturated solution ... 67
H
2S and (NH
4)
2S saturated solutions o synthesis ... 68
Sol Gel matrix ... 68
Cells cultures and treatments ... 69
Suspended cells and heavy metal stress in close system
... 70
Internal Cd
2+Quantification ... 70
H
2S measured and NO Quantification by Fluorescence
Analysis ... 71
Chapter one - Introduction
Abstract
In recent years the field of chemical sensors and optical biosensors has been developed considereably. A biosensor is a device composed of a biological component (Borisov and Wolfbeis 2008) that interacts with a target analyte (ion, molecule, etc.), in a highly specific and selective translation of a chemical or biological response into a measurable physical signal. A biosensor offers several advantages. In fact, it is highly specific with reproducibility in measurements, and a rapid response. The decisive impetus to this development was initially received by the medical industry. However, other sectors such as food quality control as well as environmental monitoring have expressed a recent growing interest in this area. There is therefore a need for a multidisciplinary approach to the subject.
Optical Biosensors
Optical biosensors are devices that offer a wide spectrum of advantages over traditional sensing systems, e.g. small size, longer lifetime and immunity to electromagnetic interference. When the binding of a target molecule is accompanied by a unique change in the spectroscopic characteristics (usually absorption or fluorescence) of the biomolecules this provides the basis for developing an optical biosensor (fig.1). A biomolecule suitable for implementation in a biosensor must possess two main characteristics:
specificity of binding the analyte proper signal transduction
Unfortunately, the terminology on biosensors is not systemic. Doctors tend to refer to “biosensors” as solid-phases-based diagnostic devices such as those for glucose, pregnancy markers, or cardiac markers. They should be referred to as test strips. Others, (mainly bioorganic chemists) often refer to molecular bioprobes as biosensors. (Borisov and Wolfbeis 2008)
Biosensors are classified according to the nature of the interaction, they establish with the analytesas well as the type of signal that reaches the transducer as a result of these interactions (electrochemical or optical biosensors).
The biosensors can also be divided into two groups: - Catalytic Biosensors
The first makes use of biocomponents that are capable of recognizing (bio)chemical species and transforms them into a product through a chemical reaction. This type of biosensor is represented mostly by enzymatic biosensors, which make use of specific enzymes or their combinations. Many whole-cell biosensors also rely on biocatalytic reactions. More recently, catalytically active polynucleotides (DNAzymes) have been used too. This type of biosensor also includes biosensors based on the measurement of the inhibition rate of a catalytic reaction by an inhibitor such as a heavy metal ion or a pesticide. Catalytic whole-cell sensors are often used to sense sum parameters such as toxicity, antibiotic activity, or cell viability. The latter may use of the specific capabilities of an analyte to bind to a biorecognition element. This group can be further divided into immunosensors (which rely on specific interactions between an antibody and an antigen), nucleic acid biosensors (which make use of the affinity between complimentary oligonuclotides), and biosensors based on the interaction between an analyte (ligand) and a biological receptor. Some whole-cell biosensors act as recognition elements responding to (trigger) substances by expressing a specific gene. (Borisov and Wolfbeis 2008)
Our goal is the development of optical affinity biosensors using heme proteins.
Fig. 1 Example design of an optical biosensor
ANALYTE
BIOMOLECULE
TRANSDUCTION
The proteins used in this work as molecular
recognition elements for toxic gases
Heme proteins
Hemeproteins, or heme proteins, are metalloproteins containing a heme prosthetic group, either covalently or noncovalently bound to the protein itself. Nature uses heme proteins to carry out a myriad of different biological functions. Since their discovery, the structural and functional aspects of heme proteins have fascinated biochemists and synthetic chemists alike (Pond et al. 1999) (Paoli M. et al. 2002). Nature has evolved heme binding sites within a variety of protein scaffolds (Martin et al. 1998) in order to carry out various task such as diverse tasks as electron transfer, substrate oxidation, metal ion storage, ligand sensing, (Chan M.K.J. 2000;Chan M.K.J. 2001) and transport.
The heme proteins involved in electron transfer were initially described in 1884 by MacMunn as respiratory pigments (myohematin or histohematin)(McMunn C.A. 1886). In the 1920s, Keilin rediscovered these respiratory pigments and named them “cytochromes” or “cellular pigments”, (Kellin D. 1925) and then classified them on the basis of the position of their lowest energy absorption band in the reduced state, as cytochromes a (605 nm), b (_565 nm), and c (550 nm).
There are many heme groups in nature. Heme b, also called protoheme. All the porphyrins are synthesized in vivo as the free base forms before incorporation of the iron(II) by the enzyme ferrocheletase.(Sellers et al. 2001;Wu et al. 2001). Additionally, heme b serves as the structure from which hemes a and c are biosynthetically derived.
Oxidation/reduction enzymes and metalloproteins represent more than 40% of the IUBMB classified proteins. They are not only vital to biological energy conversion in photosynthesis and respiration, but are also critical to a growing number of signalling processes governing gene regulation and expression. (Kennedy M.L and Gibney B.R. 2001)
Heme proteins are uniquely adapted to binding the important diatomic molecules O2, NO and CO. (Spiro T.G. and Jarzecki A.A. 2001)
Hemes remain one of the most visible and versatile classes of cofactor sused in biology. In fact, heme proteins are an integral component in numerous vital biological processes including steroid biosynthesis, aerobic respiration, and even programmed cell death. Found in both archaeaas well as higher organisms, the ubiquity of heme proteins further emphasizes their operational importance within biological systems.
This therefore makes heme protein an excellent candidate for optical biosensor development.
CcP (Cytochrome c Peroxidase)
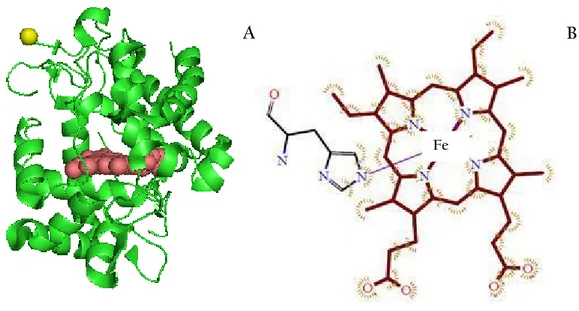
Cytochrome c Peroxidase (CcP) is a water-soluble heme-containing enzyme of the peroxidase family that takes reducing equivalents from cytochrome c and reduces hydrogen peroxidase to water. The yeast enzyme is a monomer of molecular weight 34,000 Da, located in the inter-membrane space of yeast mitocondria, containing 293 amino acids. It also contains a single noncovalently bound heme b (fig.2).
The metal center is composed of one atom of iron penta-coordinated with the sixth coordination site vacant and free to bind nitrogen monoxide. The resting state CcP (FeIII) contains a non covalently bound heme with a five-coordinate, high spin iron (S=5/2). The protein used in this project was a yeast extract and expressed in E. coli.
Fig. 2 A. Structure of CcP showing the heme (red spheres) and Leu 1 (yellow). Leu 1 corresponds to the attachment point of the label. The structure has been obtained from the PYMOL programme using the reported X-ray diffraction structure of CcP (PDB 1ZBY). B. Heme group.
A B
Mb (Myoglobin)
Myoglobin (Mb) is a single chain globular protein of 153 amino acids, containing a heme prosthetic group with iron in the center. It has eight alpha helices and a hydrophobic core (fig.3). It has a molecular weight of 16,700 Da, and is the primary oxygen-carrying pigment of muscle tissues. This protein does not exhibit cooperative binding of oxygen, since positive cooperativity is only a property of multimeric/oligomeric proteins only. On the other hand, the binding of oxygen by myoglobin is unaffected by the oxygen pressure in the surrounding tissue. High concentrations of myoglobin in muscle cells allow organisms to hold their breaths longer. Diving mammals such as whales and seals have muscles with a particularly high myoglobin abundance.
Myoglobin was the first protein to have its three-dimensional structure revealed. In 1958, John Kendrew and associates successfully determined the structure of myoglobin by high-resolution X-ray crystallography. John Kendrew shared the 1962 Nobel Prize for chemistry with Max Perutz for this discovery. The protein
used in this project was purchased from Sigma-Aldrich.
Fluorescence
Fluorescence can be seen as an energy dissipation process of optically excited atoms or molecules. In fact, when electrons move from a higher energy state to a lower one, the energy recovered can be issued in the form of electromagnetic radiation. Once the molecule has absorbed the incident radiation back to the ground state, the dissipation of the energy received can occur in two ways: 1. through encounters with other molecules such as solvent, or through motions that occur in solids, the energy emitted as heat, allowing the surrounding molecules to perform vibrations, rotations and translations, in fact, the molecule can transfer energy turns into kinetic energy, vibrational energy, etc. with the effect still being a heat increase;
2. in the molecule where it undergoes a radiative decay, with energy excess being released as photons, resulting in a spontaneous emission event which can be fluorescence or phosphorescence.
Fluorescence is the phenomenon in which a molecule struck by a light radiation at a certain wavelength (frequency of excitation) emits a wavelength more than another (frequency of issue). The fluorescent molecules (fluorophores, fluorochromes or fluorescent dyes) absorb light in a lower region of the spectrum (fig. 4 upper) and thereby emit light (photon energy) "Fluorescent" in an upper region of the spectrum at a higher wavelength ( ). In fact, after this absorption, outer orbital electrons move from one energy level to a higher (excited) one, where the stay at the top level is very short, about billionths of a second, after which the electrons return to the original energy level release
energy in the form of electromagnetic radiation (Photon emission)(fig.4 lower)(Lakovicz J.R. 1996). Since energy efficiency is never 100%, the radiation released is at a higher wavelength and thus less energy than excitation energy. The emission is shifted towards the red region than excitement because it is the area of lower energy. This phenomenon is known as the Stokes shift (Lakovicz J.R. 1996). Each molecule has a specific emission spectrum, with molecules that are able to emit light in a particularly efficient way when excited being defined as fluorophores.
F.R.E.T. (Forster resonance energy transfer)
Forster resonance energy transfer (FRET) is a process by which a fluorophore (the donor) in an excited state transfers its energy to a neighboring molecule (the acceptor) by nonradiative dipole-dipole interaction (Forster T. 1948;Lakovicz J.R. 1999). Although it is not necessary, in most cases the acceptor is also a fluorescent dye, also in this case. In this case, FRET also stands for fluorescence resonance energy transfer. This application of fluorescence is based on the fact that energy absorbed by a chromophor can be transferred to another chromophor yielding an increase of its fluorescence intensity, depending on the distance. (Stryer and Haugland 1967)
The excitation energy from a fluorescent donor molecule is transferred by a radiationless process to an acceptor chromophore, resulting in a decrease of donor fluorescence. The probability of this transfer (FRET efficiency, E) drops off as the inverse sixth power of the distance between donor and acceptor, R. Furthermore, the transfer efficiency (E) is a direct measurement of the fraction of photon energy absorbed by the donor that is transferred to an acceptor. Since E depends on the inverse of the sixth power of the distance r between the two fluorophores, E= R06 /(R06 + r6), FRET has become the technique of choice to observe protein-protein interactions as well as measure the distances between fluorophores (Clegg R 1996;Stryer 1978;Stryer and Haugland 1967). R0 is known as the “Forster distance” and represents a characteristic parameter of every dye pair defining the distance at which the efficiency is 50%. (Berney C. and Danuser G. 2003). Thus, if R0 is known, FRET efficiency can be used to estimate the donor–acceptor distance, R
In addition, R06~ 2 · J( ), where 2 is an orientation factor and J( ) is the overlap between the donor emission spectrum and acceptor absorption spectrum (fig.5).
In most cases fluorescent labels are used both as the donor as well as acceptor for FRET. However, the prosthetic group of a protein itself can also act as an acceptor. (Kuznetsova et al. 2006). In order to know the energy involved in the process, the transfer efficiency will be used to measure the performance of the biosensors.
The analytes under investigation: NO and H
2S
Nitric oxide
In 1992, NO was recognized by Science magazine as the „Molecule of the year‟. (Koshland, Jr. 1992). This reflected the discovery that NO plays a crucial role in a
variety of biological processes (E.Culotta 1992;Koshland, Jr. 1992). Further
investigations led to the finding that NO is a multifunctional effectors in numerous mammalian physiological processes, including the relaxation of smooth muscle, inhibition of platelet aggregation, neural communication and
immune regulation (Schmidt and Walter 1994). At micro molar concentrations
NO can lead to carcinogenic and neurodegenerative disorders (P.K.Lala 1998;Thomsen and Miles 1998).
Studies of NO chemistry have contributed to an understanding of NO signaling mechanisms that are achieved through its interaction with targets via a rich redox and additive chemistry (Stamler et al. 1992;Stamler 1994).
In 1998, three NO research pioneers (Robert F. Furchgott, Louis J. Ignarro and Ferid Murad) won the Nobel Prize for "Physiology or Medicine" for their discoveries relating to "the nitric oxide as a signaling molecule in the cardiovascular system".
The use of NO is not confined to the human health and the animal kingdom, in fact nitric oxide is a gaseous reactive molecule with a pivotal signaling role in many developmental and response processes (Besson-Bard et al. 2008;Neill et al. 2003).
The universal and unique role of the free radical NO as a biological signalling molecule is based on its physico-chemical properties which determine the mechanisms of the interaction with its targets and the nature of its movement.
Its hydrophobicity enables not only a rapid diffusion in a physiological environment but also the unhindered passage through lipid membranes, such as cell plasma membrane. NO is a free radical lipophilic diatomic gas under atmospheric conditions. Compared to other free radicals, NO has a rather low overall reactivity. It reacts predominantly with molecules that have orbitals with unpaired electrons, which are typically other free radicals or transition metals like heme iron.
NO is an ubiquitous by-product of high temperature combustion (Ball et al.
1999)as well as one of the hazardous exhaust gases generated by motor vehicles
(Dooly et al. 2008;Thomsen and Miles 1998). Emissions of these gases cause local and global environmental problems such as acid rain, greenhouse effects, destruction of the ozone layer and air pollution.
NO has created a great deal of interest in environmental science for many years, particularly due to its dual role in the catalytic formation and destruction of ozone (O
3). In NO-rich air, such as those encountered in industrialized regions, reactive nitrogen oxides (NO
x = NO + NO2) also play a key role in the chemistry of the lower atmosphere; NO is important for the atmospheric radical balance as well as the generation of photo-oxidants (Wildt et al. 1997).
Sources of NO
x may be both anthropogenic and natural. NOx concentrations may range up to 100 ppb in the air over industrialized (fossil fuel combustion) areas (Wildt et al. 1997). The release of NO from natural sources is mainly attributed to the activity of soil micro-organisms.
In the last decade, many devices were implemented to monitor NO. Real-time measurement of NO in biological preparations is often highly desirable. However, the instability of NO in aqueous solution and its high reactivity with various other species can cause difficulties in its measurement depending on the detection method employed (Lamattina et al. 2003).
Different techniques and methodologies can be used in measuring NO. It is possible to carry out:
direct measurements (gas chromatography, mass spectrometry, electrochemical, etc)
indirect measurements (Griess Reagent, 4,5-diaminofluorescein DAF-2,
etc)
In 1998 the first example of a fluorescence-based system for sensing NO was reported. The method made use of cytochrome c‟ immobilized on gold nanobeads as the sensing material. The sensor operates in a reversible way and the reported detection limit was 20 μM (Barker et al. 1998). One year later the same group improved the performance of this sensor by employing fluorescent ratiometric measurements. The improved sensor consisted of fluorescently labeled cytochrome c‟ incorporated within polystyrene nanobeads labeled with a fluorescent reference dye, whose emission allowed ratiometric (two wavelengths) measurements. Compared to the previous construct, the detection limit of the sensor was lowered to 8 μM (Barker et al. 1999a).
A relevant application of this NO sensing system is the measurement of NO produced by macrophages (Barker et al. 1998;Barker et al. 1999b) . The system relies on a FRET-based (Förster Resonance Energy Transfer) mechanism by which the dye fluorescence is attenuated as the protein binds NO. The observed
fluorescence changes were ascribed (Barker et al. 1998) to conformational
alterations in cyt c' induced by NO binding. This type of sensor is commonly referred to as a “turn-off” sensor since it exploits the quenching of the dye fluorescence upon analyte binding. FRET-based ratiometric fiber-optic NO sensors were prepared with the heme domain of soluble guanylate cyclase (Barker et al. 1999b). They also belong to the family of the “turn-off” sensors, and function in a similar way to the biosensors prepared with cytochrome c‟. With a
genetically encoded fluorescent indicator, NOA-1, the physiological nanomolar dynamics of NO in single living cells have been reported as detectable (Sato et al. 2005). The sensing system is suitable for monitoring NO release by endothelial cells, neurons and macrophages (Sato et al. 2005).
Kojima et al. in 1998 developed fluorescence probes based on the fluorescein chromophore which were able to detect intra-as well as extra-cellular NO (Kojima et al. 1998). The most common probe up to now is 4,5-diaminofluorescein (DAF-2). DAF-2 which itself shows only low fluorescence, reacts in the presence of oxygen with NO to form the highly fluorescent triazolofluorescein (DAF-2T). In particular DAF-2 reacts with NO derived species (notably N2O3) resulting from NO oxidation to yield a triazole fluorescent derivative (DAF-2T). DAF-2 is an impermeable. To order to measure intracellular NO, cells can be loaded with the membrane permeable DAF-2 diacetate (DAF-2DA) which can be taken up by the cells and hydrolyzed by cytosolic esterases to re-form the membrane-impermeable compound DAF-2. This compound is largely used in literature, with it being an indirect measurement.
An application of the labeled –CcP system as NO biosensor: an
example in vivo
In plants, NO can be synthesized via several routes, either enzymatically or by chemical reduction of nitrite. Nitrate reductase and a root-specific plasma membrane nitrite-NO reductase also utilize nitrites as a substrate. Although no plant NOS has been unambiguously identified yet, activity assays and pharmacological data suggests the existence of a NOS-like counterpart in plants. Depending on its concentration and possibly on the timing and localization of its production, NO can either act as an antioxidant or promote PCD, often in concert with ROS (Beligni et al. 2002;de Pinto et al. 2006;Delledonne et al. 2001). Extensive research has shown that NO plays a fundamental role in the hypersensitive response, but its involvement in other types of PCD, such as that resulting from mechanical stress and natural and cytokinin-induced senescence of cell cultures, has also been demonstrated (Carimi et al. 2005;Garces et al. 2001). Due to its participation in numerous biotic and abiotic responses, NO has been proposed as a general stress molecule (Gould et al. 2003). However, the mechanisms by which NO determines its effects are far from being completely explained, and a number of downstream signaling pathways, involving Ca2+, cyclic GMP, and cyclic ADP-Rib, are involved (Besson-Bard et al. 2008;Neill et al. 2003). NO can also modulate biological responses by direct modification of proteins, reacting with Cys residues (S-nitrosylation), Tyr residues (nitration), or iron and zinc in metalloproteins (metal nitrosylation) (Besson-Bard et al. 2008).
The ability of plants to accumulate and metabolize atmospheric NO has been known for some time (Nishimura et al. 1986). Moreover, measurement of gaseous emissions from plants has shown that NO can be synthesized in plants, through both non-enzymatic and enzymatic reactions (Leshem and Haramaty 1996;Yamasaki 2000). Interestingly, studies carried out over the past few years
have shown that NO is at the heart of several physiological functions ranging from plant development to defense responses (Beligni and Lamattina 2000;Durner and Klessig 1999).
Therefore, the chemistry of NO is the most important determinant of its function in biological systems and may be separated into two basic categories, i) direct effects and ii) indirect effects, primarily based on the concentration of NO. (Wink and Mitchell 1998).
Arabidopsis thaliana is a small flowering plant that is widely used as a model
organism in plant biology. Arabidopsis is a member of the mustard (Brassicaceae) family, which includes cultivated species such as cabbage and radish. Arabidopsis is not of major agronomic significance, but it offers important advantages for basic research in genetics and molecular biology. (www.arabidopsis.org)
Cadmium (Cd2+) is a heavy metal with a long biological half-life, and its presence as a pollutant in agricultural soil is due mainly to anthropogenic activities. It is rapidly taken up by roots and enters the food chain, resulting in toxicity for both plants and animals (di Toppi and Gabbrielli 1999). Cd2+ inhibits seed germination, decreases plant growth and photosynthesis, and impairs the distribution of nutrients. Overall, the symptoms of chronic exposure to sublethal amounts of Cd2+ mimic premature senescence.
Cd2+ pollution is of major concern, since it hampers plant growth by triggering inhibition of photosynthesis and nitrogen metabolism and by decreasing water
and mineral nutrient uptake. Moreover, Cd2+ accumulation in crops
compromises their commercial value and presents a potential risk to human health.
Although Cd2+ is an environmental threat, the mechanisms by which it exerts its toxic effects in plants are not fully understood. In plant cells, Cd2+ is believed to enter through Fe2+, Cd2+, and Zn2+ transporters/channels (Clemens 2006). Once
in the cytosol, Cd2+ stimulates the production of phytochelatins (PCs), a glutathione-derived class of peptides containing repeated units of Glu and Cys, which bind the metal ions and transports them into the vacuole (di Toppi and Gabbrielli 1999). There is a great deal of evidence exists that high (millimolar) concentrations of Cd2+ induce reactive oxygen species (ROS) bursts in plants, which might have a role in signaling and/or degenerative steps leading to cell death (Piqueras et al. 1999). Treatment with a lower, nontoxic Cd2+ concentration also caused an increase in ROS production in pea (Pisum sativum) leaves and roots (Rodriguez-Serrano et al. 2006) as well as Arabidopsis (Arabidopsis thaliana) cell cultures (Horemans et al. 2007) (De Michele et al. 2009).
NO was shown to participate in a wide spectrum of physiological processes, including germination, root growth, gravitropic bending, control of the timing of flowering, stomatal closure, and growth regulation of pollen tubes (Besson-Bard et al. 2008;Wilson et al. 2008). Furthermore, NO has also been implicated in the plant adaptive response to biotic and abiotic stresses, notably by acting as a signaling molecule (Delledonne 2005;Gould et al. 2003).
Several studies have investigated NO production during plant exposure to metals, including aluminium and iron (Gould et al. 2003).
NO production has been detected in Arabidopsis cell suspensions upon iron supply (Arnaud et al. 2006). In this context, NO appears to be a key element in the signal transduction pathway leading to the increase of the iron-storage protein ferritin at both mRNA and protein levels (Arnaud et al. 2006;Murgia et al. 2002).
The possibility that plant exposure to Cd2+ might modulate NO production has been reported, but conflicting results have been published regarding the impact of Cd2+ on NO production. Depending on the biological model, either Cd2+ mediated induction (Kopyra and Gwozdz 2003) or inhibition (Rodriguez-Serrano et al. 2006) of NO production has been reported (Besson-Bard et al.
2009). In the corresponding studies, the treatment of plants with artificially generated NO was shown to protect plant tissues against the oxidative damage triggered by Cd2+ by promoting the scavenging of reactive oxygen species (ROS) directly through chemical processes or indirectly via the activation of ROS scavenging enzymes (Kopyra et al. 2006;Noriega et al. 2007). Although informative, these studies did not take into account the possibility that NO might be endogenously produced in response to Cd2+ and, therefore, might exert specific roles in this particular physiological context. (Besson-Bard et al. 2009)
Hydrogen sulphide
Hydrogen sulphide (H2S) is a colorless gas with a very characteristic odor of rotten eggs which can be perceived organoleptically at concentrations as low as 0.025 ppm (Hirsch 2002).
It is considered one of the most dangerous environmental toxic and crude metabolic poisons. It is more toxic than hydrogen cyanide and exposure to as little as 300 ppm in air for just 30 min can be fatal in humans. (Li L. and Moore P.K. 2007;Strianese et al. 2010b). Nevertheless, hydrogen sulphide can also produce the deterioration on the normal function of several organs in the body including eyes, lungs, olfactory parts, nervous system, heart, brain, gastrointestinal system, and liver (Fuller D.C. and Suruda J. 2000).
H2S is one of the biologically active gases that occur naturally in the body. This molecule is synthesized by enzymes and has physiological and/or patho-physiological functions within the body (Li L. and Moore P.K. 2007). In the cardiovascular system, H2S relaxes vascular smooth muscle and inhibits smooth muscle cell proliferation. Thus, it plays a role in controlling blood pressure. It is an important factor in the development of some vascular diseases. In particular,
its deficiency can create a predisposition to vasoconstriction and hypertension. In addition it acts as a neuromodulator in the central nervous system. (Chen C.Q. et al. 2007;Li L. and Moore P.K. 2008;Reiffestein R.G. and Hulbert W.C. 1992)
This gas can be found in several natural sources: volcanic gases, marshes, sulfur springs, putrefying vegetable and animal matter. It is also present as an industrial by-product, coming from some petroleum refining, natural gas plants, coke oven plants, knot pulp mills, and tanneries (Choi M.M.F. and Hawkins P. 2003). This gas is a particular hazard for workers in the oil drilling and refining industries.
The interest in the detection of hydrogen sulphide arises from the detrimental effects that exposure to this gas has in areas such as: health, environment, and industrial facilities care (J.A.Kramer 1992).
The most common approaches for H2S detection are based on electrochemical and chromatographic techniques (Choi M.M.F. and Hawkins P. 2003). More recently, two methods based on polarography and carbon nanotubes coupled with a Raman and/or a confocal laser have shown promising results (Doeller J.E.et al 2005;Wu X.C. et al. 2007)
While each technique has its own advantages, there remains a need for simplicity in order to implement cheap H2S sensors that can be used repeatedly. With fluorescence-based methods it is possible, in principle, to develop such a sensor. Commonly used dye indicators contain Hg complexes so as to exploit the affinity of sulphide ions to the Hg ion. In 1999 a dye containing a complex of Hg(II) and 2,2‟-pyridylbenzimidazole with a detection limit of 4ppb of H2S was reported (Rodriguez-Fernandez J et al. 1999). In this case the fluorescence depends on the formation of a species formed upon release of HgS, meaning that the H2S is detected in an indirect way. A different dye tetraoctylammonium fluorescein mercury (II) acetate (TOAFMA) immobilized in ethyl cellulose (Choi M.M.F. and Hawkins P. 1997) and on PVC (Choi M.M.F. and Hawkins P.
2003) was been reported as a H2S sensor. In 2009 a small MW zinc complex was reported as a fluorescent sensor for H2S detection (Galardon et al. 2009). As they claim, the strong point of this sensing system is its (partially) aqueous solubility and its selectivity against other thiols (Galardon et al. 2009).
Project description
The aim of the work was to develop cheap, reliable and sensitive biosensors based on fluorescence. We have investigated the use of proteins provided by a porphyrin ring (heme) such as Cytochrome c Peroxidase as a recognition element that allows for the detection of nitric oxide (NO) and Myoglobin from horse skeletal muscle in order to develop a biosensor capable of detecting hydrogen sulphide (H2S). Since these gases affect human health, we tried to develop molecular systems useful to identify and quantify them in the environment.
These optical biosensors were developed using a FRET approach. The first goal was the development of an optical biosensor which was both easy to use as well as cheap.
Currently, there is a great deal of interest in NO, with a pressing need for methods capable of detecting NO in aqueous and gaseous media (Boon and Marletta 2006).
At present, the available technologies to monitor NO levels are based on chemiluminescent instrumentation (Kikuchi et al. 1993), amperometry (Mao et al. 1998), EPR spectroscopy (Kotake et al. 1996), colorimetric assays or porphyrin based fluorescent compounds (Lim and Lippard 2004).
Since each technique has its own advantages and disadvantages (Boon and Marletta 2006) (Nagano and Yoshimura 2002) (Lim and Lippard 2007) there is large space to implement, cheap NO sensors that can be easily used repeatedly and routinely (Franz et al. 2000). Fluorescence-based methods can, in principle, avoid some of the limitations of the existing methodologies.
Another goal of the project was the possibility to use the NO optical biosensor in an experiment in vivo in order to evaluate the possibility of using it in a real case. A part of this work was devoted to quantifying extracellular NO production. In this work, suspension cell culture of Arabidopsis thaliana was exposed to Cd2+ (CdCl2) as an “in vivo” system in order to monitor the extra cellular release of NO using a biosensor developed during the doctorate project.
The final aim of the project was the development of the H2S optical biosensors. In fact, H2S is considered one of the most dangerous environmental toxic and crude metabolic poisons and for this very reason developing a simple, selective and cost-effective sensing device for the monitoring H2S is of significant importance. H2S binding to Mb is possible and has benne demonstrated in literature (Nicholls P. 1961). With fluorescence-based methods it is possible, in principle, to develop such a biosensor.
List of abbreviation
Atto620 Atto620 NHS-ester
BSA Bovine serum albumin
CcP Cytochrome c‟ Peroxidase
Cy3 Cyanine 3 NHS-ester
Cy5 Cyanine 5 NHS-ester
DAF-2 4,5-diaminofluorescein
E Transfer efficiency
FRET Forster Resonance Energy Transfer
H2S Hydrogen Sulphide
kd Dissociation constant
LR Labeling ratio
Mb Myoglobin
NO Nitric Oxide
PCD Programmed cell death
PVC PolyVinyl chloride
R Distance
R0 Forster radius
ROS Reactive oxygen species
SR Switching ratio
Chapter two - Results and discussions
CcP: Nitric oxide Biosensor
Absorption spectra and F.R.E.T. system
Cytochrome c Peroxidase is a soluble heme protein. It is a structurally, spectroscopically and functionally well characterized protein. Resting state CcP (FeIII) contains a noncovalently bound heme with a five-coordinate, high spin iron (S= 5/2). The sixth coordination position is vacant, allowing ligands to bind (Barker et al. 1999b). Nitric oxide adducts of ferric Cytochrome c Peroxidase are stable and spectroscopically well characterized, as reported by Yonetani et al. already in 1972.
The overall properties of CcP make it an attractive candidate for developing a
“turn on” (Lim and Lippard 2007) FRET-based NO biosensor. In particular,
while the absorption spectrum of CcP exhibits a characteristic high spin marker
band at 645 nm (ε= 3 mM−1 cm−1) (Pond et al. 1999), the binding of NO leads to
the disappearance of this band (Yonetani et al. 1972)(see fig. 6A) (Strianese et al.
2010a). By attaching a fluorescent label to the protein, whose emission spectrum overlaps with the 645 nm band of the protein, this change in absorption upon NO binding can be translated into a change of fluorescence intensity of the label through a FRET mechanism. That is to say, when the protein is in the NO-free state, the label fluorescence becomes (partially) quenched as a result of FRET to the 645 nm band. As soon as NO binds to CcP, the latter band disappears and
the energy absorbed by the label is emitted as fluorescence, thus causing an increase in fluorescence. In this way the fluorescent dye acts as a passive “beacon” which is “off” in the NO-free state and “on” in the NO-bound state of the protein (fig 7). Two different labels, whose emission spectra overlap with the 645 nm spin marker band of CcP, were selected for this study: Cy5 and Atto620. The overlap of the 645 nm high spin marker band of CcP with the
emission spectrum of either Atto620 or Cy5 can be judged from fig. 6B (Strianese
et al. 2010a)
Fig. 6 Absorption spectrum of NO-free (black) and NO-bound (grey) CcP. Inset: 500–800 nm region of the spectrum with enlarged vertical scale showing the 645 nm high spin marker band of the NO-free CcP (black) and its disappearance in the NO-bound form (grey). B. Absorption spectrum of NO-free CcP (solid line) and emission spectra of Cy5 (λmax=665 nm) (dotted line) and of Atto620 (λmax=645 nm) (dashed line). All spectra measured at room temperature. Protein concentration: 8 μM in 100 mM potassium phosphate buffer (pH=6.8).
fig. 6fig. 7
CcP was labeled either with Atto620 or with Cy5. The pH of the labeling reaction was chosen so as to favour labeling of the N-terminus over lysine labeling. These conditions have been tested for the case of azurin, for which it was confirmed by electrospray MS that the label was exclusively present on the N-terminus (Kuznetsova et al. 2006). In the present case concentrations were chosen to ensure that the to-protein ratio was less than 1. While a small dye-to-protein ratio affects only the sensitivity of the experiment, a ratio larger than 1 leads to ambiguities in donor–acceptor distances between the attached label and the prosthetic group of the protein. Moreover, it has been found that proteins labeled with multiple amino-reactive labels show a decrease in fluorescence due to mutual resonance energy transfer (Gruber et al. 2000). To check the number of label molecules per CcP, electrospray ionization mass spectrometry was performed on different Atto620 labeled CcP samples. Only peaks arising from unlabeled and singly labeled proteins were observed, showing that no CcP molecules with multiple labels were present in the samples (see fig.8) (Strianese et al. 2010a).
Fluorescence spectroscopy
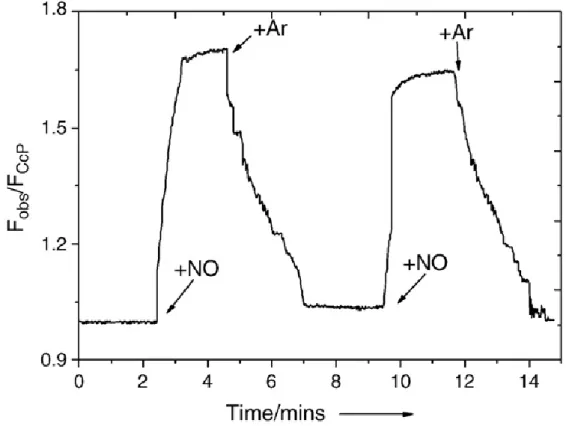
To test the system, the fluorescence intensity of N-terminally labeled CcP was monitored as a function of time during a change from an NO-saturated to an
NO-free environment. Fig. 9 shows a typical time trace of a solution containing
140 nM of dye-labeled CcP when excited at the absorption maximum (λ=619 nm) of the dye (Atto620).
Every experiment was brought in closed cuvette (mod. Hellma) to avoid contact
with atmospheric O2 and minimized its present in solution. In this particular
experiment to add NO we used Mahma nonoate (0,025M). Each cycle was started by adding NO to an end concentration of 360 μM (i.e., in considerable excess over the CcP concentration) and completed by passing argon through the solution for the complete removal of NO (fig.9) (Strianese et al. 2010a).
The dye emission was followed at 640 nm. A fast increase in label emission was clearly observed upon each NO addition. When bubbling through argon to displace the NO, the fluorescence intensity of the label diminished again; the cycle could be repeated many times (at least four times).
This finding showed that the NO binding process is reversible, which is crucial for practical sensing applications. The dye switching ratio (SR) defined by
SR= (FCcP-NO−FCcP) / FCcP-NO (1)
in which FCcP-NO and FCcP are the emission intensities of the bound and
NO-free protein, is 45 ± 5%. Of course SR ratio can vary depending on the type of dye used.
Fig. 9 Room temperature fluorescence intensity time trace observed at 645 nm (exc619 nm) of Atto620 labeled CcP, upon addition and removal of NO. The noise in the experimental trace after starting the bubbling of argon is due to the perturbation of the optical path of the measuring beam by the bubbling. Protein concentration: 140 nM in100 mM potassium phosphate buffer (pH=6.8).
This can be compared with the theoretical value which is given by
SR= E(CcP)- E(CcP-NO) / 1- E(CcP-NO) (2)
where E(CcP) and E(CcP-NO) are the theoretical FRET efficiencies in the
NO-free and NO-bound state of CcP. E is given by E = R06 /( R06 + R6) (Lakovicz J.R.
1996) where R0 is the Förster radius and R the distance between donor and
acceptor. In the present case, the estimated Förster radii for FRET from Atto620 to the heme are 4.2 nm for the NO-free and 3.6 nm for the NO-bound state of CcP, while the donor–acceptor distance from Atto620 to the heme is 3.0 nm (as estimated from the crystal structure of CcP from baker's yeast 1ZBY ).
This leads to theoretical transfer efficiencies of 0.88 for the NO-free state and 0.75 for the NO-bound state of CcP and a theoretical SR of 52%. Considering the uncertainties in the orientation factor, κ, (see Forster radius Eq.) and in the distance R, this value is in good agreement with the experimental value of 45 ± 5%. It was found that the maximum and minimum fluorescence levels slowly decrease with the number of cycles the sample solution had gone through. This could be due to partial denaturation of the CcP after bubbling argon through the solution to displace the NO. In fact the fluorescence intensity of the construct after adding NO remained constant for hours when the solution was left standing. Under the same conditions also Cy5 labeled CcP exhibited a
interesting SR of 40 ± 5%. In this case the theoretically estimated R0 values are
3.8 nm for the NO-free state and 3.3 nm for the NO-bound state and a theoretical SR of 56%. These experiments have been performed at pH 6.8 and provide a proof-of-principle for the proposed methodology.
NO affinity and Determination of K
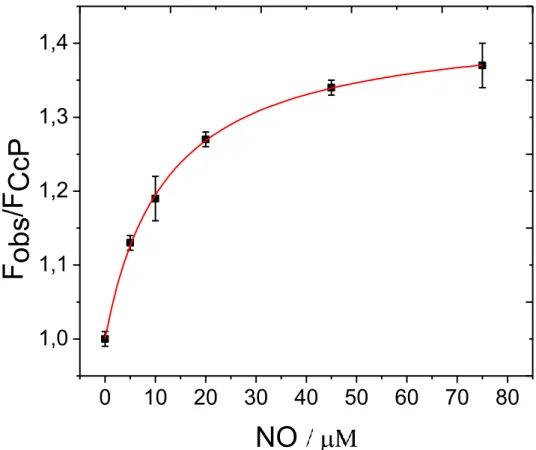
dTo determine the binding affinity of CcP for NO, NO titrations of labeled CcP were performed while monitoring the fluorescence intensity of the labels (Figs.
10, 11). The relation between the observed fluorescence intensity, FNO, and Kd is
given by (Zauner et al. 2007):
FNO = F0− (F0−F ) NO / NO + Kd (3)
where [NO] is the concentration of free NO in solution and F0 and F denote the
emission intensities of the NO-free and NO-bound protein, respectively.
According to Eq. (3) Kd is independent of the labelling ratio. A different labeling
ratio is equivalent to introducing a scale factor for the fluorescence intensities which leaves Eq. (3) invariant. Since the protein concentrations used in the experiments were small compared to the NO concentrations, for practical purposes the free [NO] could be set equal to the total amount of added NO and
the data points in (figs. 11, 12) could be directly fitted to Eq. (3) resulting in a Kd
of 9.4 ± 0.5 μM for the Atto620 CcP system and of 12.0±2 μM for the Cy5 CcP
construct. While we could not find literature data on the Kd for NO, the Kd
0
10
20
30
40
50
60
70
80
0,9
1,0
1,1
1,2
1,3
1,4
1,5
1,6
1,7
F
obs
/F
C
cP
NO /
Fig. 10 Titration of CcP/Atto620 with NO monitored by the dye emission (645 nm). The fluorescence intensity of CcP/Atto620 normalized on the fluorescence intensity in the absence of NO is plotted versus the total NO concentration. The solid line represents the best fit to the data [(Eq.(4)] with Kd = 9.4 ± 0.2. Protein concentration: 140 nM in 100 mM potassium phosphate buffer (pH =6.8)
0
10
20
30
40
50
60
70
80
1,0
1,1
1,2
1,3
1,4
F
obs
/F
C
cP
NO
Fig. 11 Titration of CcP/Cy5 with NO monitored by the dye emission (665 nm).
The fluorescence intensity of CcP/Cy5 normalized on the fluorescence intensity in the absence of NO is plotted versus the total NO concentration. The solid line represents the best fit to the data [(Eq.(4)] with Kd = 12.0 ± 0.6. Protein concentration: 60 nM in 100 mM potassium phosphate buffer (pH =6.8)
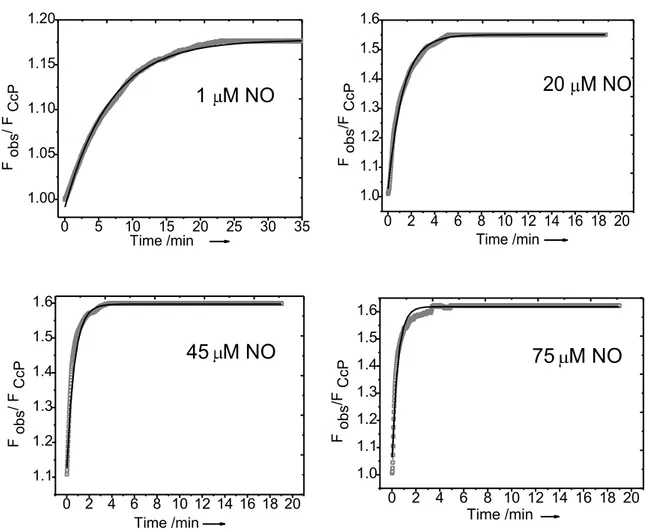
Determination of NO binding kinetics
To assess the NO binding kinetics, we focused on the Atto620 CcP system. The fluorescence of the labeled CcP was measured as a function of time after adding various amounts of NO in the range of 1–75 μM. The fluorescence time traces
(see Fig. 13) could be well fitted to an exponential function
Fobs = F0 + F(t = )- F0 1−exp(-kobs*t) (4)
When plotting the kobs values as a function of the NO concentration, a linear dependence was observed. As an example, in fig. 12 the data are shown that were observed on a sample containing 20 nM of Atto620 labeled CcP.
When using for kobs the expression kobs = koff +kon [NO] with koff the rate of dissociation of the NO from the CcP/NO complex and kon the second order rate constant for the association of NO and CcP, the following values could be extracted from the data in fig. 13:
koff = 0.22 ± 0.08 min−1 kon =0.024 ± 0.002 μM−1 min−1
From these a value of Kd= koff / kon = 9 ± 3 μM is found in agreement with the Kd values derived from the NO titrations.
Kd is the key parameter for determining the sensitivity of the sensor. Kd is defined as [CcP] [NO]/[CcP–NO] where [CcP] is the concentration of the NO-free and [CcP–NO] the concentration of the NO-bound CcP. The quantity by
0 2 4 6 8 10 12 14 16 18 20 1.0 1.1 1.2 1.3 1.4 1.5 1.6 F obs /F CcP Time /min 75 M NO 0 5 10 15 20 25 30 35 1.00 1.05 1.10 1.15 1.20 F obs / F CcP Time /min 1 M NO 0 2 4 6 8 10 12 14 16 18 20 1.0 1.1 1.2 1.3 1.4 1.5 1.6 F obs /F CcP Time /min 20 M NO 0 2 4 6 8 10 12 14 16 18 20 1.1 1.2 1.3 1.4 1.5 1.6 F obs / F CcP Time /min 45 M NO
which the sensitivity of the method can be judged is the ratio [CcP]/[CcP–NO]. This ratio varies strongly when the [NO] is close to the Kd. Therefore, with the proposed biosensing system, NO can be easily detected and quantified in the concentration range of between 1 μM and 100 μM with simple fluorescence detection. For instance, with activated macrophages the transient NO concentration in cells or tissue is in the micromolar range (Barker et al. 1999a) (Barker et al. 1999b).
Fig. 12 Examples of the best fits to the kinetic traces observed after addition of various amounts of NO to a solution of 20 nM labeled CcP [eq. used for fitting : Fobs= F0 + F(t = ) - F0 1-exp(-kobs·
Fig. 13 A. Fluorescence time traces of Atto620 labeled CcP after addition of NO; end concentration of NO: 1 (■); 10 (◊); 20 (✫); 30 (+); 45 (*); 75 (□) μM. The fluorescence time traces shown in panel A have been fitted to an exponential function (Fobs=F0+{F(t=∞)−F0}{1−exp(−kobs· t)}).
B. The values of kobs have been plotted as a function of the NO concentration. Protein concentration: 20 nM in 100 mM potassium phosphate buffer (pH=6.8). All time traces were measured at room temperature
The sensor described here would be suitable, therefore, for detecting extracellular macrophage derived NO. Other examples relate to monitoring of industrial exhaust gases where NO levels may rise into the micromolar range (E.Hawe 2007) (G.Dooly 2007), the study of the physiological effects of elevated NO levels in mammals (Bowen et al. 2007;Chapman and Wideman 2006), and the study of the equilibrium kinetics of transition metal complexes in which NO is one of the coordinating ligands (Bates et al. 1991;Roncaroli et al. 2003;Strianese et al. 2010a).
Selectivity and Control experiments
The fluorescence intensity of the Atto620 labeled CcP system upon NO binding
in the presence of large excesses of NO2−, NO3−, examples of biologically relevant
and potentially competing ions, was checked to obtain an indication on the
selectivity of the construct. It is evident from fig. 14 that in the presence of a
large excess of NO2− or NO3− over the protein concentration there is still a clear and large effect on the sample fluorescence when NO is introduced into the solution. NO2− causes a slight increase in the fluorescence (see fig. 14). It is known that NO2− under acidic conditions is partly converted into NO and the observed increase in fluorescence is ascribed to this effect.
Several research groups have examined the interaction of CcP with small ligands other than NO (e.g., CN−, F−, and CO) (Edwards and Poulos 1990) (Yonetani and Anni 1987). Some of the complexes formed upon interaction of CcP with small ligands were found not to be stable; for example the dioxygen adduct of CcP has a half life of 200 ms at 23 °C (Miller et al. 1994). By contrast, NO is one of the most powerful strong field ligands, which occurs on the right end of the spectrochemical series (Jorgensen C.K. 1962;Tsushida R 1938). One may expect, therefore, that the CcP–NO complex will exhibit excellent stability, which is clearly borne out when comparing, for example, the dissociation constant of the
CcP-F− complex (305 μM) (Yonetani and Anni 1987)with that of the CcP–NO
complex (10 μM, this project). This suggests that the binding of NO to CcP is strongly preferred over other analytes. This was a further reason toselect CcP for implementation in a NO biosensor.
To assess the potential of the NO sensing system in the presence of oxygen, the fluorescence intensity of CcP labeled with Atto 620 was monitored when saturating the buffer with oxygen prior to the measurements. A fast and sizeable increase in the fluorescence intensity upon NO addition is observed (fig. 15).
reaction of NO with O2, and that on the time scale of the measurement O2 does
not interfere with NO detection.
No significant changes in the fluorescence intensities were observed in: absence of NO
free dyes Cy5 or Atto620 labeled BSA
unlabeled CcP were used as sensing materials
Furthermore when adding 360 μM of nitrate, CO and oxygen, the proposed sensor did not exhibit a change in fluorescence (fig. 16). The lack of an effect of CO and O2 binding is most likely due to the fact that the CcP we are working with is in the Fe3+ state while O2 and CO have a strong preference for Fe2+. Differently, when adding 360 μM of nitrite, the fluorescence intensity of the system slightly increased. As argued above, this is probably due to the NO produced by nitrite (figs. 14, 15 and 16) (Strianese et al. 2010a).
The shelf life of the Ccp_Atto620 biosensor in solution was measured. We added 360 µM of NO (2mM NO saturated buffer) and find that the fluorescence signal decreased in the time, in fact after 7 days the fluorescence tends to zero (fig. 17).
Fig. 14 Fluorescence time trace of Atto620 labeled CcP after subsequent additions of 360 μM of NO3−, 360 μM of NO2− and 360 μM of NO. Protein concentration: 60 nM in100 mM potassium phosphate buffer (pH=6.8)
Fig. 15 Fluorescence intensity time trace of CcP/Atto620 upon NO binding in the presence of oxygen. Protein concentration: 70 nM in 100 mM potassium phosphate buffer (pH =6.8); air saturated solution ([O2] = 1.3 mM); [NO] = 400 µM
0
2
4
6
8
10
12
14
1,0
1,2
1,4
1,6
1,8
F
obs
/F
C
c
P
Time /min
+NO
0 2 4 6 8 10 12 3,0 3,5 4,0 4,5 5,0 5,5 6,0 6,5 7,0
F
obs
/F
C
cP
Time /mins 7days 3days 1dayFig. 17 Shelf life experiment of CcP Atto620 biosensor in 100 mM potassium phosphate buffer
0
10
20
30
40
1,0
1,2
1,4
1,6
1,8
F
obs
/F
C
c
P
Time /mins
CO
NO
-2
NO
-3
NO
O2
Fig. 16 Fluorescence intensity time traces of Atto620 labeled CcP after additions of 360 µM of CO, 360 µM of NO3-, 360 µM of NO2-, 360 µM of NO, 360 µM of O2. Freshly prepared Atto620 labeled CcP was used for each addition experiment. Protein concentration: 80 nM in 100 mM potassium phosphate buffer (pH =6.8). The data points for O2 are hidden behind those of CO and NO3-.
Immobilization in Sol Gel matrices
Inorganic gels have been known since the early developments of chemistry, with publications on the synthesis of silica gels from alkoxides in 1846 by Ebelmen M. (Ebelmen M. 1847).
In order to demonstrate the potential of the CcP protein based method for a solid-state NO sensing device, we combined the approach presented with an immobilization technique. This has the potential to provide a more stable and, above all, reusable sensor. Two requirements for an optically biosensor are (a) transparency and (b) inertness of the matrix chosen for the immobilization. These requirements are met by silica based matrices, which, especially in the last decade, have become an established tool for enzyme encapsulation giving rise to biocatalysts that can be easily recycled (Pierre A.C. 2004). By tuning the polymerization reaction conditions (e.g. pH) these so called sol–gel materials can be designed for a given specific application meaning that the gels can be tailored to a range of porous textures, network structures, surface functionalities and processing conditions. Furthermore, the manufacture of the sol–gel does not require harsh reaction conditions which is an advantage when working with the often delicate proteins that have to be incorporated in the matrix. It allows proteins to retain their native structure, spectroscopic properties and (catalytic) activity upon encapsulation into the matrix. The compounds by which the silica network is built around the enzyme are termed precursors. One of the most commonly used compounds is the Alkoxide tetramethoxysilane (TMOS), which is by far the best studied and the most used among a variety of precursors now available (Pierre A.C. 2004;Zauner et al. 2008) .
CcP N-terminally labeled with either Cy5 or Atto620 was entrapped in TMOS and immobilized on a quartz support.
The sol gel solution was quickly poured onto a home made device (8x30 mm2 quartz slide Heraeus 3 quality with a 1 mm thickness) yielding a roughly 0.6mm
thick sol-gel layer on top of the quartz slide. Then the fluorescence measures are made in closed cuvette (fig. 18) (see also Materials and methods).
Binding of NO to the immobilized and entrapped CcP was found to be reversible: insertion of the construct into an NO containing solution resulted in a fluorescence increase. Subsequent bubbling of argon through the solution removed the NO again (fig. 19). Labeled CcP immobilized into a TMOS matrix kept its activity in terms of SR and time response for more than 20 days when stored at 4 °C. The SRs observed were lower than the ones obtained in the solution measurements (e.g., in the case of 360 μM NO an SR of 20% was found with Cy5-labeled CcP when measuring the sol–gel sample, while 40± 5% was found in the bulk experiment). These findings may be related to a fraction of encapsulated protein not being accessible to the substrate or having been damaged and having lost its capability to bind NO. The fluorescence time traces could be fitted to the same exponential function as used for the solution experiments (see Eq. (4)).
Not surprisingly, the rates of NO binding were smaller, most likely due to the time needed for the NO to diffuse into the TMOS matrix. A similar behaviour was found for immobilized hemocyanin when it was used to monitor oxygen concentrations (Zauner et al. 2008).
30mm
8mm
295 and 645nm 665nm A BFig. 19 Fluorescence intensity time trace at 665 nm (exc 645 nm) of Cy5-labeled CcP entrapped into a TMOS-based sol–gel immobilized on a quartz support upon addition and removal of NO. During the measurement the sensing device was placed in 100 mM potassium phosphate buffer (pH=6.8) at room temperature. The fluorescence was recorded while alternatingly NO was added (to a final concentration of 360 μM) to the solution and removed by refreshing the buffer and bubbling argon through the solution
The shelf life of the sol gel device was measured. In this case we used CcP labeled with Cy5. We find that the fluorescence signal decreased in the time, in fact after 14 days we measured a signal loss of 75% with a S.R. which tends to background signals (fig. 20).
Fig. 20 A) Fluorescence measured of the sol gel with Ccp_Cy5 biosensor. NO saturated buffer used (2mM).
B) Switching ratio of the same experiment calculated in 4 weeks
0 1 2 3 4 5 6 280 285 290 295 300 305 310 315 320 325 330 Time /mins 1 day 7 days 14 days 21 days 28 days Fobs /FC c P A 0 2 4 6 8 10 12 14 16 18 20 22 24 26 28 3 4 5 6 7 8 9 10 11 12 13 14 15 16 S .R .= ( F C c P N O - F C c P ) / F C c P -N O Time / day SR B
Application of the CcP_Atto620 NO Biosensor in
Arabidopsis thaliana
suspension cell culture
Heavy metal stress and monitoring of the NO production
In (De Michele et al. 2009), Prof. Lo Schiavo and his groups was showed that Arabidopsis (Arabidopsis thaliana) cell suspension cultures underwent a process of programmed cell death when exposed to 100 and 150 mM CdCl2 and that this process resembled an accelerated senescence, as suggested by the expression of the marker senescence-associated gene12 (SAG12). CdCl2 treatment was accompanied by a rapid increase in nitric oxide (NO) and phytochelatin synthesis, which continued to be high as long as the cells remained viable. Hydrogen peroxide production was a later event and preceded the rise of cell death by about 24 h. Furthermore, they found NO maximun production after 24h to start the treatment. However, in this case they have used DAF-2 to measur the NO (indirect measure) and check the NO production in the time. In order to simulate this process, of course, we tried to design a similar experiment as describe by (De Michele et al. 2009), using a CcP-Atto620 biosensor instead of DAF-2, but with a fundamental difference in the design of the experiment. In fact, a Ccp-Atto620 biosensor measure directly NO extracellular concentration, therefore making it necessary to minimize or completely eliminate the O2 in the sample.Natutally, all the components and solutions were degassed with Argon, with the Arabidopsis cell suspension being inserted into closed glass vials in order to avoid or minimize O2 atmospheric contact.
0 5 10 15 20 25 30 35 40 1,0 1,1 1,2 1,3 1,4 Time / hours control 50uMCdCl2 100uMCdCl2 150uMCdCl2
F
obs
/F
C
cP
Fig. 21 NO in Arabidopsis suspended cells measured with DAF-2. On the Y axis we reported the
treatment. The fresh weight of the cells grown with 50 μM CdCl2 did not differ from that of the untreated cells at any time during the analysis. Cell cultures of
Arabidopsis were chosen as an experimental system because the homogeneity and
undifferentiated state of the cells, combined with the uniform delivery of the treatments, allow for a clear and reproducible response. The cell culture was transferred to a new AT3-medium weekly. We used three day old cell suspensions.
In order to verify the process, we prepared two parallel experiments under the same conditions but using the two different optical biosensors. Then we monitored over time the NO production in Arabidopsis thaliana cells suspensions. The first biosensor was Ccp_Atto620, developed in our laboratory, while the second is DAF-2 in reference to the method used in (De Michele et al. 2009). Both experiments were carried out under the same conditions.
The monitoring of the NO production is reported in the figs. 21 and 22. The difference of NO production, measured with DAF-2 (fig. 21) and Ccp_Atto620 (fig.22) is reported,with the different meaning between indirect and direct measurements of NO in fluorescence being shown.
The first result of this experiment with DAF-2 (fig. 21) reports the same results obtained from (De Michele et al. 2009). In fact, after 24h there is a maximun presence of NO at a maximun concentration of CdCl2.
With DAF-2, we carried out an indirect measurement. After 24h, there is a reduction of fluorescence which is probably caused by the rapid death of the cells due to the harsh conditions the cells were submitted to. This result means that we measured an accumulation of the oxidation product of NO in the extracellular environment.
Upon using the CcP_Atto620 biosensor we obtained similar results (fig 22). In fact at 24h, the maximum signal of the fluorescence at 150 μM of CdCl2 and after a rapid reduction of signal was observed. However, in this case a direct measurement of the NO present in the solution was obtained and not an indirect measured as in the case of DAF-2.
In this case we measured the NO production in that moment. At 24h also the signal of 50 and 100 μM CdCl2 was also consistent with the expected result as well as in DAF-2 (De Michele et al. 2009).
0 10 20 30 40 50 1,0 1,1 1,2 1,3 1,4
F
obs
/F
C
cP
Time /hours
control 50uMCdCl2 100uMCdCl2 150uMCdCl2This confirms that it is possible to use the Ccp_Atto620 biosensor in vivo with suspension cell culture and that the results for qualitative analysis are similar to another fluorescence method (DAF-2) used with standard methods.
In Ccp_Atto620 we used Cytochrome c‟ peroxidise as a biological component. It is a protein that has the function of taking reduced equivalents from cytochrome
c and reduces hydrogen peroxide to water. In (De Michele et al. 2009), in
addition to NO measurements, H2O2 was also considered. However, the measurements of H2O2 released in the culture medium revealed undetectable levels in untreated cells and in cells treated for up to 3 d with 50 μM CdCl2. At the higher concentrations, we observed a dose dependence with the CdCl2 initiation and an intensity of H2O2 production. Treatment with 100 μM CdCl2 resulted in an increase in H2O2 content at 72 h after treatment. At a concentration of 150 μM CdCl2, H2O2 levels increased at just 48 h after treatment and remained high the following day (De Michele et al. 2009). In this case they found the maximum amount of H2O2 after 48 h from the beginning of the experiment for a maximum of 0,8 μmol/gFW (De Michele et al. 2009) while at 24h they noticed values near zero.
Therefore we have considered the amount of H2O2 measured in the extracellular environment in 2009 (De Michele et al. 2009) and verified the tolerant CcP amount making a titration with H2O2, verifying the difference in UV-Vis spectra. In fact if no modification in the UV spectra under 0,8 μmol/gFW was showed the CcP isn‟t “annoyed” to H2O2 present in extracellular environment.
In fig. 23 we report that at least 350nM of H2O2 is required to modify CcP UV spectra ( and bands, respectively 535 and 560 nm) and then the fluorescence system when the protein is labelled. However, we assume a lower amount of H2O2 within 24h. All the experiments were repeated at least twice.
Internal Cd
2+quantification
In order to confirm whether Cd2+ ions were able to enter the cells, we measured their internal concentration through atomic absorption spectrometry. The amount of Cd2+ inside the cells was correlated to the treatment dose. Sampled cells treated with 50 mM CdCl2 after 48h contained 0,194 nmol mg-1 dry weight Cd2+, whereas treatments with concentrations of 100 and 150 mM resulted in 5.21 nmol mg-1 dry weight and 6.15 nmol mg-1 dry weight internal Cd2+, respectively. The cells were treated as described in Materials and Methods.
250 300 350 400 450 500 550 600 650 700 750 0,00 0,01 0,02 0,03 0,04 0,05 0,06 0,07 Abso rp tio n wavelength 0nM 50nM 100nM 150nM 200nM 300nM 400nM 417 410 533 560 250 300 350 400 450 500 550 600 650 700 750 0,00 0,01 0,02 0,03 0,04 0,05 0,06 Abso rp tio n wavelength Ccp H2O2 (100uM) 0nM 300nM
Fig. 23. Titration of Ccp with H2O2 100μM.We verified the coordination of the H2O2 to CcP. We considered the change of Soret, and bands.