_______________________
APS-American Journal of Physiology-Gastrointestinal and Liver Physiology zh3-7420
Reprint No: 3991917
Dear Sir or Madam:
Please refer to this URL address http://rapidproof.cadmus.com/RapidProof/retrieval/index.jsp
Login: your e-mail address as listed in the 'to' line of this e-mail message.
Password: t4gwqRFt2ft6
The attached file contains a proof of your article, with query list.
Adobe Acrobat® tools should be used to mark proof; see detailed instructions in this packet.
1) Corrections must be limited. Note that all corrections are subject to evaluation by APS.
2) Answer all author queries (AQ1, AQ2, AQ3, etc.) listed on the last page of the PDF file.
3) Proofread entire document, paying close attention to any tables and equations (these elements often
require recreating author's original files).
4) Carefully check any special characters or symbols.
5) Return the corrected set of page proofs WITHIN 2 BUSINESS DAYS to [email protected].
6) Figures portray those images approved and authorized by the authors at acceptance; hence, changes are
not permitted at galley proof stage, except for the most serious of reasons. If an error is discovered, contact
me immediately (see below).
Please contact me immediately at [email protected] so that I know you have received this message and
have successfully downloaded your PDF proof.
PLEASE INCLUDE YOUR MANUSCRIPT NO. (GI-00231-2017) WITH ALL CORRESPONDENCE.
Joseph Girouard
Journal Editorial Supervisor
American Journal of Physiology-Gastrointestinal and Liver Physiology
9650 Rockville Pike, Bethesda, Maryland 20814-3991 (USA)
Email (preferred) [email protected]. Phone (if needed) 301-634-7223
*************************************************************************
REPRINTS: To order reprints of your article, please go to
http://www.the-aps.org/Link-Library/Pubs/Reprint-Order-Form.pdf. Then email the completed form to [email protected].
************************************************************************
To help us facilitate any necessary late-stage corrections, we encourage authors to use the
comments and notes features in Adobe Acrobat. The PDF provided has been "comment
enabled," which allows the user to utilize the comments and notes features in Adobe Acrobat,
even if using only the free Adobe Acrobat reader (see note below regarding acceptable
versions). Adobe Acrobat's Help menu provides additional details on the tools. When you
open your PDF, the comments/notes/edit tools are clearly shown on the tool bar. The
important features to know are the following:
•
Note tool (yellow text balloon icon): Click on this feature on the tool bar and then click on
a point of the PDF where you would like to make a comment. This feature is useful when
providing an instruction to your production contact or to verify a question or change that was
posed.
•
Text edits ("T" with strike-through and caret icon): The option Insert Text at Cursor allows
the user to place the cursor at a point in the text, which will then provide a pop-up box to add
the appropriate text to be added to the proof.
•
Use the Strike-Out tool to indicate deletions to the text.
As with hand-annotated proof corrections, the important points are to communicate changes
clearly and thoroughly, to answer all queries and questions, and to provide complete
information for us to make the necessary changes to your article so it is ready for publication.
To use the comments/notes features on this PDF you will need Adobe Reader version 7
or higher. This program is freely available and can be downloaded
• Use the Strike-‐Out tool to indicate deletions to the text.
• Use the Highlighting Tool to indicate font problems, bad breaks, and other
ttextual inconsistencies.
• Clearly indicate where changes need to be made using arrow
s, lines, and the
Call-Out Tool.
• Mark changes and answer queries in the margins and other areas of white space.
• Avoid obscuring the text with corrections.
• Use the Text Boxes and the Callout Tool to indicate changes to the text
RESEARCH ARTICLE
Nutrient Sensing, Nutrition, and Metabolism
A specific amino acid formula prevents alcoholic liver disease in rodents
LauraTedesco,1GiovanniCorsetti,2ChiaraRuocco,1MaurizioRagni,1FabioRossi,1Michele O. Carruba,1
AlessandraValerio,3* andXEnzoNisoli1*
1Department of Medical Biotechnology and Translational Medicine, Center for Study and Research on Obesity, University of
Milan, Milan, Italy;2Department of Clinical and Experimental Sciences, University of Brescia, Brescia, Italy; and 3Department of Molecular and Translational Medicine, University of Brescia, Brescia, Italy
Submitted 28 July 2017; accepted in final form 23 January 2018
Tedesco L, Corsetti G, Ruocco C, Ragni M, Rossi F, Carruba MO, Valerio A, Nisoli E. A specific amino acid formula prevents
alcoholic liver disease in rodents. Am J Physiol Gastrointest Liver
Physiol 314: G000 –G000, 2018. First published January 25, 2018;
doi:10.1152/ajpgi.00231.2017.—Chronic alcohol consumption pro-motes mitochondrial dysfunction, oxidative stress, defective protein metabolism, and fat accumulation in hepatocytes (liver steatosis). Inadequate amino acid metabolism is worsened by protein malnutri-tion, frequently present in alcohol-consuming patients, with reduced circulating branched-chain amino acids (BCAAs). Here we asked whether dietary supplementation with a specific amino acid mix-ture, enriched in BCAAs (BCAAem) and able to promote mito-chondrial function in muscle of middle-aged rodents, would pre-vent mitochondrial dysfunction and liver steatosis in Wistar rats fed on a Lieber-DeCarli ethanol (EtOH)-containing liquid diet. Supplementation of BCAAem, unlike a mixture based on the amino acid profile of casein, abrogated the EtOH-induced fat accumulation, mitochondrial impairment, and oxidative stress in liver. These effects of BCAAem were accompanied by normaliza-tion of leucine, arginine, and tryptophan levels, which were re-duced in liver of EtOH-consuming rats. Moreover, although the EtOH exposure of HepG2 cells reduced mitochondrial DNA, mitochondrial transcription factors, and respiratory chain proteins, the BCAAem but not casein-derived amino acid supplementation halted this mitochondrial toxicity. Nicotinamide adenine dinucle-otide levels and sirtuin 1 (Sirt1) expression, as well as endothelial nitric oxide (eNOS) and mammalian/mechanistic target of rapa-mycin (mTOR) signaling pathways, were downregulated in the EtOH-exposed HepG2 cells. BCAAem reverted these molecular defects and the mitochondrial dysfunction, suggesting that the mitochondrial integrity obtained with the amino acid supplemen-tation could be mediated through a Sirt1-eNOS-mTOR pathway. Thus a dietary activation of the mitochondrial biogenesis and function by a specific amino acid supplement protects against the EtOH toxicity and preserves the liver integrity in mammals.
NEW & NOTEWORTHY Dietary supplementation of a specific
amino acid formula prevents both fat accumulation and mitochon-drial dysfunction in hepatocytes of alcohol-consuming rats. These effects are accompanied also by increased expression of anti-reactive oxygen species genes. The amino acid-protective effects likely reflect activation of sirtuin 1-endothelial nitric oxide syn-thase-mammalian target of rapamycin pathway able to regulate the cellular energy balance of hepatocytes exposed to chronic, alco-holic damage.
alcoholic liver disease; branched-chain amino acids; endothelial nitric oxide synthase; mechanistic target of rapamycin; mitochondrial biogen-esis
INTRODUCTION
An excessive and chronic alcohol consumption may cause alcoholic liver disease (ALD), a major global health problem (68). ALD is a spectrum of liver pathologies mainly charac-terized by fat accumulation and ranging from steatosis to steatohepatitis, fibrosis, and cirrhosis, which can eventually progress to hepatocellular carcinoma (47). In particular, the early stages of the disease are associated with vesicular steato-sis, caused by defective fatty acid oxidation (13). All of the alcohol-metabolizing enzymes, including alcohol dehydroge-nase (ADH), catalase (Cat), NADPH-oxidase, xanthine oxi-dase, and the microsomal alcohol oxidizing system, lead to acetaldehyde accumulation in liver. Acetaldehyde can be oxi-dized to acetate, mainly through aldehyde dehydrogenases (ALDH), which are mitochondrial, nicotinamide dinucleotide (NAD⫹)-dependent enzymes, so the concentration of the re-duced pyridine coenzyme NADH increases and the NAD⫹/ NADH ratio decreases in hepatocytes. Such an imbalance has been classically proposed to explain several of the metabolic changes produced directly in liver cells by alcohol oxidation, including triglyceride accumulation (18). Similarly, sirtuin 1 (Sirt1), a NAD⫹-dependent protein deacetylase that removes posttranslational acyl modifications from various cellular sub-strates to regulate a wide range of biological pathways (14), was found to be reduced in liver of alcohol-consuming animals (49). Sirt1 controls hepatic gluconeogenesis/glycolytic cesses and mitochondrial biogenesis, through peroxisome pro-liferator-activated receptor-␥ coactivator 1␣ (PGC-1␣) (56, 80). Moreover, Lieber and coworkers (49) have demonstrated that Sirt1 and PGC-1␣, acting as a complex, can physiologi-cally regulate the activity of each other in liver of alcohol-consuming animals.
Although the adverse effects of excessive alcohol consump-tion on liver mitochondria are well known (11, 32), the mo-lecular impairment impinging on the alcohol-dependent mito-chondrial dysfunction remains to be defined. Incapacity to maintain adequate ATP concentrations, associated with re-duced activities of all of the respiratory complexes (except complex II) (22), impaired mitochondrial protein synthesis (17), mitochondrial DNA (mtDNA) damage (12), and ribo-somal defects (10), has been suggested to cause failing
* A. Valerio and E. Nisoli equally contributed to this work.
Address for reprint requests and other correspondence: E. Nisoli, Dept. of Medical Biotechnology and Translational Medicine, Univ. of Milan, via Vanvitelli, 32, 20129, Milan, Italy (e-mail: [email protected]).
0193-1857/18 Copyright©2018 the American Physiological Society
http://www.ajpgi.org G1 AQ: 1 AQ: au AQ: 3 AQ: 2 DOCHEAD⫽ ; DOCTOPIC ⫽ OK OK OK OK
oxidative phosphorylation. These processes increase reac-tive oxygen species (ROS) production and oxidareac-tive damage in the steatotic liver, accompanied by a marked mitochon-drial dysfunction (54).
Beyond their role as key building blocks for protein synthe-sis, amino acids, particularly the branched-chain amino acids (BCAAs), are also significant sources of sterol, ketone bodies, and glucose (9). Mammalian/mechanistic target of rapamycin (mTOR) complex 1 (mTORC1), which is acutely sensitive to rapamycin and amino acid availability, mediates some of these processes (84). We have recently shown that dietary supple-mentation with a BCAA-enriched mixture (BCAAem) acti-vated endothelial nitric oxide synthase (eNOS) with increased NO production in cardiac and skeletal muscle of middle-aged mice (23). Notably, the BCAAem-induced NO promoted mTORC1-dependent mitochondrial biogenesis and function in muscle cells (23). Because altered amino acid metabolism is a hallmark of ALD, with low levels of circulating BCAAs (15), the present study aimed to investigate the effects of BCAAem supplementation on the mitochondrial damage in liver of chronically ethanol (EtOH)-consuming rats. Our results dem-onstrate that this specific amino acid supplementation was able to prevent both structural mitochondrial damage and mitochon-drial dysfunction in liver of alcoholic rats. We found that anti-ROS defense system, eNOS, and mTOR pathways likely play an important role in the protective effects of dietary BCAAem supplementation in hepatic cells. Together, our re-sults support the potential usefulness of dietary supplementa-tion with a specific amino acid formula to prevent ALD in humans.
MATERIALS AND METHODS
Animals and treatments. The experimental protocol was approved
and conducted in accordance with the European Communities Council Directive of November 24, 1986 (86/609/EEC) and the Italian Min-istry of Health and complied with The National Animal Protection Guidelines. For experiment 1, a total of 26 male Wistar rats (3 mo old) from Charles River (Calco, Como, Italy) were used. The animals were housed separately in clean polypropylene cages and divided into four groups: 1) the pair-fed group (pair-fed Ctrl, n⫽ 6) was fed with a control liquid diet, in which EtOH was replaced by isocaloric maltose dextran; 2) the EtOH group (EtOH, n⫽ 7) was fed with a Lieber-DeCarli liquid diet containing EtOH ad libitum [gradually increasing amount of EtOH, reaching 36% of caloric intake after 1 wk, corre-sponding to a final concentration of 6.2% (vol/vol)]; 3) the BCAAem group (BCAAem, n⫽ 6) was fed with a control liquid diet, in which EtOH was replaced by isocaloric maltose dextran and supplemented with BCAA mixture (10 g/l), that provided 1.5 g·kg⫺1·day⫺1 BCAAem; and 4) the EtOH plus BCAAem group (EtOH ⫹ BCAAem, n⫽ 7) was fed with a Lieber-DeCarli liquid diet contain-ing EtOH and BCAAem ad libitum.
For experiment 2, a total of 30 male Wistar rats (3 mo old) were divided into five groups: 1) the pair-fed group (Ctrl, n ⫽ 6); 2) the EtOH group (EtOH, n⫽ 6); 3) the EtOH plus BCAAem group (n ⫽ 6) were fed as in experiment 1; 4) the casein-amino acid group (CAA,
n⫽ 6) was fed with a control liquid diet, in which EtOH was replaced
by isocaloric maltose dextran and supplemented with purified amino acid mixture based on the amino acid profile of casein (10 g/l) (which is the main protein source in rodent laboratory diet), that provided 1.5 g·kg⫺1·day⫺1CAA supplement; and 5) the EtOH plus CAA group (EtOH ⫹ CAA, n ⫽ 6) was fed with a Lieber-DeCarli liquid diet containing EtOH and CAA mixture ad libitum. All of the diets were isocaloric with each other, and they were obtained from Bio-Serv
(Frenchtown, NJ). The composition of each diet is described in Table 1. The amino acid concentrations of BCAAem used were previously found to be active in rodents and mimic the recommended daily dose for humans (23). Dietary treatments were prolonged for 8 wk, in a 12-h:12-h light/dark cycle at 22°C, in a quiet, temperature- and humidity-controlled room. The BCAAem composition, amino acid relative percentage, and dietary intake of each amino acid have been reported in D’Antona et al. (24). Body weight and food intake were recorded twice a week. At the end, animals were killed by guillotine. Left lobe of liver was fixed for microscopy analysis, whereas the rest of the organ was quickly frozen in liquid nitrogen and stored at – 80°C for subsequent analysis.
Sample preparation. Liver (n⫽ 4 animals/group) was weighted,
homogenized in cold methanol:water (vol/vol, 1:1), and extracted according to Want et al. (76). The vacuum-dried samples were suspended in 120l/50 mg tissue of methanol:1 mM TDFHA (1:1) and centrifuged at 16,000 g for 10 min at 4°C. Two microliters of supernatant was directly loaded onto the ultra-performance liquid chromatography (UPLC)-mass spectrometer and analyzed as reported below. Four technical replicates for each sample were run using the three different methods.
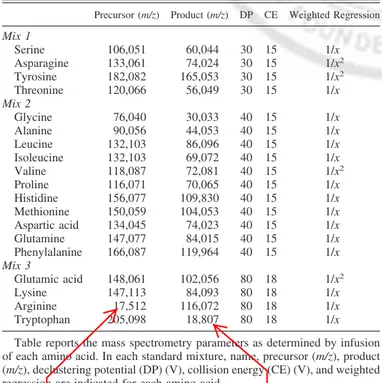
Chromatography and amino acid quantification in liver. Standard
amino acids were purchased from Sigma (Milan, Italy). Each amino acid stock solution was prepared at 1 mg/ml in water, diluted to the final concentration of 3 pmol/l, and directly infused by syringe at 10 l/min into the TripleTOF 5600⫹ mass spectrometer (AB Sciex,
Milan, Italy). Thus declustering potential (DP) and collision energy (CE) were optimized for each amino acid. Three mixtures of amino acids were next prepared on the basis of DP and CE values: mix 1,
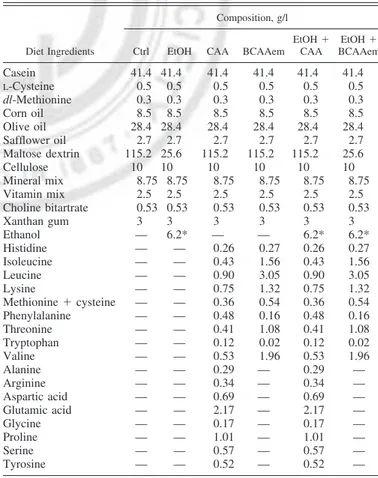
Table 1. Composition of diets used in the present work
Diet Ingredients
Composition, g/l
Ctrl EtOH CAA BCAAem EtOH⫹ CAA EtOH⫹ BCAAem Casein 41.4 41.4 41.4 41.4 41.4 41.4 L-Cysteine 0.5 0.5 0.5 0.5 0.5 0.5 dl-Methionine 0.3 0.3 0.3 0.3 0.3 0.3 Corn oil 8.5 8.5 8.5 8.5 8.5 8.5 Olive oil 28.4 28.4 28.4 28.4 28.4 28.4 Safflower oil 2.7 2.7 2.7 2.7 2.7 2.7 Maltose dextrin 115.2 25.6 115.2 115.2 115.2 25.6 Cellulose 10 10 10 10 10 10 Mineral mix 8.75 8.75 8.75 8.75 8.75 8.75 Vitamin mix 2.5 2.5 2.5 2.5 2.5 2.5 Choline bitartrate 0.53 0.53 0.53 0.53 0.53 0.53 Xanthan gum 3 3 3 3 3 3 Ethanol — 6.2* — — 6.2* 6.2* Histidine — — 0.26 0.27 0.26 0.27 Isoleucine — — 0.43 1.56 0.43 1.56 Leucine — — 0.90 3.05 0.90 3.05 Lysine — — 0.75 1.32 0.75 1.32 Methionine⫹ cysteine — — 0.36 0.54 0.36 0.54 Phenylalanine — — 0.48 0.16 0.48 0.16 Threonine — — 0.41 1.08 0.41 1.08 Tryptophan — — 0.12 0.02 0.12 0.02 Valine — — 0.53 1.96 0.53 1.96 Alanine — — 0.29 — 0.29 — Arginine — — 0.34 — 0.34 — Aspartic acid — — 0.69 — 0.69 — Glutamic acid — — 2.17 — 2.17 — Glycine — — 0.17 — 0.17 — Proline — — 1.01 — 1.01 — Serine — — 0.57 — 0.57 — Tyrosine — — 0.52 — 0.52 —
The different diets are isocaloric. EtOH, ethanol; BCAAem, branched-chain amino acid-enriched mixture; CAA, casein-amino acid. *Ethanol is expressed as percentage (vol/vol).
AJP-Gastrointest Liver Physiol•doi:10.1152/ajpgi.00231.2017•www.ajpgi.org
containing threonine, asparagine, tyrosine, and serine, and analyzed with DP 30 V, CE 15 V; mix 2, containing glycine, alanine, leucine, isoleucine, valine, proline, histidine, methionine, aspartic acid, glu-tamine, and phenylalanine, and analyzed with DP 40 V, CE 15 V; and
mix 3, containing glutamic acid, lysine, arginine, and tryptophan, and
analyzed with DP 80 V, CE 18 V. All of the amino acids were acquired in the positive polarity, in both time-of-flight mass spectrom-etry and Product Ion mode, according to the m/z values reported in Table 2. The source parameters were as follows: gas 1, 33 psi; gas 2, 58 psi; curtain gas, 25 psi, temperature 500°C, and IonSpray Voltage Floating 5,500 V.
To obtain calibration curves, technical quadruplicates of different amounts (10, 33, 50, 100, 200, 400 pmol) of the three mixtures were injected into the mass spectrometer upon UPLC separation, using the UPLC 1290 (Cernusco sul Naviglio; Agilent Technologies Italia, Milan, Italy). The chromatographic column was Acquity HSS (T3 C18 2.1 ⫻ 100 mm, 1.7 m; Waters, Milford, MA), whereas the mobile phase was 1) 1 mM tridecafluoroheptanoic acid (TDFHA) in water, 2) 1 mM TDFHA in acetonitrile. A gradient from the latter from 12.5 to 26.5% in 4 min, followed by a ramp from 26.5 to 92% in 3.5 min was used to separate all of the amino acids, with a flow rate of 0.35 ml/min and a column temperature of 65°C as described (43). The autosampler was set at 4°C. Calibration curves were plotted using chromatographic peak areas and a weighted regression (1/x for all compounds except asparagine, tyrosine, valine, and glutamic acid, which were fit to 1/x2) by means of MultiQuant software version 2.1
(SCIEX, Framingham, MA). Quantitative values for each amino acid (pmol) in the rat liver samples were obtained by relating chromato-graphic peak areas to those derived from externally run calibration standards and normalized to tissue (mg).
Liver histopathological analysis. Liver was cut in 5-mm-thick
slices and fixed in 4% paraformaldehyde for 24 h and processed for paraffin embedding. Sections were stained with hematoxylin and eosin (H and E).
Transmission electron microscopy analysis. Liver was removed,
fixed with 2.5% glutaraldehyde in cacodylate buffer (pH 7.4, 0.2M), and postfixed for 1 h with 1% OsO4in the same buffer. The samples
were processed with standard procedures for embedding in Araldite (Sigma) and polymerized at 60°C for 72 h. Thick sections (~1m) were stained with Epoxy Tissue Stain (no. 14950; Electron Micros-copy Sciences, Hatfield, PA). Ultrathin sections (70 nm) were stained with a saturated aqueous solution of uranyl acetate and lead citrate and examined with a Philips CM10 electron microscope (Royal Philips Electronics, Amsterdam, the Netherlands) at 80 kV. On thin sections, ultrastructural data on mitochondria from perivenous central area were collected from 18 randomly selected areas from each sample at a final enlargement of⫻5,000 using electron microscope film (Kodak electron film 4489, 6.5 ⫻ 9.0 cm; Rochester, NY). Five different section levels of each sample were examined. The total area examined was ~140,000.00m2in each group. We have previously shown that
cytochrome c oxidase and peroxisome staining were markedly re-duced, whereas markers of endoplasmic reticulum stress and inflam-mation were markedly increased mainly in the perivenous central hepatocytes of the EtOH-consuming rats (20). For this reason, we have focused the present analysis on the perivenous central hepato-cytes. All measurements were obtained using standard morphometric techniques, as previously described (20, 77). Cytoplasmic (Acyt) and mitochondrial (Amit) area, the Amit to Acyt ratio (Amit/Acyt), and the number of mitochondria over 100m2of cytoplasm (i.e., the
mito-chondrial density; Nmit/100m2) were measured.
Cell culture and treatment. Human HCC HepG2 cells were
pur-chased from the American Type Culture Collection (HB-8065; ATCC, Manassas, VA). Cells were routinely cultured in RPMI-1640 medium, supplemented with 10% fetal bovine serum, penicillin (100 U/ml), and streptomycin (100g/ml), in an atmosphere with 5% CO2
at 37°C. Two million HepG2 cells were seeded per 75-cm2 flask
(Corning, Corning, NY). Six hours after seeding, 75 mM (0.34%) EtOH and 1% BCAAem (or CAA mixture) were added, alone or in combination. Untreated cells were plated as controls. Every 24 h, media were replaced in both control and treatment flasks, with fresh media, with or without EtOH and BCAAem, respectively. Four days after seeding, cells were trypsinized and seeded into new flasks, at 2,000,000 viable cells per flask, with daily media changes, as de-scribed before (64). Five days after the split process (a total of 9 days with or without EtOH, BCAAem, CAA mixture, or EtOH plus BCAAem or CAA mixture), the cells were harvested for the different assays.
Moreover, HepG2 cells were seeded in six-well plates and treated each day with 100 nM rapamycin, a macrolide compound that inhibits mTOR signaling, or with 5M 1H-[1,2,4]oxadiazolo[4,3-a]quinoxa-lin-1-one (ODQ), the soluble guanylyl cyclase inhibitor, 1 h before BCAAem (1%) addition and 6 h before 100 mM EtOH treatment (48 h) (28). Vehicle-treated cells were exposed to 0.02% dimethyl sul-foxide (DMSO) for 48 h. Furthermore, eNOS knockdown was ob-tained with transient transfection of small-interference RNA (siRNA). HepG2 cells were seeded in six-well plates and transfected with 100 nmol/l eNOS siRNA SMARTpool (Dharmacon, Lafayette, CO) or siCONTROL nontargeting siRNA using Dharmafect transfection re-agent. After 48-h transfection, the cells were then treated with 1% BCAAem and 100 mM EtOH for 48 h. Efficacy of transfection was determined using siGLO-RISC-free nontargeting siRNA and estima-tion of siRNA uptake by fluorescence detecestima-tion (absorbance/emission 557/570). Proteins were extracted for Western blotting analysis.
Oil Red O staining. HepG2 cells were washed twice with DPBS
and fixed with 10% formalin for 1 h. They were then stained with 0.3% Oil Red O in 60% isopropanol for 2 h at room temperature. The cells were subsequently washed three times with distilled water. Fat droplets were dissolved with 100% propanol and quantified by mea-suring the optical absorbance at a wavelength of 510 nm, using a Bio-Rad Model 680 microplate reader (Segrate, Italy) (66).
Quantitative RT-PCR analysis. Quantitative RT-PCR reactions
were performed as described (73) and run with the iQ SybrGreenI SuperMix (Bio-Rad) on an iCycler iQ Real-Time PCR detection system (Bio-Rad). Briefly, RNA was isolated from tissue using the
Table 2. Ion transitions, instrument settings, and weighted
regression for amino acid detection
Precursor (m/z) Product (m/z) DP CE Weighted Regression
Mix 1 Serine 106,051 60,044 30 15 1/x Asparagine 133,061 74,024 30 15 1/x2 Tyrosine 182,082 165,053 30 15 1/x2 Threonine 120,066 56,049 30 15 1/x Mix 2 Glycine 76,040 30,033 40 15 1/x Alanine 90,056 44,053 40 15 1/x Leucine 132,103 86,096 40 15 1/x Isoleucine 132,103 69,072 40 15 1/x Valine 118,087 72,081 40 15 1/x2 Proline 116,071 70,065 40 15 1/x Histidine 156,077 109,830 40 15 1/x Methionine 150,059 104,053 40 15 1/x Aspartic acid 134,045 74,023 40 15 1/x Glutamine 147,077 84,015 40 15 1/x Phenylalanine 166,087 119,964 40 15 1/x Mix 3 Glutamic acid 148,061 102,056 80 18 1/x2 Lysine 147,113 84,093 80 18 1/x Arginine 17,512 116,072 80 18 1/x Tryptophan 205,098 18,807 80 18 1/x Table reports the mass spectrometry parameters as determined by infusion of each amino acid. In each standard mixture, name, precursor (m/z), product (m/z), declustering potential (DP) (V), collision energy (CE) (V), and weighted regression are indicated for each amino acid.
AJP-Gastrointest Liver Physiol•doi:10.1152/ajpgi.00231.2017•www.ajpgi.org
T2
AQ: 8
RNeasy Tissue Mini Kit (Qiagen, Milan, Italy). cDNA was synthe-sized using iScript cDNA Synthesis Kit (Bio-Rad). Primers were designed using Beacon Designer 2.6 software from Premier Biosoft International (see Tables 3 and 4). The cycle number at which the various transcripts were detectable (threshold cycle, CT) was com-pared with that of TATA-box-binding protein, referred to as ⌬CT. The gene-relative levels were expressed as 2-(⌬⌬CT), in which⌬⌬CT equals ⌬CT of EtOH-, BCAAem-, or CAA mixture-treated rat (or treated HepG2 cells) minus ⌬CT of the control rat (or untreated HepG2 cells).
Western blot analysis. Protein extracts were obtained from liver
with T-PER Mammalian Protein Extraction Reagent (Pierce, Thermo-Scientific, Rockford, IL) as described by the manufacturer, in the presence of protease and phosphatase inhibitor cocktail (Sigma). Protein content was measured by the bicinchoninic acid protein assay (BCA; Pierce, Euroclone, Milan, Italy), and 50g of proteins was run on SDS-PAGE under reducing conditions. The separated proteins were then electrophoretically transferred to a nitrocellulose membrane (Bio-Rad). Proteins of interest were revealed with specific antibodies: anti-cytochrome c (Cyt c) oxidase subunit IV (COX IV), anti-Cyt c (cytochrome complex), p-eNOS (Ser1177-phospho-eNOS), anti-acetyl p53, anti-p-Akt (Ser473-phospho-Akt), anti-Akt, anti-p-p70 S6 kinase (Thr389-phospho-p70S6 kinase), p70 S6 kinase, anti-Sirt1, anti--actin (all from Cell Signaling, Euroclone, Milan, Italy), anti-eNOS (Santa Cruz Biotechnology, Santa Cruz, CA), anti-p53 (from GeneSpin, Milan, Italy), anti- superoxide dismutase 1 [Cu-Zn] (SOD1; from Santa Cruz Biotechnology), anti-catalase (from Santa Cruz Biotechnology), at 1:1,000 dilution each.
The immunostaining was detected using horseradish peroxidase-conjugated anti-rabbit or anti-mouse immunoglobulin for 1 h at room temperature. After the visualization of p-eNOS, acetyl p53, p-Akt, and
p-p70 S6 kinase, filters were stripped with the Restore Western Blot Stripping Buffer (Euroclone) and further used for the visualization of total eNOS, total p53, total Akt, or total p70 S6 kinase. The amount of protein was measured using SuperSignal Substrate (Pierce, Euro-clone) and quantified by densitometry with ImageJ (NIH, Bethesda, MD) software image analyzer.
Mitochondrial DNA measurement. For mtDNA analysis, total
DNA was extracted with QIAamp DNA extraction kit (Qiagen). The content of mtDNA was calculated using real-time quantitative PCR by measuring the threshold cycle ratio (⌬CT) of a mitochondrial-encoded gene NADH dehydrogenase subunit 1 (ND1) vs. a nuclear-encoded gene (-globin) in the liver of EtOH-, BCAAem-, or CAA mixture-treated and control (Ctrl) rats, as described (27).
Citrate synthase activity measurement. The citrate synthase activity
was measured spectrophotometrically at 412 nm at 30°C in liver tissue extracts (51). Liver samples were added to a buffer containing 0.10 mM 5,5-dithio-bis-(2-nitrobenzoic) acid, 0.50 mM oxaloacetate, 50.00 M EDTA, 0.31 mM acetyl CoA, 5.00 mM triethanolamine hydrochloride, and 0.10 M Tris·HCl, pH 8.1. Citrate synthase activity was expressed as nanomoles of citrate produced per minute per milligram of protein. The data were normalized to total protein content, determined as reported above.
NAD⫹and NADH measurement. NAD⫹and NADH levels were measured by enzymatic NADH recycling assay, using the NAD⫹/ NADH Quantification Kit from Biovision (Vinci-Biochem, Florence, Italy), according to the manufacturer’s recommendations. Liver sam-ples were homogenized in 400l of NAD⫹/NADH extraction buffer and filtered using Microcon YM-10 (GE Healthcare, Euroclone, Milan, Italy). The samples were then split into two sets, one of which was used to carry out the thermal decomposition of NAD⫹, followed by the cycling assay for the determination of NADH content. The other set was used to measure the total NADH plus NAD⫹content, by performing the cycling assay without the thermal decomposition. The NAD⫹/NADH ratio was then calculated. The data were normalized by total protein content (see above).
Mitochondrial oxidative stress. To measure the oxidative damage
of DNA, the highly sensitive 8-hydroxy-2’-deoxyguanosine
(8-Table 3. Rat primers for quantitative RT-PCR
Gene Primer Sequences
PCR Product, bp Ta, °C Tfam Sense 5=-CAGAGTTGTCATTGGGATTGGG-3= 140 60 Antisense 5=-GCATTCAGTGGGCAGAAGTC-3= NRF1 Sense 5=-TATCCGAAAGAGACAGCAGACAC-3= 130 60 Antisense 5=-CTTAAAGACAGGGTTGGGTTTGG-3= PGC1␣ Sense 5=-CCACTACAGACACCGCACACATC-3= 141 60 Antisense 5=-TCTCTGCGGTATTCGTCCCTCTT-3= eNOS Sense 5=-CACAGGCATCACCAGGAAGAAG-3= 98 60 Antisense 5=-CCTTCACACGCTTCGCCATC-3= TBP Sense 5=-GCAGCCTCAGTACAGCAATC-3= 167 60 Antisense 5=-TGGTGTGGCAGGAGTGATAG-3= ND1 Sense 5=-GGACCTAAGCCCAATAACGA-3= 348 58 Antisense 5=-GCTTCATTGGCTACACCTTG-3= GPX1 Sense 5=-CAGGAGAATGGCAAGAATGAAGAG-3= 145 60 Antisense 5=-ACTGGGTGCTGGCAAGGC-3= Catalase Sense 5=-CATCGGCACATGAATGGC-3= 281 60 Antisense 5=-ACCTTGGTCAGGTCAAATGG-3= SOD1 Sense 5=-TGAAGAGAGGCATGTTGGAG-3= 164 58 Antisense 5=-CCACCTTTGCCCAAGTCATC-3= -Globin Sense 5=-CTTCTGGCTATGTTTCCCTT-3= 237 58 Antisense 5=-GTTCTCAGGATCCACATG-3= Ta, temperature of annealing.
Table 4. Human primers for quantitative RT-PCR
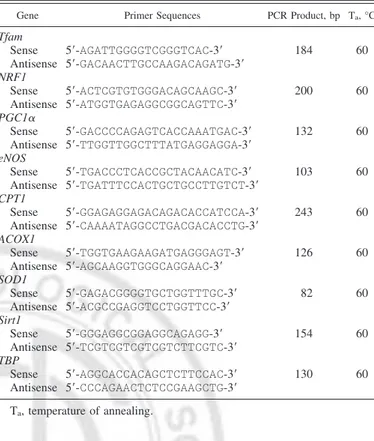
Gene Primer Sequences PCR Product, bp Ta, °C
Tfam Sense 5=-AGATTGGGGTCGGGTCAC-3= 184 60 Antisense 5=-GACAACTTGCCAAGACAGATG-3= NRF1 Sense 5=-ACTCGTGTGGGACAGCAAGC-3= 200 60 Antisense 5=-ATGGTGAGAGGCGGCAGTTC-3= PGC1␣ Sense 5=-GACCCCAGAGTCACCAAATGAC-3= 132 60 Antisense 5=-TTGGTTGGCTTTATGAGGAGGA-3= eNOS Sense 5=-TGACCCTCACCGCTACAACATC-3= 103 60 Antisense 5=-TGATTTCCACTGCTGCCTTGTCT-3= CPT1 Sense 5=-GGAGAGGAGACAGACACCATCCA-3= 243 60 Antisense 5=-CAAAATAGGCCTGACGACACCTG-3= ACOX1 Sense 5=-TGGTGAAGAAGATGAGGGAGT-3= 126 60 Antisense 5=-AGCAAGGTGGGCAGGAAC-3= SOD1 Sense 5=-GAGACGGGGTGCTGGTTTGC-3= 82 60 Antisense 5=-ACGCCGAGGTCCTGGTTCC-3= Sirt1 Sense 5=-GGGAGGCGGAGGCAGAGG-3= 154 60 Antisense 5=-TCGTCGTCGTCGTCTTCGTC-3= TBP Sense 5=-AGGCACCACAGCTCTTCCAC-3= 130 60 Antisense 5=-CCCAGAACTCTCCGAAGCTG-3= Ta, temperature of annealing.
AJP-Gastrointest Liver Physiol•doi:10.1152/ajpgi.00231.2017•www.ajpgi.org
T3,T4
AQ: 9 OK
OHdG) Check ELISA Kit (JaICA, Hamamatsu, Japan) was used (24). Measurements were carried out in accordance with the manufacturer’s protocol. Total DNA was extracted using QIampDNAMini Kit (Qia-gen) and digested with nuclease P1 and alkaline phosphatase (Sigma). Quality and quantity of DNA were confirmed by a NanoDrop ND-1000 spectrophotometry analysis. Absorbance of the ELISA reaction product was determined spectrophotometrically using 450 nm as the primary wave.
Statistical analysis and data presentation. Statistical analysis was
performed with a one-way ANOVA followed by Student-Newman-Keul’s test, or Student’s t-test. Data were presented as the means⫾ SD, unless otherwise specified. A statistically significant difference was accepted at P⬍ 0.05.
RESULTS
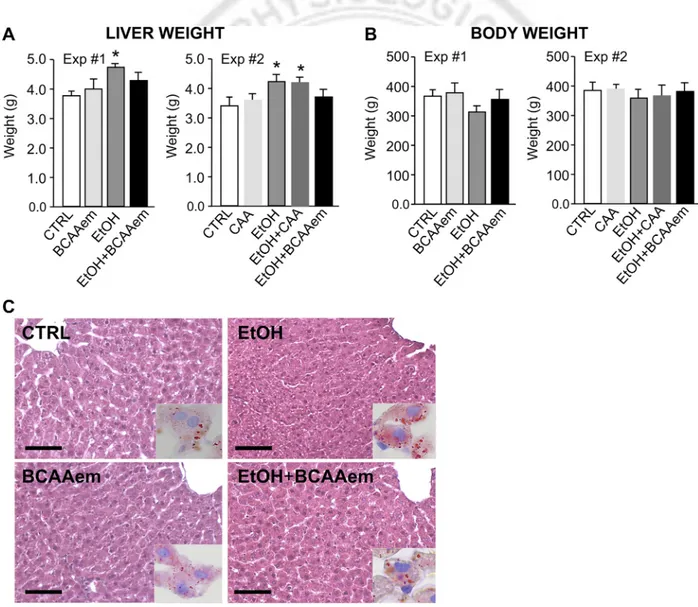
BCAAem prevents liver steatosis in rats. Exposure of male
Wistar rats to the Lieber-DeCarli liquid diet containing 6.2% EtOH for 8 wk resulted in a significant increase of the liver weight, together with fat accumulation, compared with the
pair-fed controls as previously reported (Fig. 1, A and C) (6, 61). However, experiment 1 demonstrated that dietary supple-mentation with BCAAem, although unable to change liver weight per se, prevented both liver growth and fat accumula-tion attributable to alcohol diet, confirming our previous results (Fig. 1, A and C) (21). Conversely, experiment 2 showed that CAA diet, i.e. the Lieber-DeCarli liquid diet containing puri-fied amino acid mixture based on the amino acid profile of casein, was unable to prevent the EtOH-dependent liver growth (Fig. 1A). Moreover, the EtOH-fed rats gained less body weight than pair-fed animals yet not in a statistically different manner (Fig. 1B), whereas the body weight of the EtOH-consuming rats treated with BCAAem, unlike with CAA diet, was comparable to that of pair-fed rats (Fig. 1B). BCAAem and CAA diet were ineffective on body weight when supplemented alone (Fig. 1B). No statistically signif-icant difference was evident in food intake among the groups (data not shown) (21).
Fig. 1. Branched-chain amino acid-enriched mixture (BCAAem) supplementation normalizes liver and body weight of ethanol (EtOH)-consuming rats. Liver (A) and body weight (B) of pair-fed rats (pair-fed Ctrl, n⫽ 6), consuming a control liquid diet in which EtOH was replaced by isocaloric maltose dextran, and rats fed with a Lieber-DeCarli liquid diet containing EtOH or BCAAem/casein-amino acid-enriched mixture (CAAem) or EtOH plus BCAAem/CAAem (n⫽ 6–7) are shown. Data in A and B represent means⫾ SD (*P ⬍ 0.05 vs. Ctrl rats). C: hematoxylin and eosin liver staining of Ctrl, BCAAem-, EtOH-, and EtOH plus BCAAem-fed rats. Scale bar ⫽ 100 m. Analyses were performed in 2 animals per group. Representative staining images from at least 3 independent experiments are reported.
AJP-Gastrointest Liver Physiol•doi:10.1152/ajpgi.00231.2017•www.ajpgi.org
C
O
L
O
R
F1Free amino acid levels were next measured in liver tissue. As reported in Table 5, arginine, leucine, and tryptophan concentrations were reduced by EtOH consumption. Although ineffective when supplemented alone, BCAAem prevented reduction of these three amino acids. Also, isoleucine, serine, tyrosine, and valine concentrations were lower in liver of mice exposed to EtOH-containing diet, yet BCAAem supplementa-tion was unable to prevent their decline. Concentrasupplementa-tions of the remaining amino acids were not statistically different among the groups. Notably, although hepatocytes of the EtOH-con-suming rats accumulated many lipid droplets, fat accumulation was prevented by the BCAAem supplement (Fig. 1C). This result prompted us to hypothesize that the specific BCAAem amino acid supplementation could improve the EtOH-induced mitochondrial dysfunction in hepatocytes.
BCAAem prevents mitochondrial damage in rat hepatocytes.
To this end, electron microscopy analysis was performed on
livers from the diverse groups. Mitochondrial number was significantly reduced in hepatocytes of the EtOH-consuming group relative to pair-fed control rats (Fig. 2 and Table 6). On the other hand, the mitochondrial mean area was higher, whereas the Amit/Acyt ratio was lower in the EtOH-consuming group compared with the pair-fed group (Fig. 2 and Table 6). Moreover, smooth endoplasmic reticulum tubules were dilated, and the rough endoplasmic reticulum was disorganized in hepatocytes of alcohol-consuming animals (Fig. 2). BCAAem supplementation of EtOH-fed rats markedly increased mito-chondria number, in addition to the mean area and Amit/Acyt ratio (Fig. 2 and Table 6). In animals fed on EtOH plus BCAAem, smooth and rough endoplasmic reticulum also ap-peared of normal size and well organized, comparable to those found in hepatocytes of pair-fed rats, with abundant glycogen deposits and no macroautophagic vacuoles (data not shown). BCAAem supplementation alone was unable to change both Table 5. Amino acid concentrations measured using chromatography in liver
Ctrl BCAAem EtOH EtOH⫹ BCAAem
Alanine 670.1⫾ 65.7 832.0⫾ 25.0 691.2⫾ 128.0 679.0⫾ 110.0 Arginine 6.6⫾ 0.7 4.3⫾ 0.8 2.46⫾ 0.5* 4.3⫾ 0.7# Asparagine 8.9⫾ 2.4 7.9⫾ 2.7 8.1⫾ 2.1 6.9⫾ 2.8 Glycine 409.8⫾ 78.2 479.8⫾ 32.0 424.1⫾ 52.0 440.7⫾ 67.2 Glutamic acid 5232.0⫾ 430.0 5394.0⫾ 438.0 5970.5⫾ 832.0 4717.7⫾ 850.0 Histidine 527.9·103⫾ 80.3·103 606.8·103⫾ 10.8·103 461.1·103⫾ 44.6·103 406.0·103⫾ 19.3·103 Isoleucine 141.9⫾ 29.7 144.4⫾ 4.5 92.9⫾ 16.6* 93.2⫾ 17.9* Leucine 195.0⫾ 56.4 189.1⫾ 81.9 110.2⫾ 18.8* 188.9⫾ 92.4# Lysine 72.2⫾ 16.8 90.5⫾ 19.7 62.3⫾ 9.6 53.3⫾ 6.4 Methionine 12.9⫾ 5.5 17.9⫾ 5.3 11.9⫾ 3.9 17.8⫾ 4.7 Phenylalanine 32.0⫾ 13.2 36.4⫾ 4.8 27.7⫾ 10.2 28.8⫾ 5.2 Proline 33.7⫾ 5.2 33.5⫾ 1.3 27.2⫾ 8.7 24.6⫾ 4.2 Serine 348.7⫾ 33.9 362.4⫾ 9.9 220.7⫾ 58.4* 215.4⫾ 43.0* Threonine 55.50⫾ 2.41 52.20⫾ 2.00 52.90⫾ 2.50 51.50⫾ 2.20 Tryptophan 1252.8·103⫾ 226.4·103 1350.4·103⫾ 74.54·103 787.1·103⫾ 112.7·103* 1038.2·103⫾ 169.9·103# Tyrosine 514.50⫾ 63.30 382.60⫾ 19.70 311.70⫾ 71.89* 274.60⫾ 39.70* Valine 429.9⫾ 46.7 455.3⫾ 17.7 291.9⫾ 61.1 290.8⫾ 48.9 Values are means⫾ SD (pmol/mg of tissue), n ⫽ 4 animals/group. EtOH, ethanol; BCAAem, branched-chain amino acid-enriched mixture. *P ⬍ 0.05 shows difference vs. Ctrl group; #P⬍ 0.05 shows difference vs. EtOH group.
Fig. 2. Electron microscopy analysis shows that branched-chain amino acid-enriched mixture (BCAAem) supplementation ameliorated the liver mitochondrial damage induced by alcohol. The ethanol (EtOH)-consuming rats had fewer mitochondria than pair-fed animals, whereas the BCAAem supplementation renormalized their density. N, nucleus; scale bar ⫽ 0.1 m (magnification⫻5,200). Analyses were performed in 2 animals per group. Representative images from at least 3 independent experiments are reported.
AJP-Gastrointest Liver Physiol•doi:10.1152/ajpgi.00231.2017•www.ajpgi.org
T5
number and mean area of mitochondria (Fig. 2 and Table 6). These results were consistent with a healthy effect of amino acids, suggesting that BCAAem could prevent the EtOH-induced mitochondrial damage by promoting mitochondrial biogenesis in hepatocytes.
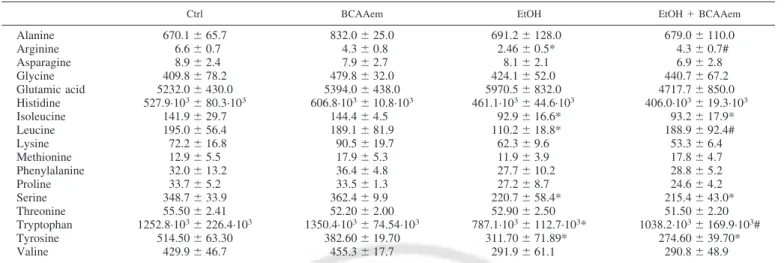
BCAAem restores hepatic mitochondrial biogenesis and function impaired by EtOH consumption. Thus we evaluated
the capacity of BCAAem supplementation to ameliorate im-paired mitochondrial biogenesis and function attributable to the EtOH consumption. As expected, the hepatic mRNA levels of PGC-1␣, nuclear respiratory factor-1 (NRF-1), and mitochon-drial DNA transcription factor A (Tfam) were all lowered by EtOH consumption compared with pair-fed control animals. However, these markers were renormalized in livers of rats in which BCAAem was supplemented together with EtOH (Fig. 3A). BCAAem was ineffective when supplemented alone. Moreover, in line with electron microscopy results, EtOH reduced mtDNA amount by 35.0⫾ 1.5% compared with pair-fed rats, whereas its consumption with BCAAem increased mtDNA amount by 55.0⫾ 2.6% and 138.0 ⫾ 4.0% compared with pair-fed and EtOH group, respectively (Fig. 3B). In accord with liver weight results (Fig. 1A), CAA diet was unable to affect mtDNA amount either when supplemented with EtOH or alone (Fig. 3B). Although protein levels of both COX IV and Cyt c, as well as citrate synthase activity, were reduced in liver of EtOH-consuming rats compared with pair-fed control animals, they were all renormalized in liver of rats exposed to alcoholic diet supplemented with BCAAem (Fig. 3,
C and D). Again, BCAAem supplementation alone did not
induce any change in mtDNA, mitochondrial protein levels, and citrate synthase activity. Collectively these findings sug-gest that BCAAem supplementation, by promoting mitochon-drial biogenesis and function, opposes the hepatic liver mito-chondrial damage induced by EtOH consumption.
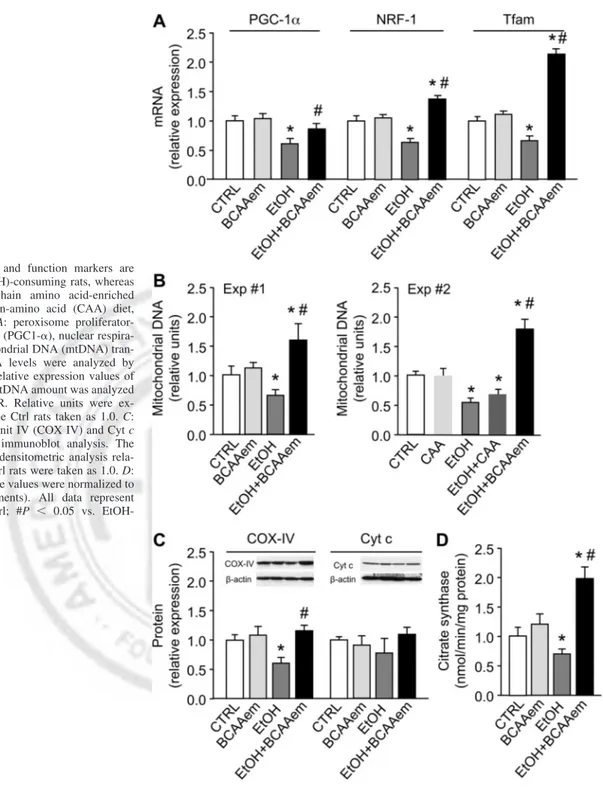
Because eNOS-dependent NO production was found to promote mitochondrial biogenesis in different cells, including hepatocytes (30, 57), we analyzed eNOS mRNA and protein levels in livers of both pair-fed controls and EtOH-consuming rats, supplemented with or without BCAAem. A reduction by 38.0⫾ 2.1% of eNOS mRNA level was evident in the EtOH group compared with the pair-fed group, whereas the BCAAem supplementation counteracted the effect of EtOH, without an effect per se (Fig. 4A). Although EtOH did not decrease eNOS protein level compared with pair-fed control animals, the BCAAem-supplemented alcohol-consuming ani-mals showed instead a relevant increase of eNOS protein levels (Fig. 4A). Furthermore, differently from mRNA data, BCAAem supplementation alone induced a significant increase of eNOS protein. Thus these results support the hypothesis that
eNOS may contribute to the recovery induced by the amino acid mixture of the EtOH-impaired mitochondrial biogenesis. Given that Sirt1 expression was found to be increased by the eNOS-dependent NO (57), and Sirt1 in turn deacetylates and activates eNOS and PGC-1␣ (55), we investigated this cross talk in our model. Although we confirmed that EtOH consump-tion reduced Sirt1 mRNA levels in liver as previously reported (81, 82), no changes of Sirt1 protein levels were evident (Fig. 4B). Similarly, BCAAem supplementation renormalized Sirt1 mRNA without effect on Sirt1 protein level of EtOH-consum-ing rats (Fig. 4B).
Although it is not uncommon for mRNA and protein mea-surements to not be fully concordant (50), we further investi-gated this point. Because Sirt1 deacetylase activity is NAD⫹ dependent (35), and the NAD⫹/NADH ratio is usually de-creased in EtOH-consuming animals (31, 34, 78), the effect of BCAAem supplementation on NAD⫹/NADH levels was stud-ied. As shown in Fig. 4C, livers of the EtOH-consuming rats displayed an ⬃50% reduction in NAD⫹/NADH ratio, which was, however, restored by the BCAAem, unlike CAA (data not shown), supplementation. In line with this, the acetylated form of p53, a well-known target of Sirt1 (52), was higher in liver of the EtOH-consuming than control rats, indicating that the deacetylation activity of Sirt1 was reduced in EtOH group (Fig. 4D). Conversely, acetyl-p53 was decreased by 70% in liver of rats supplemented with BCAAem, alone or with EtOH, con-firming that the amino acid formula was able to activate Sirt1 (Fig. 4D). CAA diet was ineffective on Sirt1 activity in all groups (data not shown). Furthermore, the drop in hepatic Sirt1 activity in EtOH-treated animals occurred in the presence of low eNOS mRNA levels (Fig. 4A), and this, therefore, strengthens the hypothesis of a cross talk between Sirt1 and eNOS.
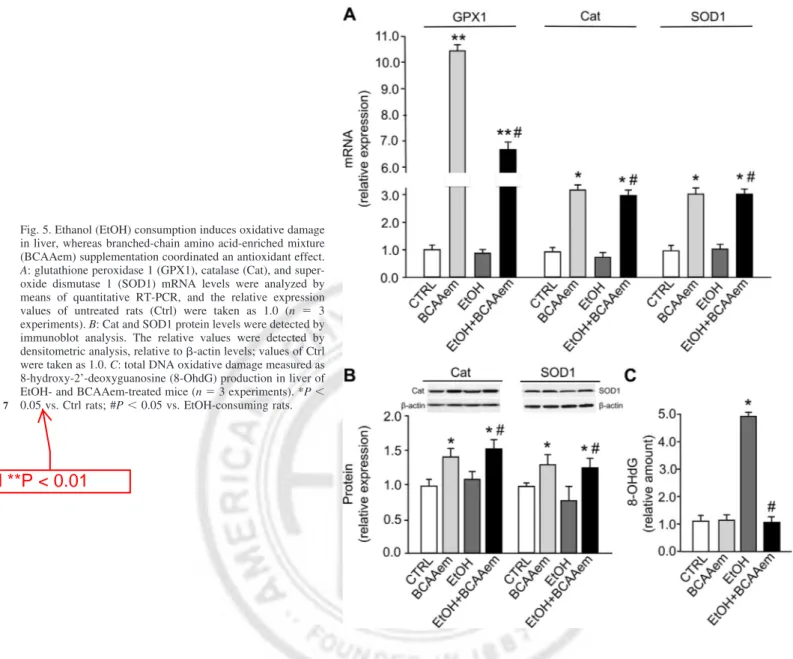
BCAAem protects from the oxidative damage induced by EtOH. Alcohol metabolism generates ROS, thus leading to
oxidative stress in hepatocytes (4), which is associated with a well-documented impairment of antioxidant defense system. To verify whether the protection by BCAAem supplementation against EtOH-induced liver damage also involves antioxidant effects, we investigated the expression of the anti-ROS en-zymes in liver of EtOH-consuming rats, supplemented or not with the amino acid formula. As expected, glutathione perox-idase 1 (GPX1), Cat, and SOD [Cu-Zn], also known as SOD1 mRNA levels were reduced in EtOH group compared with the pair-fed group (Fig. 5A). However, BCAAem supplementation increased them by 10-fold (GPX1) and 3-fold (Cat and SOD1), respectively (Fig. 5A). In addition, the SOD1 protein levels were reduced, although without a statistical significance, in liver of EtOH rats, whereas the BCAAem supplementation Table 6. Mitochondrial morphometric analysis in liver tissue
Nmit/100m2 Amit Amit/Acyt
Ctrl 0.82⫾ 0.14 12.32⫾ 1.75 0.11⫾ 0.02 BCAAem 0.88⫾ 0.17 13.48⫾ 1.86 0.13⫾ 0.03 EtOH 0.52⫾ 0.13* 16.89⫾ 4.10* 0.08⫾ 0.01* EtOH⫹ BCAAem 0.71⫾ 0.11 26.12⫾ 4.40*† 0.16⫾ 0.03 ANOVA F⫽ 8.70; P ⫽ 0.0001 F⫽ 65.95; P ⫽ 0.0001 F⫽ 13.85; P ⫽ 0.0001
Values are means⫾ SD. Mitochondrial density (Nmit/100m2), mitochondrial area (Amit), and mitochondrial to cytoplasmic area (Amit/Acyt) ratio measured
in liver tissue of the various experimental groups are shown. BCAAem, branched-chain amino acid-enriched mixture; EtOH, ethanol. *P⬍ 0.05 vs. Ctrl; †P⬍ 0.05 vs. EtOH-fed animals.
AJP-Gastrointest Liver Physiol•doi:10.1152/ajpgi.00231.2017•www.ajpgi.org
F3
F4
markedly raised Cat and SOD1 (Fig. 5B). These findings suggested that ROS production was reduced after amino acid supplementation as previously seen in skeletal muscle of middle-aged mice exposed to BCAAem (23). Accord-ingly, although the amount of 8-OHdG, a marker of oxida-tive DNA damage, was dramatically increased in liver of EtOH-fed rats, this effect was totally reverted by consump-tion of BCAAem, which was ineffective when administered alone (Fig. 5C).
BCAAem improves mitochondrial function and ROS defense system in EtOH-exposed HepG2 cells. To investigate more
deeply the molecular mechanisms involved in the effects of
BCAAem, we extended our findings by using an in vitro model of hepatic EtOH toxicity. To this end, hepatic HepG2 cells were treated with EtOH, with or without either BCAAem or CAA mixture. We first analyzed the mitochondrial biogenesis markers to confirm the effects of alcohol and amino acids observed in vivo. PGC-1␣ and Tfam mRNA levels were unchanged or slightly lower in HepG2 cells exposed to 75 mM EtOH for 9 days than in untreated control cells (Fig. 6A). However, in line with in vivo results, 1% BCAAem, unlike CAA mixture, supplementation for 9 days increased PGC-1␣ and Tfam mRNA levels with respect to both untreated and EtOH-treated cells (Fig. 6, A and B).
Fig. 3. Mitochondrial biogenesis and function markers are decreased in liver of ethanol (EtOH)-consuming rats, whereas supplementation with branched-chain amino acid-enriched mixture (BCAAem), unlike casein-amino acid (CAA) diet, restores them to control levels. A: peroxisome proliferator-activated receptor-␥ coactivator 1␣ (PGC1-␣), nuclear respira-tory factor-1 (NRF-1), and mitochondrial DNA (mtDNA) tran-scription factor A (Tfam) mRNA levels were analyzed by means of quantitative RT-PCR. Relative expression values of the Ctrl rats were taken as 1.0. B: mtDNA amount was analyzed by means of quantitative RT-PCR. Relative units were ex-pressed compared with those of the Ctrl rats taken as 1.0. C: cytochrome c (Cyt c) oxidase subunit IV (COX IV) and Cyt c protein levels were detected by immunoblot analysis. The relative values were measured by densitometric analysis rela-tive to-actin levels. Values in Ctrl rats were taken as 1.0. D: citrate synthase activity of liver. The values were normalized to protein content (n ⫽ 5 experiments). All data represent means⫾ SD, *P ⬍ 0.05 vs. Ctrl; #P ⬍ 0.05 vs. EtOH-consuming rats.
AJP-Gastrointest Liver Physiol•doi:10.1152/ajpgi.00231.2017•www.ajpgi.org
Sirt1 mRNA was also increased in HepG2 treated with BCAAem, but not with CAA mixture, alone or in combination with EtOH (Fig. 6, C and D). No significant differences were found in Sirt1 protein levels after both EtOH and BCAAem, as already observed in liver tissue (Fig. 6C). Acetyl-p53 levels were not significantly different in EtOH-treated compared with untreated HepG2 cells (data not shown). Accordingly, the NAD⫹/NADH ratio was reduced by only 10% in alcohol-treated compared with unalcohol-treated cells (Fig. 6E). BCAAem treatment, however, markedly increased the NAD⫹/NADH ratio in both EtOH-treated and untreated cells (Fig. 6E). In line with this, BCAAem also lowered acetyl-p53 levels, confirming that the amino acid mixture was able to activate Sirt1 (data not shown).
We then investigated the effect of BCAAem treatment on ROS defense system in cultured cells. SOD1 mRNA and protein levels were reduced by⬃10% and 30%, respectively, in HepG2 exposed to EtOH compared with untreated cells (Fig. 6F). However, when HepG2 cells were supplemented with EtOH together with BCAAem, but not CAA mixture, SOD1 mRNA and protein levels returned to levels similar to those seen in the untreated cells, whereas both their protein and mRNA levels increased by ⬃30% compared with untreated cells when HepG2 cells were treated with BCAAem alone (Fig. 6F and data not shown). These in vitro findings, as well as in vivo results, suggest that the specific BCAAem formula is able to counteract the toxic effects of EtOH on mitochondrial function and to reduce the EtOH-induced oxidative stress by
specifically acting on hepatic tissue and in a cell-autonomous manner.
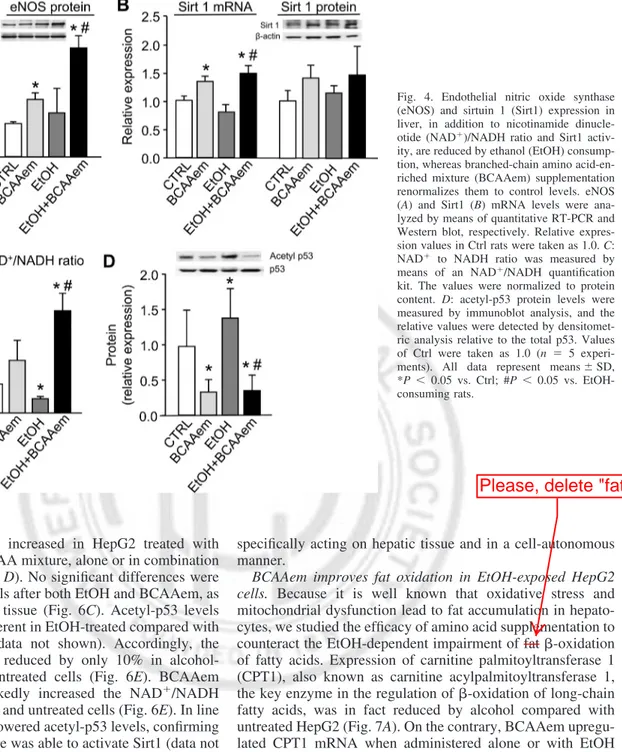
BCAAem improves fat oxidation in EtOH-exposed HepG2 cells. Because it is well known that oxidative stress and
mitochondrial dysfunction lead to fat accumulation in hepato-cytes, we studied the efficacy of amino acid supplementation to counteract the EtOH-dependent impairment of fat-oxidation of fatty acids. Expression of carnitine palmitoyltransferase 1 (CPT1), also known as carnitine acylpalmitoyltransferase 1, the key enzyme in the regulation of-oxidation of long-chain fatty acids, was in fact reduced by alcohol compared with untreated HepG2 (Fig. 7A). On the contrary, BCAAem upregu-lated CPT1 mRNA when administered alone or with EtOH (Fig. 7A).
Moreover, to assess the possible effect of BCAAem supple-mentation on the EtOH-induced excessive fat storage, the intracellular lipid accumulation was analyzed by Oil Red O staining in HepG2 cells treated with 100 nM EtOH and 1% BCAAem. Following 48-h treatment, the lipid content was significantly increased when HepG2 cells were exposed to EtOH, whereas it was reduced when the cells were exposed to BCAAem compared with untreated cells (Fig. 7B). In addition, BCAAem supplementation was able to renormalize the lipid content in the EtOH-treated HepG2 cells (Fig. 7B).
EtOH and BCAAem control multiple signaling pathways in HepG2 cells. Given that BCAAem was found to promote
eNOS-dependent NO production, and NO is also known to control -oxidation in muscle (23, 44), we analyzed the
ex-Fig. 4. Endothelial nitric oxide synthase (eNOS) and sirtuin 1 (Sirt1) expression in liver, in addition to nicotinamide dinucle-otide (NAD⫹)/NADH ratio and Sirt1 activ-ity, are reduced by ethanol (EtOH) consump-tion, whereas branched-chain amino acid-en-riched mixture (BCAAem) supplementation renormalizes them to control levels. eNOS (A) and Sirt1 (B) mRNA levels were ana-lyzed by means of quantitative RT-PCR and Western blot, respectively. Relative expres-sion values in Ctrl rats were taken as 1.0. C: NAD⫹ to NADH ratio was measured by means of an NAD⫹/NADH quantification kit. The values were normalized to protein content. D: acetyl-p53 protein levels were measured by immunoblot analysis, and the relative values were detected by densitomet-ric analysis relative to the total p53. Values of Ctrl were taken as 1.0 (n ⫽ 5 experi-ments). All data represent means⫾ SD, *P ⬍ 0.05 vs. Ctrl; #P ⬍ 0.05 vs. EtOH-consuming rats.
AJP-Gastrointest Liver Physiol•doi:10.1152/ajpgi.00231.2017•www.ajpgi.org
F7
pression of eNOS and its activity in HepG2 treated with EtOH, with or without BCAAem. A slight decrease of eNOS mRNA was observed in cells treated with EtOH. BCAAem, however, increased eNOS mRNA, both supplemented alone or together with EtOH, compared with the untreated cells (Fig. 8A) How-ever, eNOS activity, measured as Ser1177-eNOS phosphory-lation (19), was markedly reduced in EtOH-treated cells (Fig. 8A). Although ineffective on eNOS activity when supple-mented alone, BCAAem completely restored the EtOH-in-duced decrease of eNOS-phosphorylation (Fig. 8B). To further strengthen the role of eNOS on mitochondrial protection by BCAAem supplementation, HepG2 cells were transfected with siRNA against eNOS or nontargeting siRNA as a negative control. We verified that eNOS siRNA reduced eNOS protein levels by 70% (Fig. 8C).
Although HepG2 treated with EtOH showed decreased PGC-1␣ and COXIV protein levels, and BCAAem supplemen-tation promoted a statistically significant recovery of both proteins, eNOS knockdown blocked the BCAAem effects in the presence or not of EtOH (Fig. 8C). Importantly, the eNOS silencing per se did not modify PGC-1␣ and COXIV levels.
Thus our present results suggest that the effects of BCAAem on mitochondrial parameters are at least in part mediated by eNOS in hepatic cells. We had previously demonstrated that the eNOS-derived NO promotes mitochondrial biogenesis in various cell types through guanosine 3=,5=-monophosphate (cGMP) (57). Thus we examined the effect of the selective guanylate cyclase inhibitor ODQ. Coincubation of BCAAem with ODQ (5 M) for 2 days reversed the positive effect of amino acid supplementation on reduction of PGC-1␣ and COX IV protein induced by EtOH, whereas ODQ alone had no effect (Fig. 8D). Thus the eNOS-produced NO through activation of cGMP-dependent signal transduction pathway may promote the healthy effects of BCAAem on mitochondria of hepatic cells.
Protein kinase B, also known as Akt, is a serine/threonine-protein kinase that plays a key role in multiple cellular pro-cesses, such as glucose metabolism, cell cycle, and angiogen-esis, in addition to regulating, among other things, eNOS activity (53). On this basis, we investigated Akt function, measured as phosphorylation in Ser473, in untreated or etha-nol-treated HepG2 cells, with or without BCAAem. We
ob-Fig. 5. Ethanol (EtOH) consumption induces oxidative damage in liver, whereas branched-chain amino acid-enriched mixture (BCAAem) supplementation coordinated an antioxidant effect.
A: glutathione peroxidase 1 (GPX1), catalase (Cat), and
super-oxide dismutase 1 (SOD1) mRNA levels were analyzed by means of quantitative RT-PCR, and the relative expression values of untreated rats (Ctrl) were taken as 1.0 (n ⫽ 3 experiments). B: Cat and SOD1 protein levels were detected by immunoblot analysis. The relative values were detected by densitometric analysis, relative to-actin levels; values of Ctrl were taken as 1.0. C: total DNA oxidative damage measured as 8-hydroxy-2’-deoxyguanosine (8-OhdG) production in liver of EtOH- and BCAAem-treated mice (n⫽ 3 experiments). *P ⬍ 0.05 vs. Ctrl rats; #P⬍ 0.05 vs. EtOH-consuming rats.
AJP-Gastrointest Liver Physiol•doi:10.1152/ajpgi.00231.2017•www.ajpgi.org
F8 AQ: 7
served a marked decrease of p-Akt normalized to total Akt in HepG2 cells treated with EtOH, which was completely re-stored by BCAAem (Fig. 8B). BCAAem increased Akt phos-phorylation also when supplemented alone compared with untreated cells (Fig. 8B).
Because eNOS-dependent NO production is known to reg-ulate mTOR system in different cell types (7, 23, 63, 83), we also investigated the mTOR pathway in our experimental model. Phosphorylation levels of ribosomal protein p70S6 kinase, a major downstream target of mTOR complex 1 (TORC1), was measured in HepG2 cells by immunoblot analysis. We observed a 40% decrease of phospho-p70S6 kinase, normal-ized to total p70S6 kinase, after EtOH exposure compared with untreated cells, which was completely rescued by BCAAem supplementation (Fig. 8, B, D, and E). This effect was antagonized by rapamycin, a macrolide compound that inhibits mTORC1 signaling (Fig. 8E), thus confirming the direct involvement of
mTORC1 in the mechanism of action of BCAAem. Notably, the rescue of defective mitochondrial biogenesis markers by BCAAem was consistently antagonized by rapamycin in HepG2 exposed to EtOH (Fig. 8F). Moreover, ODQ fully antagonized the effects of BCAAem on phospho-p70S6 kinase in hepatic cells treated or not with EtOH (Fig. 8D), supporting the role of NO-dependent cGMP on mTORC1 activity. Thus our results suggest that the healthy effects of BCAAem on mitochondrial function in the EtOH-treated HepG2 cells could be due to a Sirt1-eNOS-Akt-mTORC1 signaling pathway.
DISCUSSION
In this study, we showed that dietary supplementation of BCAAem protected rats against alcoholic fatty liver and mi-tochondrial dysfunction by reversing most of the EtOH-in-duced metabolic impairments. Several studies have
demon-Fig. 6. Mitochondrial biogenesis markers, in addition to sirtuin 1 (Sirt1) expression and nicotinamide dinucleotide (NAD⫹)/NADH
ratio, are decreased in HepG2 cells exposed to ethanol (EtOH), whereas supplementation with branched-chain amino acid-enriched mixture (BCAAem) restores them to control levels. A–D: peroxisome proliferator-acti-vated receptor-␥ coactivator 1␣ (PGC1-␣), mitochondrial DNA transcription factor A (Tfam), and Sirt1 mRNA levels were ana-lyzed by means of quantitative RT-PCR. Relative expression values in the untreated cells were taken as 1.0. Sirt1 protein level was detected by immunoblot analysis (C,
right). The relative values were detected by
densitometric analysis relative to -actin. The untreated cell values were taken as 1.0.
E: NAD⫹/NADH ratio in HepG2 cells was
measured by means of a NAD⫹/NADH quantification kit. The values were normal-ized to protein content. F: superoxide dismu-tase 1 (SOD1) mRNA levels were analyzed in HepG2 cells by means of quantitative RT-PCR. Relative expression values of the untreated cells were taken as 1.0. SOD1 protein level was detected by immunoblot analysis. The relative values were detected by densitometric analysis, relative to-actin levels. Values of untreated cells were taken as 1.0. All data represent means⫾ SD (n ⫽ 5 experiments). *P ⬍ 0.05 vs. untreated cells; #P⬍ 0.05 vs. EtOH-treated cells.
strated that chronic alcohol consumption leads to morpholog-ical and functional changes of mitochondria in different organs, including liver (37), in both animals and humans (62). Mitochondrial enlargement and swelling, with uncommon shapes and giant mitochondria (38, 39), characterized by high matrix density (33, 42, 48), mitochondrial cristae shortening and disorganization, decreased mitochondrial number, or ab-sence of matrix granules and intramitochondrial crystalline inclusions have been described in hepatocytes of alcoholics. Consequently, these changes affect mitochondrial functions, leading to reduced respiratory rates and ATP synthesis (2), in addition to increased ROS production (69). Thus mitochondrial dysfunction contributes largely to initiation and progression of the alcohol-induced liver damage also because the liver deficit in maintaining energy production precedes inadequate adaptive organ-repairing mechanisms (5).
Our findings that dietary BCAAem supplementation was able to prevent the decline in mitochondrial biogenesis markers (i.e., PGC-1␣, NRF-1, and Tfam) and mtDNA, as well as respiratory-chain proteins COX IV and Cyt c and mitochon-drial citrate synthase activity, which occurs in the liver of EtOH-consuming rats, indicate, therefore, that the mitochon-drial-stimulating activity of BCAAem mixture impinges on its protective effect against ALD. Restoring mitochondrial func-tion by BCAAem improves the metabolic derangement caused by EtOH ingestion. Reduced fat accumulation was in fact observed in livers of EtOH-fed rats supplemented with BCAAem. Accordingly, BCAAem was also able to upregulate CPT1 expression, the key enzyme in mitochondrial -oxida-tion of fatty acids, whose expression was decreased in EtOH-fed animals.
Impaired fatty acid oxidation in alcohol-consuming rats, and its recovery by BCAAem supplementation, could therefore underlie the mechanism involved in the EtOH damage and in the protective effect of the amino acid supplement, respec-tively. Although the stimulatory effect of BCAAem supple-mentation on CPT1 expression might be linked to the keto-genic potential of leucine and lysine (59), our experimental
conditions seem to exclude this hypothesis because ketogenesis is strictly linked to a shortage of carbohydrates, whereas HepG2 cells were maintained in 2 g/l glucose culture medium. Moreover, the increased expression of SOD1, GPX1, and Cat observed in BCAAem-fed rats also indicates a protective action of the amino acid supplement against the EtOH-induced oxidative stress (45), which was after all confirmed by the ability of BCAAem to reduce 8-OHdG amount in liver DNA of the alcoholic animals.
Hepatic ethanol metabolism occurs mainly via oxidation by means of ADH and ALDH. Both ADH and ALDH use NAD⫹ as an enzymatic cofactor, which is reduced to NADH. Conse-quently, during ethanol oxidation, the NAD⫹/NADH ratio is significantly decreased, altering the cellular redox state and triggering several adverse events (60). These include inhibition of tricarboxylic acid cycle and reduction of fatty acid oxida-tion, which may lead to hepatic steatosis (75). Moreover, changes of NAD⫹/NADH ratio may also be linked to a decreased Sirt1 deacetylase activity, given that Sirt1 is a NAD⫹-dependent enzyme whose activity improves mitochon-drial function (46). Accordingly, the liver NAD⫹/NADH ratio was decreased in rats after EtOH consumption, and, most importantly, dietary supplementation with BCAAem restored this ratio with an increase of Sirt1 activity.
Reduction of Sirt1 and PGC-1␣, which causes mitochondrial dysfunction in liver of the alcohol-consuming animals (49), was accompanied by reduced expression and function of eNOS. This seems to be relevant because we have previously demonstrated that the eNOS-dependent NO production pro-motes both Sirt1 expression in different tissues, including liver (58), and mTOR activity in skeletal and cardiac muscle cells (23). Moreover, BCAAem was found to activate both eNOS and mTOR signaling pathways in a feed-forward manner in muscle (23).
Notably, our present findings highlight that the amino acid supplementation, although unable to change the free amino acid levels in liver when supplemented alone, normalized the liver concentrations of free arginine, leucine, and tryptophan that were reduced by alcohol consumption. Arginine, a sub-strate of eNOS, produces NO for signaling purposes and citrulline as a byproduct. It is a conditionally essential amino acid in both humans and rodents, as it may be required depending on the health status or life cycle of the individual (8). Arginine has been proposed as a therapeutic supplement in patients with mitochondrial encephalomyopathy, lactic acido-sis, and stroke-like episodes syndrome, which has lower con-centrations of NO metabolites (nitrite and nitrate) during stroke-like episodes (40).
A few studies investigated the efficacy of high doses of arginine for attenuation of ethanol withdrawal signs or in hepatic encephalopathy and hyperammonemia (1, 67, 74). Also, leucine, an essential BCAA whose breakdown products are acetyl-CoA and acetoacetate, is the most important keto-genic amino acid in humans (8). Great advances are presently in progress toward a molecular definition of leucine-dependent mTORC1 activation to coordinate eukaryotic cell growth and metabolism with environmental inputs, including nutrients and growth factors (79). In particular, research has established a central role for mTOR in regulating numerous essential cell processes, from protein synthesis to autophagy, and mTOR
Fig. 7. Branched-chain amino acid-enriched mixture (BCAAem) reduces fat accumulation in HepG2 cells. A: carnitine palmitoyltransferase I (CPT1) mRNA levels were analyzed by means of quantitative RT-PCR. Relative expression values of the untreated cells were taken as 1.0. B: lipid droplets were measured by Oil Red O staining and then dissolved in isopropanol and quantified by reading the absorbance at 510-nm wavelength. All data repre-sented means⫾ SD (n ⫽ 5 experiments). *P ⬍ 0.05 vs. untreated cells; #P ⬍ 0.05 vs. ethanol (EtOH)-treated cells.
AJP-Gastrointest Liver Physiol•doi:10.1152/ajpgi.00231.2017•www.ajpgi.org
AQ: 4 OK
signaling dysfunction is implicated in cancer and diabetes development, as well as in aging (70).
Leucine supplementation has beneficial effects in malnour-ished elderly people with skeletal muscle dysfunction (i.e., sarcopenia) and in other disorders. Moreover, leucine promotes mitochondrial biogenesis, in addition to increased protein syn-thesis (26). Malnutrition and its major component sarcopenia are known to be primarily responsible for the adverse clinical consequences in patients with liver disease (25). EtOH and its
metabolites act on skeletal muscle, and the consequences of liver disease result in disturbed proteostasis (i.e., protein ho-meostasis) and sarcopenia. Leucine supplementation and mi-tochondrial biogenesis-promoting agents are presently in active evaluation to prevent and reverse sarcopenia in patients with ALD and cirrhosis (25).
Finally, tryptophan catabolism in mammals, whose first step is mediated by tryptophan dioxygenase, an enzyme mainly confined to the liver, is known to be implicated in the synthesis
Fig. 8. Endothelial nitric oxide synthase (eNOS) and mammalian/mechanistic target of rapamycin (mTOR) complex 1 (mTORC1) signaling are involved in the protective effect of branched-chain amino acid-enriched mixture (BCAAem) supplementation in HepG2 cells. A: eNOS mRNA was analyzed by means of quantitative RT-PCR. Relative expression value of untreated cells was taken as 1.0. B: phosphorylation of eNOS, Akt, and p70S6 kinase protein was detected by immunoblot analysis. The relative values were detected by densitometric analysis and normalized to total eNOS, Akt, and p70S6 kinase proteins. C: eNOS, peroxisome proliferator-activated receptor-␥ coactivator 1␣ (PGC-1␣), and cytochrome c oxidase subunit IV (COX-IV) protein levels were measured by immunoblot analysis in HepG2 cells transfected with either siRNA against eNOS or nontargeting siRNA and treated with ethanol (EtOH) or BCAAem alone or with EtOH in combination with BCAAem. D: PGC-1␣ and COX-IV protein expression and phosphorylation of p70S6 kinase were detected by immunoblot analysis in HepG2 cells, treated with EtOH or BCAAem alone or with EtOH plus BCAAem coincubated with or without 5M 1H-[1,2,4]oxadiazolo[4,3-a]quinoxalin-1-one (ODQ) for 2 days. Phosphorylation of p70S6 kinase (E) and cytochrome c (Cyt c) and COX-IV protein levels (F) were detected by immunoblot analysis in HepG2 cells with or without 100 nM rapamycin. Values of untreated or vehicle-treated cells were taken as 1.0. Representative immunoblots of 5 reproducible ones are shown. All data represent means⫾ SD (n ⫽ 5 experiments). *P ⬍ 0.05 and **P ⬍ 0.01 vs. untreated or vehicle-treated cells; #P⬍ 0.05 vs. EtOH-treated cells; †P ⬍ 0.01 vs. BCAAem plus EtOH-treated cells.