73
Mapping the environmental pressure due to
economic factors. The case of Italian coastal
municipalities
di Marco Modica∗, Roberto Zoboli∗∗ e Elena Pagliarino***
Abstract
In this paper, we quantitatively characterize the sector specialization of the coastal municipali-ties that may affect the environment of the Italian coastal municipalimunicipali-ties. We first quantified set-tlement pressure on the Italian coasts, then we provide an analysis of economic specializations by sectors of coastal municipalities. Finally, we develop a more specific analysis on the specialization and dependence of coastal municipalities. Focusing on two specific groups of economic sectors: i) those that depend on the sea as the primary source input and ii) those that do not depend on the sea but that have high environmental pressures. We provide evidence of the relationship between the two groups of sectors i.e. ‘marine’ sectors and. ‘high pressure’ sectors in coastal municipalities Keywords: Coastal environment; Integrated Coastal Management; Territorial disparities. JEL Classification: Q25; Q51; Q56; R11.
Mappatura della pressione ambientale dovuta a fattori economici. Il caso dei comuni costieri italiani
Sommario
In questo articolo, caratterizziamo quantitativamente le principali specializzazione setto-riale dei comuni costieri che influenzano l'ambiente litoraneo. Prima si quantificano le pres-sioni di insediamento sulle coste italiane, successivamente si fornisce un'analisi delle specia-lizzazioni economiche a livello settoriale dei comuni costieri. Infine, si sviluppa un'analisi sulla specializzazione e la dipendenza dei comuni costieri dall’ambiente. In particolare, ci concentriamo su due gruppi specifici di settori economici: i) quelli che dipendono dal mare come input primario e ii) quelli che non dipendono dal mare, ma con elevate pressioni am-bientali. In questo modo forniamo la prova della relazione tra i due gruppi di settori, cioè i "marini" e quelli "ad alta pressione" nei comuni costieri.
Parole Chiave: Ambiente costiero; Gestione costiera integrata; Disparità territoriali. Classificazione JEL: Q25; Q51; Q56; R11.
∗ Istituto di Ricerche sulla Crescita Economica e Sostenibile, IRCrES-CNR, Via Corti,
12, Milano , E-mail: [email protected].
∗∗ Facoltà di Scienze Politiche e Sociali, Università Cattolica, Largo Gemelli, 1,
Mila-no, E-mail: [email protected].
*** Istituto di Ricerche sulla Crescita Economica e Sostenibile, IRCrES-CNR, Via Real
Collegio 30 - 10024 Moncalieri, Italy; E-mail:: [email protected]
Introduction
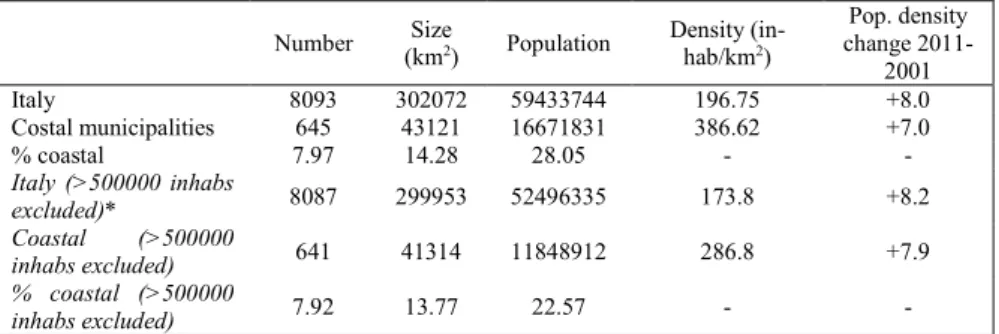
Coastal municipalities in Italy are 645, less than 8% compared to the 8,093 Italian municipalities (2011).1 They cover an area of 43,121 km2, which represents 14.2% of the national territory (with an average area of about 67 km2 compared to a national average of 37 km2). Furthermore, in coastal municipalities resides a population of 16.6 million of inhabitants in 2011, accounting for about 28% of the Italian population (Table 1). The coastal municipalities have therefore a very high average population densi-ty, equal to 387 inhabitants per km2 (against a national average of 197 in-habitants per km2). This evidence immediately suggests a high human pressure on coastal areas resulting from longstanding economic and demo-graphic Italian development.
Despite this large presence of human activities in the coastal areas, all over the world, we note a limited availability, at least to our knowledge, of research on coastal integrated management, at national or supranational level. Indeed, research on coastal integrated management is generally re-ferred to specific case studies (e.g. Cantasano and Pellicone, 2014; Niavis, et al. 2017).
This work, instead, aims at providing a useful tool for a more aggregate level of analysis of the relationship between local economy and the in/direct pressure on the sea. The main goal of the paper is to provide a possibly complete and updated map on the characteristics of the Italian coastal municipalities and economic areas they belong to. It also provides consistent and clear indications on the human pressure and the possible en-vironmental pressures on the coastal areas of the regions object of study. In this way, this paper could be a useful tool for implementing policies and coastal integrated management strategies (Cantasano and Pellicone, 2014; Olsen, 2003) that reduce the environmental pressures while preserving the economic activities related to ‘marine’ activities.
In order to reach the goal of the paper we need to highlight that Italian coastal municipalities include some large cities, which could bias the ag-gregate data. Then, to be more confident about the effective human pres-sure exerted on the Italian coasts, Table 1 shows the data on population density excluding the cities (coastal and non-coastal) with more than 500,000 inhabitants. In the case of coastal municipalities, it comes to Gen-oa, Rome, Naples and Palermo.
In this way, excluding the large cities, our descriptive statistics denote very few changes. In fact, the coastal municipalities without the big cities occu-py 13.7% of the Italian territory, with 22.6% of the population (11.8 million inhabitants) living there, which leads to a population density of about 287 inhabitants / km2 while the national average, calculated with homogenous standard, is of 174 inhabitants / km2.
At the same time, the change in population density between 2001 and 2011 (excluding the large cities) is higher (8 inhabitants / km2) compared to the figure that includes the big cities, a sign that the pressure of settlement on the four large coastal cities has slowed more than in coastal municipalities. It also should be noted that the four coastal cities excluded account for around 4.8 million inhabitants, almost 29% of all coastal municipalities, and this has a complex influence on the economic characterization of coastal municipalities, in particular in the case of Lazio (Rome) and Cam-pania (Naples). Therefore, even excluding the larger coastal cities, the rela-tive density of the coastal municipalities is still very high compared to the national average density (both with and without the big cities) and it is still increasing.
Tab. 1 Italian coastal municipalities in 2011 (Elaboration from ISTAT). Number Size (km2) Population Density (in-hab/km2) Pop. density change 2011-2001 Italy 8093 302072 59433744 196.75 +8.0 Costal municipalities 645 43121 16671831 386.62 +7.0 % coastal 7.97 14.28 28.05 - - Italy (>500000 inhabs excluded)* 8087 299953 52496335 173.8 +8.2 Coastal (>500000 inhabs excluded) 641 41314 11848912 286.8 +7.9 % coastal (>500000 inhabs excluded) 7.92 13.77 22.57 - -
* 4 coastal municipalities (Genoa, Naples, Palermo and Rome), and 2 non-coastal (Milan and Turin) The Italian coasts, then, are subject to strong human pressures with respect to the non-coastal areas and the environmental impact on the coastal and marine territory might be severe (Arto et al., 2012; Barzotto et al., 2014; Bowen and Riley, 2003, Turner, 2000). Furthermore, the resilience of these areas can be reduced (Guarascio et al., 2017; Modica and Reggiani, 2014, 2015) and their vulnerability can be increased (Modica and Zoboli, 2016).2
2 This analysis may be also useful in the evaluation of natural disasters, in particular in the
coastal areas and for flood risk (see for more details, Meroni et al., 2016; Modica et al., 2016 and Sterlacchini et al., 2016)
Nonetheless, we are confident that the presence of large cities do not bias our analysis. Then, as we said above, the goal of the analysis is to provide a characterization of the overall Italian coastal municipalities (of the selected regions) allowing to highlight their specialization in terms of economic ac-tivities and economic dependence on marine production sectors (i.e. sectors that are closely dependent on the ecological conditions of the sea because such as fishing). Moreover, we also highlight the environmental pressure due to high pollutant sectors in the coastal municipalities (the so-called high impact sectors). This second group of sectors deserves a more in depth discussion. Indeed, the selection of these sectors has been made up in the light of those economic activities not directly linked to maritime resources, but localized in coastal zones that may exert environmental pressures, on the coast and the sea on the basis of two main arguments: (i) the literature on pressures (see for instance Marin and Mazzanti (2013) and Fadda (2016)); and (ii) an indicator on the CO2 emission intensity, atmospheric pollutant and heavy metals per employed derived by NAMEA. (Moll et al. 2007). NAMEA tables provide the link between environmental pressures (in terms of air emissions) and economic data (e.g. employment, value add-ed, and output)for branches of resident units (see Marin and Mazzanti 2013, for details).3
We then will be able to determine the presence of coastal areas that are sub-jected to a strong environmental pressure due to both the impact caused by the economic sectors depending on the sea and the high impact sectors and we can have evidence of a possible interrelation between the two groups of sectors.4
The data used in this analysis come from the Census of Industries and Ser-vices developed by ISTAT in 2011. These data provide a very detailed in-formation at municipality scale on the characteristic of firms and employ-ments that could be sufficient to characterize municipalities in terms of productive structure. The Census data are available at the municipal level for 352 sectors ATECO 2007 (at different levels of aggregation for Sec-tions, Divisions, Groups), by size class (15 classes), by type of legal form (12 types) and other features (Marra and Turcio, 2016). For our purposes, we have used data on total employees for municipality for each sector
3 In this way, even tough not perfectly, it may be possible to recognize CO2 emissions per
each employed at sectoral level. This might be considered then as a proxy for high pollutant sectors (derived as a proxy of CO2 emissions by the sector), even not related directly to sea
ATECO 2007 (with a selection of 120 areas in the levels of aggregation among the three available).
The analysis is conducted on seven Italian regions: Campania, Emilia Ro-magna, Friuli-Venezia Giulia, Liguria, Apulia, Sardinia and Veneto. These are the regions that have the most peculiar characteristics throughout the country in terms of length of coastal territory, number of coastal municipal-ities and ratio between coastal areas and hinterland areas, generalization over the entire Italian territory might be done, however to avoid redundan-cy we focus only on the above regions.
The paper is organized as follows: Section 2 describes the case studies and the Italian contrast between coastal and non-coastal areas. Section 3 shows the economic dependence on marine resources and areas of high en-vironmental pressure for all the case studies. Section 4 concludes.
1. Study sites and methods
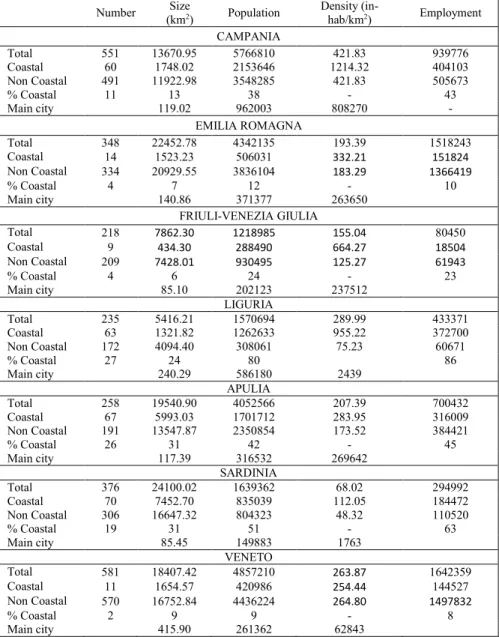
The main population data are available in Table 2 and are based on the data of the Census of population and housing of 2011 carried out by ISTAT. All the regions show higher population density in the coastal mu-nicipalities with respect to the hinterland, with the only exception being Veneto where the residential density is not very different from the Italian average: 254.44 inhab./km2 in the coastal municipalities, but it is a bit low-er than the value of the non-coastal municipalities (264.80 inhab./km2). In this situation, the anthropological pressure is higher in the hinterland than in the coast (more details in Table 2).
This evidence shows that even if the total surface of coastal municipali-ties cover only a small part of the entire regional area however, coastal mu-nicipalities are usually subject to a strong human pressure greater than that of non-coastal areas. These data, however, reflect only the demographic characteristics. Regarding the economic data, there are some differences: according to the Census of Industries and Services developed by Istat in 2011, in Campania the employees in all sectors were 939,776 (17% of the total regional population), of these, 43% of the total were employed in ac-tivities located in coastal municipalities. This indicates an even higher den-sity of employment for coastal municipalities, albeit slightly, with respect to the population density and, therefore, these coastal municipalities could be thought as net attractors of work.
Tab. 2 - Coastal and non-coastal municipalities of the selected regions, 2011. Number Size (km2) Population Density (in-hab/km2) Employment CAMPANIA Total 551 13670.95 5766810 421.83 939776 Coastal 60 1748.02 2153646 1214.32 404103 Non Coastal 491 11922.98 3548285 421.83 505673 % Coastal 11 13 38 - 43 Main city 119.02 962003 808270 - EMILIA ROMAGNA Total 348 22452.78 4342135 193.39 1518243 Coastal 14 1523.23 506031 332.21 151824 Non Coastal 334 20929.55 3836104 183.29 1366419 % Coastal 4 7 12 - 10 Main city 140.86 371377 263650 FRIULI-VENEZIA GIULIA Total 218 7862.30 1218985 155.04 80450 Coastal 9 434.30 288490 664.27 18504 Non Coastal 209 7428.01 930495 125.27 61943 % Coastal 4 6 24 - 23 Main city 85.10 202123 237512 LIGURIA Total 235 5416.21 1570694 289.99 433371 Coastal 63 1321.82 1262633 955.22 372700 Non Coastal 172 4094.40 308061 75.23 60671 % Coastal 27 24 80 86 Main city 240.29 586180 2439 APULIA Total 258 19540.90 4052566 207.39 700432 Coastal 67 5993.03 1701712 283.95 316009 Non Coastal 191 13547.87 2350854 173.52 384421 % Coastal 26 31 42 - 45 Main city 117.39 316532 269642 SARDINIA Total 376 24100.02 1639362 68.02 294992 Coastal 70 7452.70 835039 112.05 184472 Non Coastal 306 16647.32 804323 48.32 110520 % Coastal 19 31 51 - 63 Main city 85.45 149883 1763 VENETO Total 581 18407.42 4857210 263.87 1642359 Coastal 11 1654.57 420986 254.44 144527 Non Coastal 570 16752.84 4436224 264.80 1497832 % Coastal 2 9 9 - 8 Main city 415.90 261362 62843
of employment than population density and therefore, the coastal munici-palities of Emilia Romagna might be seen as net "exporters" of work. These data therefore draw a very heterogeneous picture between regions and it might be considered as a complete taxonomy of the entire country.
1.1. Absolute economic specialization
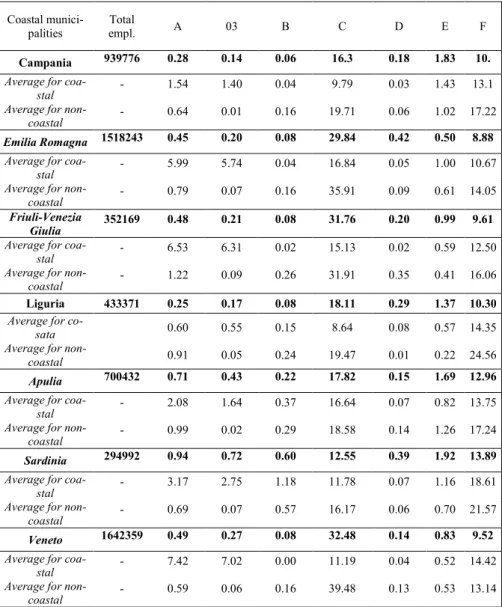
A first indicator of (absolute) specialization is represented by the per-centage of each sector on the employment in the municipality. The main results are presented as the average of all municipalities of a region in Tab.3.
In Campania, considering the major sectors as presented by ATECO 2007, the primary sector (agriculture, forestry and fishing) represents an average of 1,53% of the whole municipal employment in the coastal munic-ipalities with respect to about 0,6% in the non-coastal municmunic-ipalities. Al-most all the manufacturing sectors have a higher average of the percentage of the employment in the non-coastal municipalities than in the coastal ones. On the contrary, most of services have a higher average of the per-centage of the employment in the coastal municipalities than in the non-coastal ones. More specifically, the trade represents a very high level of employment in the coastal municipalities (an average of 27,32% with re-spect to the 26,98% in the non-coastal municipalities), and the same hap-pens in the sector of tourism.
In Emilia Romagna, the primary sector (agriculture, forestry and fish-ing) represents an average share of 5,99% of the whole municipal employ-ment in the coastal municipalities with respect to about 0,79% in the non-coastal municipalities. These values reach relatively high levels in the sec-tor of fishing (5,74%) with respect to agriculture (0,2%). The manufactur-ing sectors have in average a higher employment level in non-coastal mu-nicipalities than in coastal ones. The services, instead, show higher averag-es of employment in coastal municipalitiaverag-es, averag-especially for activitiaverag-es linked to tourism.
In Friuli Venezia Giulia, the primary sector (agriculture, forestry and fishing) represents an average share of 6,53% of the whole municipal em-ployment in the coastal municipalities with respect to 1,22% (with very high values for fishing). In the manufacturing sectors, the pattern shows a typical trend similar to other regions with higher averages in non-coastal municipalities.
Tab. 3 - Average share of employment of productive sectors of coastal municipalities of the regions under study and comparison with common non-coastal,%, 2011 for some selected sectors. Coastal munici-palities Total empl. A 03 B C D E F Campania 939776 0.28 0.14 0.06 16.3 0.18 1.83 10. Average for
coa-stal
- 1.54 1.40 0.04 9.79 0.03 1.43 13.1
Average for
non-coastal - 0.64 0.01 0.16 19.71 0.06 1.02 17.22
Emilia Romagna 1518243 0.45 0.20 0.08 29.84 0.42 0.50 8.88
Average for
coa-stal - 5.99 5.74 0.04 16.84 0.05 1.00 10.67 Average for
non-coastal
- 0.79 0.07 0.16 35.91 0.09 0.61 14.05
Friuli-Venezia Giulia
352169 0.48 0.21 0.08 31.76 0.20 0.99 9.61 Average for
coa-stal - 6.53 6.31 0.02 15.13 0.02 0.59 12.50 Average for
non-coastal - 1.22 0.09 0.26 31.91 0.35 0.41 16.06 Liguria 433371 0.25 0.17 0.08 18.11 0.29 1.37 10.30 Average for
co-sata 0.60 0.55 0.15 8.64 0.08 0.57 14.35 Average for
non-coastal 0.91 0.05 0.24 19.47 0.01 0.22 24.56
Apulia 700432 0.71 0.43 0.22 17.82 0.15 1.69 12.96
Average for coa-stal
- 2.08 1.64 0.37 16.64 0.07 0.82 13.75
Average for
non-coastal - 0.99 0.02 0.29 18.58 0.14 1.26 17.24
Sardinia 294992 0.94 0.72 0.60 12.55 0.39 1.92 13.89
Average for
coa-stal - 3.17 2.75 1.18 11.78 0.07 1.16 18.61 Average for
non-coastal - 0.69 0.07 0.57 16.17 0.06 0.70 21.57
Veneto 1642359 0.49 0.27 0.08 32.48 0.14 0.83 9.52
Average for coa-stal
- 7.42 7.02 0.00 11.19 0.04 0.52 14.42
Average for
non-coastal - 0.59 0.06 0.16 39.48 0.13 0.53 13.14
Nace rev2 sectors: A: Agriculture; 03: Fishing; B: Mining; C: Manufacture; D: Electricity; E:Water supply; F: Construction
Tab. 3 - (continued)
Coastal municipalities G H I J K L M P
Campania 27 7.4 7. 1.49 2.22 0.96 7.49 1.12 Average for coastal 27.3 4.34 18.2 1.17 1.16 0.99 7.13 0.52 Average for non-coastal 26.9 4.51 9.08 0.68 1.04 0.44 7.32 0.78
Emilia Romagna 19.2 4.97 8.38 2.15 3.39 2.26 6.52 0.30
Average for coastal 22.4 3.54 15.09 1.30 1.66 4.70 5.32 0.21 Average for non-coastal 18.1 4.80 9.16 1.07 0.86 1.70 4.24 0.20
Friuli-Venezia Giulia 17.3 4.18 7.19 2.07 5.41 1.74 6.72 0.35
Average for coastal 20.5 3.26 15.96 1.72 3.47 3.16 5.70 0.33 Average for non-coastal 17.7 3.09 12.84 0.89 1.12 1.36 4.61 0.41 Liguria 20.58 8.97 8.97 1.76 3.04 2.15 7.91 0.34 Average for cosata 24.35 3.72 22.35 1.19 1.09 3.57 6.34 0.30
Average for non-coastal 20.68 3.78 15.78 0.54 0.77 1.10 4.41 0.11
Apulia 26.89 5.22 0.08 0.02 1.93 0.79 7.55 0.42
Average for coastal 28.15 2.92 0.14 0.01 0.97 0.70 6.77 0.31 Average for non-coastal 28.80 3.84 0.08 0.01 1.27 0.47 6.42 0.31
Sardinia 26.17 6.05 9.54 2.31 2.58 1.08 7.35 0.49
Average for coastal 25.44 3.35 15.55 0.89 0.80 1.31 5.80 0.30 Average for non-coastal 28.43 4.55 11.43 0.52 0.38 0.19 5.59 0.18
Veneto 21.26 4.40 7.39 2.03 3.42 2.26 6.15 0.28
Average for coastal 25.09 4.37 15.58 0.74 0.63 3.73 4.81 0.25 Average for non-coastal 18.33 3.69 8.76 0.92 1.27 1.91 4.29 0.21
Nace rev2 sectors: G: Wholesale; H: Transport; I: Accommodation; J:Information and communication; K:Financial activities; L:Real estate; M: Professional, scientific and technical activities; P: Education; Q: Health, not included for space constraints. Results are available upon request
In Liguria, the primary sector (agriculture, forestry and fishing) repre-sents an average share of 0,6% of the whole municipal employment in coastal municipalities with respect to about 0,9% in non-coastal municipali-ties. These values reach relatively high levels in the sector of fishing (0,5%) with respect to agriculture (0,04%), and this is the opposite trend of non-coastal municipalities. In Liguria, constructions represent a significant sec-tor of employment, with average percentages that reach 14,3% in coastal municipalities and 24,5% in non-coastal municipalities. Most of services
have a higher average of the percentage of the employment in coastal mu-nicipalities than in non-coastal ones.
In Apulia, the primary sector (agriculture, forestry and fishing) repre-sents an average share of 2,08% of the whole municipal employment in coastal municipalities with respect to about 0,99% in non-coastal munici-palities. This percentage is mainly due to the employment in the fishing, which is 1,64% with respect to the 0,32% of agriculture. The manufactur-ing sector has an average employment of 16,63% in coastal municipalities and an average of 18,57% in non-coastal ones. It has to be noted that in some sectors, especially those in which a certain quantity of freshwater is required (such as the production of beverages or the leather manufacturing), the average employment is higher in coastal municipalities than in non-coastal ones. The building sector instead hires more people in non-non-coastal municipalities 17,24% with respect to 13,75%). Finally, in the sector of services the averages in the coastal municipalities (28,15%) is almost the same as in non-coastal ones (28,78%).
In Sardinia, the primary sector (agriculture, forestry and fishing) covers an average share of 3.17% of the occupation in coastal municipalities com-pared to a much lower 0.69% for non-coastal. This difference is due mainly to the level of employment of the fisheries sector, equal to 2.75% compared to 0.35% of the agriculture sector. These values are greater in comparison to the average share for the non-coastal areas. The opposite occurs in the manufacturing sectors, which have an average of 11,78% of employment in coastal municipalities and an average of 16.17% of employment in non-coastal areas. The constructions instead occupy a larger share of individuals in non-coastal areas (21.51% vs. 18.61%). Finally, with regard to services, the average share of employment of the commercial activities of the coastal municipalities (25.44%) is lower than the average of the employment shares of common non-coastal (28.43%), while accommodation services and catering (tourism), information services and communications, financial services, education and real estate activities are on average higher in the coastal municipalities.
Veneto in the primary sector (agriculture, forestry and fishing) covers an average share of 7.42% of total employment in the coastal municipalities compared to a 0.59% in non-coastal areas. In most manufacturing sectors and services, the employment shares exceed those of non-coastal areas, fol-lowing a pattern similar to that of Emilia-Romagna.
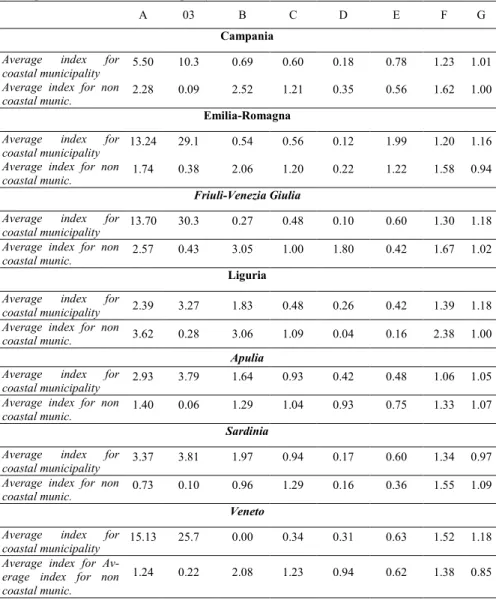
2.2 Relative economic specialization
The economic specialization of the municipalities can be seen in relative terms through local specialization indices given by the ratio between the shares of each sector in each municipality with respect to the share that the same sector has in the regional employment. An index greater than 1 sug-gests a specialization relative to the region. More in detail, defined i the municipality and j the sector, the index of local specialization is given by:
,
where Aij is the number of employees in the sector j in the municipality i
and this implies that the following sums are: is the total number of employees for any sectors, j; is the total number of employees in the municipality, i and is the total number of employees in the region.
Another indicator that measures the difference in specialization between coastal municipalities and the region consists of the index of dissimilarity. This is given by:
that is half of the sum of the absolute differences between the sum of the shares of sector j in the employment of the municipality i, and the sum of the shares of employment of sector j to the total regional employment in all sectors. This index varies between zero and one with zero indicating com-plete correspondence, and 1 full difference between the production struc-tures of municipality i and region. The results are provided in Table 4 and graphically are represented in Figure 1
In summary, Campania shows a situation where the coastal municipali-ties show a dissimilarity index slightly lower, in average (0.55) than that of non-coastal ones (0.60) thus presenting a greater similarity, albeit slight, of production structure (employment) than non-coastal. Figure 1a confirms this slight tendency, although it is not delineable a dominant structure. In conclusion, although the coastal municipalities have a production structure typical and different from the non-coastal ones, (i.e. high shares of certain sectors municipal employment, specialization or de-specialization in given sectors), they influence the entire production structure in a slightly more pronounced way than non-coastal areas.
Tab. 4 - Local specialization index of productive sectors (employment) in coastal municipal-ity compared to non-costal municipalmunicipal-ity, 2011.
A 03 B C D E F G
Campania Average index for
coastal municipality
5.50 10.3 0.69 0.60 0.18 0.78 1.23 1.01
Average index for non
coastal munic. 2.28 0.09 2.52 1.21 0.35 0.56 1.62 1.00 Emilia-Romagna
Average index for
coastal municipality 13.24 29.1 0.54 0.56 0.12 1.99 1.20 1.16 Average index for non
coastal munic.
1.74 0.38 2.06 1.20 0.22 1.22 1.58 0.94
Friuli-Venezia Giulia
Average index for coastal municipality
13.70 30.3 0.27 0.48 0.10 0.60 1.30 1.18
Average index for non
coastal munic. 2.57 0.43 3.05 1.00 1.80 0.42 1.67 1.02 Liguria
Average index for
coastal municipality 2.39 3.27 1.83 0.48 0.26 0.42 1.39 1.18 Average index for non
coastal munic. 3.62 0.28 3.06 1.09 0.04 0.16 2.38 1.00
Apulia
Average index for
coastal municipality 2.93 3.79 1.64 0.93 0.42 0.48 1.06 1.05 Average index for non
coastal munic.
1.40 0.06 1.29 1.04 0.93 0.75 1.33 1.07
Sardinia
Average index for coastal municipality
3.37 3.81 1.97 0.94 0.17 0.60 1.34 0.97
Average index for non
coastal munic. 0.73 0.10 0.96 1.29 0.16 0.36 1.55 1.09
Veneto
Average index for coastal municipality
15.13 25.7 0.00 0.34 0.31 0.63 1.52 1.18
Average index for Av-erage index for non coastal munic.
1.24 0.22 2.08 1.23 0.94 0.62 1.38 0.85
Nace rev2 sectors: A: Agriculture; 03: Fishing; B: Mining; C: Manufacture; D: Electricity; E:Water supply; F: Construction; G: Wholesale
Tab. 4 - (continued).
H I J K L M P Dissimilarity Index
Campania Average index for
coastal municipality 0.59 2.48 0.79 0.52 1.03 0.95 0.47 0.55 Average index for non
coastal munic.
0.61 1.23 0.46 0.47 0.45 0.98 0.70 0.60
Emilia-Romagna Average index for
coastal municipality
0.71 1.80 0.61 0.49 2.08 0.82 0.69 0.43
Average index for non
coastal munic. 0.97 1.09 0.50 0.25 0.75 0.65 0.65 0.44
Friuli-Venezia Giulia
Average index for
coastal municipality 0.78 2.22 0.83 0.64 1.82 0.85 0.92 0.46 Average index for non
coastal munic. 0.74 1.79 0.43 0.21 0.78 0.69 1.15 0.55 Liguria
Average index for
coastal municipality 0.41 2.49 0.68 0.36 1.66 0.80 0.89 0.39 Average index for non
coastal munic. 0.42 1.76 0.31 0.25 0.51 0.56 0.33
0.54
Apulia
Average index for coastal municipality
0.56 1.79 0.55 0.50 0.89 0.90 0.75 0.26
Average index for non
coastal munic. 0.73 1.07 0.49 0.65 0.59 0.85 0.75 0.28
Sardinia
Average index for
coastal municipality 0.55 1.63 0.38 0.31 1.21 0.79 0.62 0.31 Average index for non
coastal munic. 0.75 1.20 0.22 0.15 0.18 0.76 0.37 0.40
Veneto
Average index for
coastal municipality 0.99 2.11 0.36 0.19 1.65 0.78 0.88 0.46 Average index for
Av-erage index for non coastal munic.
0.84 1.19 0.46 0.36 0.84 0.70 0.73 0.47
Nace rev2 sectors: H: Transport; I: Accomodation; J:Information and communication; K:Financial activities; L:Real estate; M: Professional, scientific and technical activities; P: Education; Q: Health, not included for space constraints. Results are available upon request.
Fig.1 - Index of dissimilarity for the municipalities of regions under study, 2011
a) Index of dissimilarity for Campa-nia
b) Index of dissimilarity for l’Emilia Romagna
c) Index of dissimilarity for Friuli d) Index of dissimilarity for Liguria
g) Index of dissimilarity for Veneto
Emilia Romagna shows a varied situation, as shown by the dissimilarity index presented in the last column of Table 4 and in the Figure. 1b. Coastal municipalities present an identical dissimilarity index, with an average val-ue of 0,44 very close to the 0,45 of coastal municipalities, presenting a lack of differentiation in the productive structure (employment) with respect to non-coastal municipalities. It is therefore possible to conclude that, even if costal municipalities have typical productive structures different from those in non-coastal municipalities, they nevertheless influence the entire region-al productive structure much more than non-coastregion-al municipregion-alities.
In Friuli Venezia Giulia, both coastal and non-coastal municipalities have on average a positive localized specialization (>1) –with respect to the regional average- in the primary sector (the same as in the previous two re-gions). It is possible to find differences in the manufacturing of fish and shellfish, sector that represents a high specialization of non-coastal munici-palities. This is due to the high level of specialization of some non-coastal municipalities very close to coastal municipalities. In some manufacturing activities, coastal municipalities are de-specialized but there are some sub-sectors in which coastal municipalities are highly specialized, such as the fruit manufacturing, the textile industry, and oil refining. In some sectors in which coastal municipalities are de-specialized (index <1), they have in av-erage a higher specialization index than non-coastal municipalities.
Liguria, with an average index of 0.39 coastal municipalities, has a stronger similarity of their productive structure (employment) with respect to non-coastal municipalities (index 0.54). Therefore, coastal municipalities have a typical productive structure very different from non-coastal
munici-palities, they have a certain specialization or de-specialization with respect to the regional average in the different productive sectors (e.g., manufactur-ing vs. services), but nevertheless they influence the whole Ligurian pro-ductive structure, much more than non-coastal municipalities. This result reflects also the fact the 86% of the whole employed people belong to com-panies localized in coastal municipalities.
In Apulia (Figure 1e), coastal municipalities have a positive average (>1) in the local specialization (with respect to the regional average) in the primary sector (2.93), value given by a higher local specialization in almost all the primary sub-sectors (agriculture 1.23; forestry 6.38; fishing 3.79). Non-coastal municipalities, instead, are in average specialized in this sector (1.39), but have an exclusive specialization only in the agriculture (3.09) and forestry (8.39). Coastal municipalities are de-specialized in manufac-turing. In some other sectors in which coastal result to be de-specialized (index <1), these have in average a lower specialization index than non-coastal municipalities. It is the case of energy, water and garbage, trans-ports, education, public health.
Sardinia has a pretty varied situation because there is not a clear pattern distinguishing coastal and non-costal municipalities. Some sectors have an absolute specialization in coastal municipalities, but do not have a relative specialization with respect the region, where the same sectors present high-er shares of sectorial employment. Othhigh-er sectors, instead, have a high abso-lute specialization in non-coastal municipalities, but do not have it in rela-tive terms with respect to the region. Moreover, it is possible to figure out intermediate situations where there is not an absolute specialization either in costal or in non-coastal municipalities. The average dissimilarity index in coastal municipalities is 0.31 and is lower than the average index in non-coastal municipalities (0.40). This shows that non-coastal municipalities have a higher degree of similarity of the productive structure (employment) with respect to non-coastal municipalities. Finally, Figure 1f shows that the highest degree of dissimilarity is in the inner part of the region. Given this evidence, it is possible to conclude that, even if coastal municipalities have typical productive structures different from those of non-coastal munici-palities, they influence the whole regional productive structure. This result reflects also the fact that the 63% of the whole employed people work for companies localized in coastal municipalities.
In Veneto (Fig.1g) the results and the productive structure result to be coherent with those obtained for Emilia Romagna and then it is possible to
2. Results and Discussions
The analysis and the indicators above can be detailed for two groups of sectors that represent a more direct interface between the local economy and marine resources, namely sectors highly dependent on sea (‘marine’ sectors) and ‘non-marine’ sectors with high pressures on the coastal envi-ronment, from now on ‘high impact’ sectors (EEA, 2013).
First, as part of the census data for the sectors ATECO 2007, were iden-tified sectors that are closely dependent on the sea because of its ecological conditions (i.e. fishing).
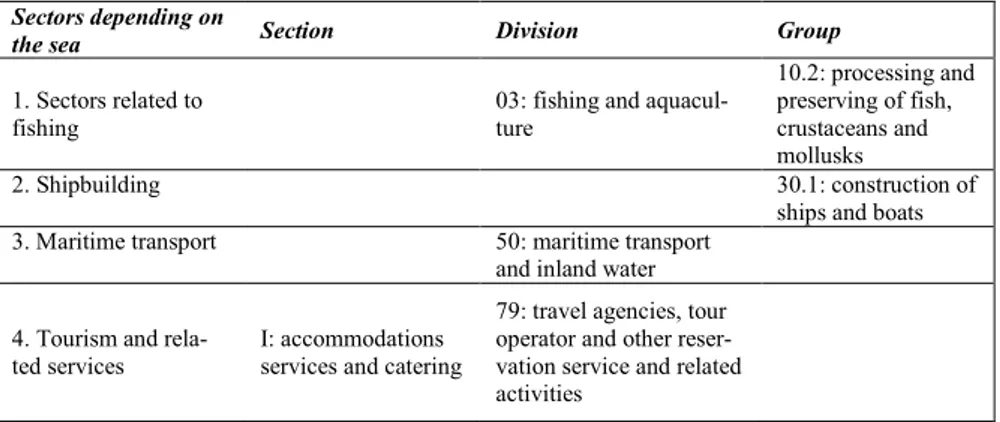
The four groups of selected sectors are shown in Table 5. Compared to the classification ATECO, they have been identified by selecting the entire section (as in the case of the 'activity of accommodation and catering'), or specific Divisions (as in the case of 'fishing and aquaculture' which belongs to Section A, Agriculture, and 'shipping', which belongs to Section H and so on), or individual groups (as in the case of 'canned fish' and 'construction of ships and boats' which belong to Section C, manufacturing).
Tab. 5 - Sectors dependent on marine resources by sections, divisions and groups ATECO 2007.
Sectors depending on
the sea Section Division Group
1. Sectors related to fishing
03: fishing and aquacul-ture 10.2: processing and preserving of fish, crustaceans and mollusks 2. Shipbuilding 30.1: construction of
ships and boats 3. Maritime transport 50: maritime transport
and inland water
4. Tourism and rela-ted services
I: accommodations services and catering
79: travel agencies, tour operator and other reser-vation service and related activities
The sectors of fishing and tourism need some clarifications. In the case of fisheries, as already noted, the census data may represent an underesti-mation of the actual systematic employment sector, which reduces the weight of the industry compared to other organizations that work with en-terprise more structured (Mazzanti and Zoboli, 2009). A more thorough analysis of the figures for fishing will be carried out in future works.
In the case of tourism, it is obvious that the distinction between marine tourism and other accommodation and food activities is not immediate. However, to our level of analysis, that we recall lies in analysis of the
em-ployment in this sector for the coastal municipalities it might be logically expected that the sea is the main attraction for tourist destination and recre-ation in coastal municipalities. Anyhow, the activities of accommodrecre-ation and catering in medium and large coastal cities, such as Genoa in Liguria, may cover activities that have nothing to do with the marine tourism but unfortunately, there is not a systematic survey of the motivations of the presences in hotels and acquaintances of shops, which allow a clear picture to the municipal level. More detailed analysis on the number of tourists will be developed in future works. The economic variables (employment, in our case) for these four aggregates of sectors can point that coastal municipali-ties, and the areas they belong to, are economically dependent on the sea.
These same groups of sectors are the immediate interface between the local economy and the sea and present, always according to the productive techniques they use, significant environmental impact on the marine re-sources, on the coasts and on the environment in general. For example, in terms of CO2 emissions per each employed person, fishing and maritime transports are among the sectors with the highest indicators (Mazzanti et al., 2012). According to this same indicator, tourism seems to be a “light” sector in terms of expected direct impacts, but several other sectors are linked to tourism, such as touristic service providers or tourists themselves. Moreover, even if the justification of tourism or of the stay is not linked to the sea, for the fact itself that it takes place in maritime municipalities it makes some pressures on the maritime-coastal environment. On the other hand, these same sectors critically depend on the availability and the quali-ty of natural maritime and coastal resources, without which fundamental inputs are missing. These groups of sectors are therefore the midpoint of a “sustainable maritime economy” which may guarantee continuous incomes and employment, both quantitatively and qualitatively significant, using natural and environmental resources.
A second group of sectors is made up of those “high pressure” economic activities, that is to say those activities not directly linked to maritime re-sources, but localized in coastal zones and that may exert environmental pressures, both directly and indirectly, on the coast and the sea (pollution, industrial risks, permanent territorial changes). These are sectors belonging to heavy industries or intensive manufactures of resources. These sectors have been selected on the basis of: (i) the literature on pressures; and (ii) an indicator on the CO2 emission intensity, atmospheric pollutant and heavy metals per employed derived by NAMEA., (Moll et al. 2007).
characteristics of the productive sectors. For example, the intensity of CO2 per employed summarizes the energy technology of the sector, which is in turn linked to the capital intensity of the sector (plant design). therefore It can indirectly suggest the presence of localized aggregate pollution, the in-tensive presence of infrastructures (e.g., communications and transports), the presence of industrial incidents. Further details on the pressures of some of these sectors will be presented in future works.
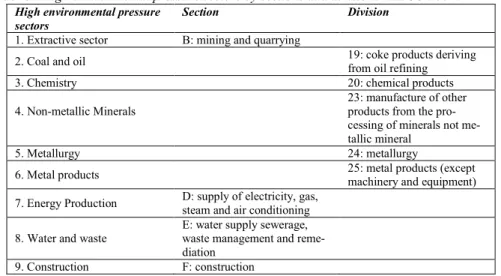
The sectors selected on the basis of the literature and the indicators de-riving from NAMEA are shown in Table 6 and are composed either of whole ATECO section or of Divisions selected within Section C, Manufac-turing activities. It should be noted that, while the mining, quarrying, man-ufacturing, energy, water and waste, and those selected are manufacturing-intensive emissions per employee, in the cases of extractive and construc-tion sectors the direct emission, according to NAMEA, are relatively low. However, these two sectors are intensive of the territory, in the sense that involve permanent or semi-permanent alterations, and also produce a high intensity of waste (by weight) thus loading the territory of high overall en-vironmental pressures (see, among others, Mazzanti, Paleari, Zoboli 2007). Tab. 6 - High environmental pressure sectors by sections and divisions ATECO 2007.
High environmental pressure sectors
Section Division
1. Extractive sector B: mining and quarrying
2. Coal and oil 19: coke products deriving from oil refining
3. Chemistry 20: chemical products
4. Non-metallic Minerals
23: manufacture of other products from the pro-cessing of minerals not me-tallic mineral
5. Metallurgy 24: metallurgy
6. Metal products 25: metal products (except
machinery and equipment) 7. Energy Production D: supply of electricity, gas,
steam and air conditioning 8. Water and waste
E: water supply sewerage, waste management and reme-diation
9. Construction F: construction
The joint consideration of specialization of coastal municipality in sec-tors that are directly related to the sea (in economic-environmental terms) and the specialization of coastal municipality in sectors of high environ-mental pressure can then provide an overview of: (i) dependence of the economy from the sea; (ii) the pressure of the local economy on the sea, through the impacts of ‘marine’ and high pressure sectors that are resources
intensive; (iii) potential conflicts between economic sectors that are de-pendent from the sea and the high environmental pressure sectors that overwork the sea and the coasts.
2.1 Campania
In Campania much of the coastal municipalities has a high share of em-ployment in sectors related to the sea. The average share of emem-ployment of coastal municipalities is around 21%, well above the average for non-coastal (about 9%).
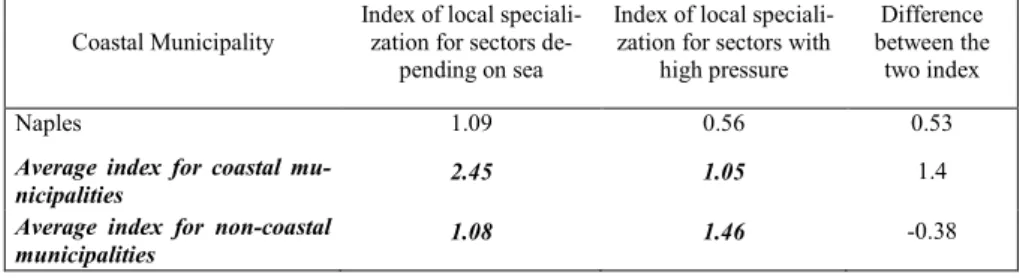
It is however important to note that the index of local specialization for sectors depending on the sea is less than 1 in very few occasions (5 coastal municipalities of 60). The index of local specialization of coastal munici-palities in average is equal to 2.4 compared with a 1.08 for non-coastal (where there are tourist activities that affect the data).
At the same time, the total employment for sectors with 'high environ-mental pressure' is equal to 16%. The coastal municipalities have an aver-age of shares slightly higher (17.2%), but lower than in non-coastal areas (24.04%). However, that the indices of local specialization of these sectors in the majority of cases is less than 1 and the average value of the indexes of local specialization in coastal municipalities is slightly above this threshold (1.05). This value is lower than the average of the index of spe-cialization of non-coastal municipalities (1.46).
So as a first conclusion in several coastal municipalities, there is the presence of high environmental pressure on the environment however this plays a greater role in non-coastal areas. Table 7 and Figures 2a and 2b show that in many coastal municipalities coexist sectors depending on the sea and intensive sectors that have high impact on the environment.
Tab. 7 - Comparison between specialization index of sectors related to the sea and sectors with high impact for coastal municipality (if negative: relative specialization in sectors with high pressure), Campania, 2011.
Coastal Municipality
Index of local speciali-zation for sectors
de-pending on sea
Index of local speciali-zation for sectors with
high pressure
Difference between the
two index
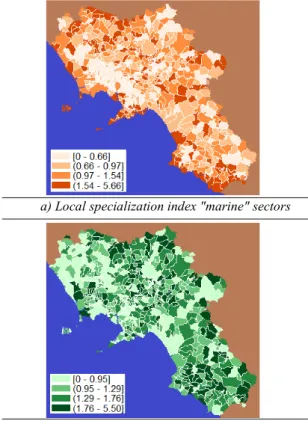
Fig. 2. - Local specialization index for "marine" and "high pressure" sectors in the munici-palities of Campania, 2011.
a) Local specialization index "marine" sectors
b) Local specialization index "high impact" sec-tors
2.2 Liguria
In Liguria, most of coastal municipalities has high levels of occupation in sectors linked to the sea, as they are defined here. In some cases, these shares are over the 50% and are in most cases higher than the regional av-erage (12%), and only in few municipalities they are lower than 10%. The average of coastal is around 24%, significantly higher than the average for non-coastal (16%), with a significant variability. It has to be noted, any-how, that tourism is the leading sector, in the whole region and for both types of municipalities. Tourism has employment shares very close to the total (with a low variability among coastal municipalities).
The result of the relative weight of tourism among the maritime sectors may derive from an underestimation of the effective number of employed in the fishing and other sectors linked to the sea (transports). Moreover, some sectors, such as shipbuilding and maritime transports, are presented with companies and employees only in some municipalities, in particular in larger ones (e.g., the maritime transports in Genoa that use the 4% of the total operators) or in some very specialized municipalities (such as ship-building in Ceriale, Ameglia, Lerici). These same sectors present shares that, even if low overall, they are nevertheless multiple with respect to the same sectors in non-coastal municipalities.
It is relevant to note that the local specialization index for the sectors depending on the sea (ratio between the share of the sectors in the munici-pality and the share of the sectors in the region, Table 8) in less than 1 (lack of specialization) for 11 coastal municipalities over 63. In some cases, these are the main cities and Genoa, that have complex economic structures. In any case, in the other 52 coastal municipalities the index reaches values >1 with peaks of 5. The local specialization index of coastal municipalities is on average 2.1 with respect a value of 1.3 for non-coastal ones (where there are touristic activities influencing the data).
For the sectors identified here as a 'high environmental pressure', Ligu-ria shows a 18.8% of total employment. The coastal municipalities have an average of units lower (17.3%) compared to non-coastal municipalities (about 30%). In addition, the local specialization indices of these sectors in coastal municipalities are very often less than 1 (lack of specialization), with an average of 0.9. Non-coastal municipalities instead, show an average of 1.6 (specialization relative to the region). This would seem to indicate a poor relative importance of these sectors in the economy of the coastal mu-nicipalities.
The overall figure for sectors with high pressure is generally dominated by constructions, which represent the bulk of the overall share in all munic-ipalities (coastal or not), with some tips to 30%, and in only 12 coastal mu-nicipalities represent less than 10 % of total employment.
Finally, in 24 coastal municipalities the local specialization indices are greater than 1. This figure is certainly influenced by the construction sector, where there is widespread specialization in many coastal municipalities. The strong presence of the constructions may be partly related to the tourist activity, which is strong in the coastal municipalities.
Tab. 8 - Comparison between specialization index of sectors related to the sea and sectors with high impact for coastal municipality (if negative: relative specialization in sectors with high pressure), Liguria, 2011.
Coastal Municipality
Index of local special-ization for sectors
depending on sea
Index of local special-ization for sectors with high pressure
Difference between the two index
Genoa 0.79 0.95 -0.15
Average index for coastal municipalities
1.74 1.21 0.53
Average index for
non-coastal municipalities 1.07 1.30 -0.23
Fig. 3 - Local specialization index for "marine" and "high pressure" sectors in the munici-palities of Liguria, 2011.
a) Local specialization index "marine" sectors
b) Local specialization index "high impact"
sec-Table 8 and Figures 3a and 3b show that in many coastal municipalities there is a specialization in ‘marine’ sectors higher than those in ‘high
pres-sure’ sectors. However, for 14 coastal municipalities the situation is re-versed with an index of specialization in the high-pressure sectors that ex-ceeds that in the sectors related to the sea (between these municipalities there are also larger cities as Genoa and La Spezia). Even in the presence of a link between tourism and specialization in construction, a dominant sec-tors among those at ‘high pressure’, many coastal municipalities contempo-rary show an important presence of sectors that depend on the sea and sec-tors not related to the sea but that have high (potential) impacts on envi-ronment (envienvi-ronmental risks) and on the same marine activities.
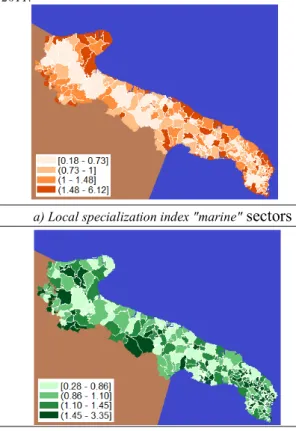
2.3 Apulia
In Apulia, most of coastal municipalities present high shares of em-ployment in sectors linked to the sea. The average of the shares of coastal is around 16%, a much higher value than the one of non-coastal municipali-ties (8.55%). Also in this case, these data are largely controlled by tourism, whose employment shares are very close to the total (with a low variability among coastal municipalities).
The same considerations adopted for the two regions previously ana-lyzed count here and we can therefore conclude that the economic depend-ence on the sea of coastal municipalities is controlled by tourism, both di-rectly and, presumably, as sector of demand of fishing products.
Values for the 'high environmental pressure' sectors are very similar to those of the regions previously analyzed. The percentage of total employ-ment in Apulia is equal to 19.23%. The coastal municipalities have an av-erage share of 19.94% that is lower than non-coastal areas (23.91%). It should be noted, however, that the indices of local specialization of these sectors, in the majority of cases, are less than 1 and the average value of the indexes of localization in coastal municipalities is slightly above this threshold (1.04). Even for Apulia a big impact is due to the construction in-dustry and the manufacture of metal products. We can say that in some cas-es, certain sectors such as construction and the manufacture of metal prod-ucts, have a high index of specialization also in coastal municipalities. Ta-ble 9 and Figures 4a and 4b summarize these results.
Tab. 9 - Comparison between specialization index of sectors related to the sea and sectors with high impact for coastal municipality (Apulia, 2011.
Coastal Municipality
Index of local speciali-zation for sectors
de-pending on sea
Index of local speciali-zation for sectors with
high pressure
Difference be-tween the two
index
Bari 0.89 0.71 0.18
Average index for coastal
municipalities 1.86 1.04 0.82
Average index for non-coastal municipalities
0.99 1.24 -0.25
Fig. 4 - Local specialization index for "marine" and "high pressure" sectors in the munici-palities of Apulia, 2011.
a) Local specialization index "marine" sectors
sec-2.4 Sardinia
In Sardinia, most of coastal municipalities present high shares of em-ployment in the sectors linked to the sea, as we define them here. These shares are often higher than the average regional share (18%) and only in few municipalities it is lower than 10%. The average of the share of the coastal is around 19%, definitely higher than the average for non-coastal ones (11.7%), with a low variability. It is to be noted, still, that, as in the case of Liguria, also these data are largely dominated by tourism, that has employment shares very close to the total (with a low variability among coastal municipalities).
The same considerations adopted for Liguria can be applied to the Sar-dinian case. Summarizing, these data can derive from an underestimation of the effectively employed in the fishing sector and in other sectors linked to the sea (transports). Moreover, sectors such as shipbuilding and maritime transports are present only in some “hub” municipalities, and especially in those with larger dimensions. It is anyhow relevant to note that Sardinia presents local specialization indices, for the sectors depending on the sea, higher than 1 (presence of specialization) in most of municipalities. For 15 municipalities over 70, instead, the local specialization index results to be lower than 1 (lack of specialization). In some cases, these are main cities and Cagliari which have complex economic structures. In any case, the lo-calized specialization index of coastal municipalities is on average 1.74 with respect to 1.07 for non-coastal ones (where some touristic activities are considered, which influence the data). Also for Sardinia we can con-clude that the economic dependence on the sea for coastal municipalities is dominated by tourism, both directly and, presumably, as sector of demand of fishing products, shipbuilding and maritime transports (passengers).
For the sectors identified here as a 'high environmental pressure', Sar-dinia has a share of 21.24% of total employment. In the coastal municipali-ties the average share is slightly lower (25.6%) than non-coastal munici-palities (27.6%). Furthermore, the indices of local specialization of these sectors, in the majority of cases, prove to be higher than 1 (the presence of relative specialization with respect to the region), with an average value equal to 1.21. This value is lower, albeit slightly, the average of the indices of local specialization of non-coastal areas that have a value equal to 1.3. This would seem to indicate a certain relative importance of these sectors in the economy of the coastal. Table 10 and Figures 5a and 5b show the main
Tab. 10 - Comparison between specialization index of sectors related to the sea and sectors with high impact for coastal municipality (if negative: relative specialization in sectors with high pressure), Sardinia 2011.
Coastal Municipality
Index of local speciali-zation for sectors
de-pending on sea
Index of local special-ization for sectors with
high pressure
Difference be-tween the two
index
Cagliari 0.86 0.67 0.19
Average index for coastal
municipalities 1.74 1.21 0.53
Average index for
non-coastal municipalities 1.07 1.30 -0.23
Fig. 5 - Local specialization index for "marine" and "high pressure" sectors in the munici-palities of Sardinia, 2011.
a) Local specialization index "marine"
sec-2.5 The regions of the North Adriatic sea: Emilia-Romagna, Friuli-Venezia Giulia, Veneto
The regions overlooking the North Adriatic Sea, Emilia-Romagna, Friu-li-Venezia Giulia and Veneto have in common some homogeneous charac-teristics that are hereinafter listed. In these regions, most of coastal munici-palities have high shares of employment in sectors linked to the sea and that often result to be higher than the respective regional averages. The averages of the shares of coastal municipalities are in Emilia-Romagna, Friuli-Venezia Giulia and Veneto all very similar among them and respectively 21.4%, 24.8% and 25.5%: these values are largely higher than the respec-tive averages for non-coastal municipalities (between 9% and 13%).
What differs with respect to the comparison with the previous regions is a high variability both at a sectorial level and considering the entirety of the sectors depending on the sea. It has to be noted, indeed, that, differently from previous cases, the regions overlooking the North Adriatic Sea present two highly leading sectors: fishing and tourism. Often, municipalities with a high level of employment in the touristic sector also have a high level of employees in the fishing sector, as already observed before. In this macro-region, by the way, the values linked to the fishing are higher and more var-iable. Furthermore, there are situations in which the fishing covers almost all the employment levels in coastal municipalities, also without any corre-lation with the touristic activities. For example, it is useful to see the case of Goro in Emilia-Romagna where the fishing sector occupies the 64.63% vs the 3% employed in tourism. Another example can be Porto Tolle in Veneto, with percentage of 37.4% in fishing and 6% in tourism. Finally, in Friuli-Venezia Giulia, Marano Lagunare occupies shares of 45% in fishing and 12% in touristic activities.
Even in this case, it is possible to apply some generic considerations: this can derive from an underestimation of the effective employees in fish-ing and other sectors linked to the sea (transports). Moreover, sectors such as shipbuilding and maritime transports are present only in some “hub” municipalities, especially in the larger ones. It is relevant to note that in these regions the local specialization index for those sectors depending on the sea is frequently much higher than 1 (more in detail 2.26 in Emilia-Romagna; 3.06 in Veneto and 2.47 in Friuli-Venezia Giulia) showing a strong localized specialization in sectors linked to the sea. Given this evi-dence, it is therefore possible to conclude that for the regions overlooking
dominated by tourism and fishing, even more than in previous regions, be-cause of a stronger localized pressure on the few coasts available. Tourism, but especially intensive fishing, are sectors with an ambiguous and com-plex relationship with the environment, and we will deal with this in a fu-ture development of this work.
Also for the sectors here identified as with a “high environmental pres-sure”, the North-Adriatic regions, present homogeneous characteristics hereinafter listed. These activities are present in the economy of the North-Adriatic regions with values included between 17.5% in Emilia-Romagna and 18.6% in Friuli-Venezia Giulia of the total number of employees, coastal municipalities present a lower average of shares (between 14.40% of Emilia-Romagna and 17.8% in Veneto) with respect to non-coastal mu-nicipalities (about 25% in all the regions). Moreover, the localized zation indexes of these sectors are very often lower than 1 (lack of speciali-zation), being in average equal to 0.9 in all the regions versus an average for non-coastal municipalities ranging from 1.30 (Veneto) and 1.42 (Emi-lia-Romagna). Tabs 11, 12 and 13 and Fig.6 show that the few coastal mu-nicipalities have a strong specialization in maritime sectors. Instead, it re-sults to be low the specialization in “high-impact” sectors.
Tab. 11 - Comparison between specialization index of sectors related to the sea and sectors with high impact for coastal municipality (if negative: relative specialization in sectors with high pressure), Emilia Romagna 2011.
Coastal Municipality
Index of local speciali-zation for sectors
de-pending on sea'
Index of local special-ization for sectors with high pressure
Difference be-tween the two
index
Rimini 1.75 0.60 1.15
Average index for coastal
municipalities 2.26 0.82 1.44
Average index for
non-coastal municipalities 0.99 1.43 -0.44
Tab. 12 - Comparison between specialization index of sectors related to the sea and sectors with high impact for coastal municipality, Friuli-Venezia Giulia, 2011.
Coastal Municipality
Index of local speciali-zation for sectors
de-pending on sea
Index of local special-ization for sectors with high pressure
Difference be-tween the two
index
Trieste 2.04 0.53 1.50
Average index for coastal
municipalities 2.47 0.88 1.59
Average index for
Tab. 13 - Comparison between specialization index of sectors related to the sea and sectors with high impact for coastal municipality, Veneto, 2011.
Coastal Municipality
Index of local specializa-tion for sectors depending
on sea
Index of local spe-cialization for sec-tors with high
pres-sure
Difference be-tween the two
index
Venice 2.19 0.65 1.55
Average index for coastal
municipalities 3.06 0.97 2.09
Average index for
non-coastal municipalities 1.11 1.30 -0.19
Fig. 6 - Local specialization index for "marine" and "high pressure" sectors in the munici-palities of regions overlooking North Adriatic sea, 2011.
a) Local specialization index "marine" sectors, Emilia Romagna
b) Local specialization index "high impact" sectors, Emilia
c) Local specialization index "marine" sectors, Friuli
d) Local specialization index "high impact" sectors, Friuli
e) Local specialization index "marine" sectors, Veneto
f) Local specialization index "high impact" sectors, Veneto
Conclusion
We show that coastal municipalities seem to attract more importance than non-coastal, however the huge impact on the marine resources in the coastal municipalities might be considered in a double way. First, ‘marine’ sectors play a key role in the wealth and in the economy of the country. Second, ‘high impact’ sectors put a high pressure on the coastal environ-ment that might influence the ‘marine’ sectors both in term of use of marine resources that lower touristic potential. Our study shows that in some re-gions the two groups of sectors coexist and then particular attention have to be devoted in regulating the exploitation and use of marine resources in or-der to have a positive economic balance between all sectors.
Acknowledgments
The research described in this paper was supported by the Project “Ban-diera (Flagship) RITMARE - La Ricerca Italiana per il Mare (The Italian Research for the Sea)” coordinated by the National Research Council of Italy and funded by the Italian Ministry for Education, University and Re-search, under the National Research Program 2011-2013.
References
Arto I., Genty A., Rueda-Cantuche J.M., Villanueva A., Andreoni V., 2012, Global Resources Use and Pollution, Volume 1: Production, Consumption and Trade (1995-2008); Volume 2: Country Factsheets, JRC Seville.
Barzotto, M., Corò, G., & Volpe, M. (2014). Apertura internazionale e risorse eco-nomiche locali. Un’indagine sul radicamento territoriale di imprese multinazio-nali. Argomenti.
Bowen R.E., Riley C., 2003, Socio–economic Indicators and integrated coastal management, Ocean & Coastal Management, 46: 299–312
Cantasano, N., Pellicone, G., 2014. Marine and river environments: A pattern of Integrated Coastal Zone Management (ICZM) in Calabria (Southern Italy). Ocean & Coastal Management, 89: 71–78
EEA, 2013, Environmental pressures from European consumption and production. A study in integrated environmental and economic analysis, Technical Report 2/2013, European Environment Agency, Copenhagen.
Fadda, S. (2016). Labour coefficients reduction and working time reduction. Ar-gomenti, (4), 67–87
Guarascio, D., Fana, M., Cirillo, V. (2017). La crisi e le riforme del mercato del lavoro in Italia: un’analisi regionale del Jobs Act. Argomenti, (5), 29–56. Lucchese, M., Nascia, L., Pianta, M. (2016). Una politica industriale e tecnologica
per l’Italia. Argomenti, (4), 25–50.
Marin, G., Mazzanti, M. (2013). The evolution of environmental and labor produc-tivity dynamics. Journal of evolutionary economics, 23(2): 357–399
Marin, G., Modica, M. (2017). Socio-economic exposure to natural disasters. Envi-ronmental Impact Assessment Review, 64, 57–66.
Marra, C., Turcio, S. (2016). Insider e outsider nel mercato del lavoro italiano. Ar-gomenti, (4), 89–134.
Mazzanti M., Zoboli R. (2009). Environmental efficiency and labour productivity: Trade-off or joint dynamics? A theoretical investigation and empirical evidence from Italy using NAMEA. Ecological Economics, 68: 1182–1194.
Mazzanti M., Montini A., Marin G., 2012, Aggregation biases in environmental extended input output: evidence from Italy and Spain, Ecological Economics, 74: 71–84.
Mazzanti M., Paleari S., Zoboli R., 2007, Effectiveness of environmental taxes and charges for managing sand, gravel and rock extraction in selected EU countries: Italy, ETC/RWM working paper 2007/4 European Topic Centre on Resource and Waste Management, Copenhagen
Meroni, F., Pessina, V., Squarcina, T., Locati, M., Modica, M., Zoboli, R. (2016, June). The economic assessment of seismic damage: an example for the 2012 event in Northern Italy. In International Conference on Urban Risk.
Modica, M., Reggiani, A. (2014, November). An alternative interpretation of re-gional resilience: evidence from Italy. In ERSA conference papers (No. er-sa14p369). European Regional Science Association
Modica, M., Reggiani, A. (2015). Spatial economic resilience: overview and per-spectives. Networks and Spatial Economics, 15(2), 211–233
Modica, M., Zoboli, R., Meroni, F., Pessina, V., Squarcina, T., Locati, M. (2016). Housing Market Response to 2012 Northern Italy Earthquake: The role of house quality and changing risk perception. Seeds-Sustainability WP Series, (4) Moll S., Vrgoc M., Watson D., Femia A., Pedersen O., Villanueva A., 2007, Envi-ronmental Input-Output Analyses based on NAMEA data. A comparative Eu-ropean study on environmental pressures arising from consumption and produc-tion patterns, ETC/RWM working paper 2007/2, European Topic Centre on Resource and Waste Management, Copenhagen.
Niavis, S., Papatheochari, T., Kyratsoulis, T., Coccossis, H. (2017). Revealing the potential of maritime transport for ‘Blue Economy’in the Adriatic-Ionian Re-gion.Case Studies on Transport Policy, 5(2): 380–388.
Olsen, S.B., 2003, Frameworks and indicators for assessing progress in integrated coastal management initiatives. Ocean & Coastal Management, 46: 347–361 Sterlacchini, S., Zazzeri, M., Genovese, E., Modica, M., Zoboli, R. (2016, April).
Flood damage in Italy: towards an assessment model of reconstruction costs. In EGU General Assembly Conference Abstracts (Vol. 18, p. 13135).
Turner, R.K., 2000, Integrating natural and socio-economic science in coastal management. Journal of marine Systems, 25(3-4): 447–460.