Ametantrone-based compounds as potential regulators of Tau pre-mRNA
alternative splicing
Gerard Artigas,a Paula López-Senín,a Carlos González,b Núria Escaja,a and Vicente Marchán*a
a
Departament de Química Orgànica and IBUB Universitat de Barcelona
Martí i Franquès 1-11, E-08028 Barcelona (Spain) Fax: (+) (34) 93 339 7878
E-mail: [email protected]
b
Instituto de Química Física Rocasolano CSIC
Serrano 119, E-28006 Madrid (Spain)
ABSTRACT
Tau pre-mRNA contains a stem-loop structure involved in the r gulation of the alternative splicing of tau protein. We describe here a new family of Tau RNA ligands selected by dynamic combinatorial chemistry based on the combination of ametantrone with small RNA-binding molecules. The most promising compound results from derivatization of one of the side chains of the anthraquinone ring with the small aminoglycoside neamine
through a short spacer. This compound binds the RNA target with high affinity in a
preferred binding site, in which the heteroaromatic moiety intercalates in the bulged region of the stem-loop and its side chains and neamine interact with the major groove of the RNA. Importantly, binding of this compound to mutated RNA sequences involved in the
onset of some tauopathies such as FTDP-17 restores their thermodynamic stability to a similar or even higher levels than that of the wild-type sequence, thereby revealing its potential as a modulator of Tau pre-mRNA splicing.
INTRODUCTION
RNA molecules, not only mRNAs or pre-mRNAs but also the wide variety of non-coding RNAs (e.g. miRNAs or their pre-miRNA precursors), are therapeutically relevant targets in medicinal chemistry.1 Like proteins, RNA folds local secondary structures (e.g. stem-loops, bulges, internal loops, etc.) into complex three-dimensional architectures, generating unique binding sites where small molecules can be accomodated.2 Owing to the ubiquity of
RNA-mediated biological processes, targeting therapeutically relevant RNA sequences with small molecules offers new opportunities to control RNA function and, for instance, to treat human diseases.3 Despite the progress made in recent years, the discovery of ligands
with high affinity and sequence selectivity for a given RNA target and with desirable drug-like properties, still remains a challenge. This is mainly a consequence of our poor
understanding of RNA-ligand recognition principles which hinders the rational design of new compounds based on structural studies.3b,4
The microtubule-associated protein tau is required for the polymerization and stability of microtubules, as well as for maintaining neuronal integrity and axonal transport. Neuronal filamentous deposits of this protein have been found in patients suffering from
neurodegenerative diseases, including Alzheimer’s disease and some tauopathies.5 Alternative splicing of exons 2, 3, and 10 of the MAPT gene, which encodes for tau
protein, gives rise to six isoforms with either three (3R) or four (4R) repeat domains, which differ in their relative ability to bind to microtubules. In general, the relative ratio of 4R to 3R is close to one in healthy adult human brains. However, this ratio is found altered in many tauopathies. The importance of a well-defined stem-loop structure located at the exon 10-5’ intron junction of Tau pre-mRNA as a regulatory element of alternative splicing has been established both in vitro and in vivo.6 Such studies revealed that the extent of exon 10
inclusion is inversely proportional to the stability of this local secondary structure. Some intronic mutations (named +3, +13, +14 and +16 in Scheme 1) found in patients with tauopathies, such as frontotemporal dementia with parkinsonism linked to chromosome 17 (FTDP-17), decrease the stem-loop thermodynamic stability,7 leading to an increase in exon 10 inclusion and an overproduction of 4R tau isoforms compared to the 3R isoforms.6,7
From a therapeutic point of view, it has been hypothesized that ligands that target the RNA secondary structure located at the exon 10-5’ intron junction of Tau pre-mRNA would have the capacity to restore the physiological balance of tau isoforms generated upon abnormal alternative splicing by increasing the thermodynamic stability of the mutated sequences. Moreover, such compounds would allow to study how local secondary RNA structures can influence the outcome of pre-mRNA splicing.8 In recent years, several ligands able to bind and stabilize wild type and mutated Tau stem-loop structure have been reported. Varani and collaborators described the three-dimensional structure of the RNA complex with the aminoglycoside neomycin B.9 More recently, the anticancer drug mitoxantrone (Mtx in Scheme 1) was identified by Wolfe and collaborators in a high-throughput screening as a promising ligand.10 Subsequent NMR structural studies of the complex of mitoxantrone with Tau RNA revealed that the anthraquinone ring of this drug intercalates between the two G:C base pairs flanking the bulged adenine.11 In addition, the evaluation of the binding to Tau RNA and the stabilization capacity of a series of mitoxantrone analogues allowed to establish structure-activity relationships.12
In previous works,13 we used dynamic combinatorial chemistry (DCC)14 to identify a series of ligands that bind the Tau stem-loop structure with high to medium affinities, showing the desired ability to stabilize both wt and mutant RNA sequences upon binding. The most
promising RNA-templated ligands combined planar heteroaromatic rings such as acridine with neamine (Acr-Nea/Nea2 in Scheme 1B),13a a small aminoglycoside that incorporates rings I and II of neomycin, which are important structural motifs in RNA recognition. Guanidinylation of the neamine moiety had an important effect, improving not only the binding affinity of the ligands, but also their ability to stabilize the mutated sequences.13b Biophysical studies showed that these ligands interact with RNA via intercalation of the acridine moiety, probably at the bulged region of the stem-loop structure, and that the combination with the aminoglycoside improves RNA binding properties of the heteroaromatic moiety.13
On the basis of all these precedents, we wondered whether replacement of acridine by mitoxantrone in acridine-neamine compounds would lead to Tau pre-mRNA ligands with enhanced RNA-binding properties and, more importantly, if ligands incorporating this anthraquinone moiety would maintain the preferred binding site of mitoxantrone at the bulged region of the stem-loop structure of Tau RNA. According to the reported structural data,11 the phenolic hydroxyl groups of mitoxantrone do not seem to have an important function in the recognition of Tau RNA.11,12 Consequently, instead of mitoxantrone, we
selected ametantrone, an anthraquinone analogue (Amt in Scheme 1) with a proven lower cytotoxicity in eukaryotic cells.15 Since both side chains of mitoxantrone play an important role in the recognition of the stem-loop structure, in particular the ammonium functions,11 we planned to use the end of one of the side chains of ametantrone as a derivatization point to attach the aminoglycoside moiety. Hence, we report here new Tau RNA ligands based on the derivatization of ametantrone with small RNA binding molecules (azaquinolone and neamine) (Scheme 1C), together with several spectroscopic studies (UV-Vis, fluorescence and NMR) on their interaction with the RNA target.
Scheme 1 (A) Sequences and secondary structure of wild-type (wt) and +3, +13, +14 and +16
mutated Tau stem-loop RNAs. Exonic sequences are shown in capital letters and intronic sequences in lower case. Nucleotides involved in base pairs, previously identified by NMR, are connected by a dash.6a,11 When required, biotin or fluorescein derivatization was performed at the 5’ end. The ends of the chains were modified with 2’-O-methylribonucleosides (denoted by an asterisk). (B)
Structure of mitoxantrone, ametantrone and acridine-neamine ligands.13a (C) Schematic representation of the derivatization of ametantrone through one of the side chains of the anthraquinone ring.
RESULTS AND DISCUSSION Selection of Tau RNA ligands
In general, there is good correlation between the ligand’s amplification in dynamic combinatorial chemistry experiments and its binding affinity for a given biological target, either a nucleic acid (DNA or RNA) or a protein.14 Hence, prior to synthesizing
ametantrone-neamine ligands, we planned to carry out a DCC experiment to validate our hypothesis by using thiol-derivatized building blocks. Ligand’s amplification might
provide, in addition, valuable information about the optimal length of the spacer linking the two moieties. For this purpose, compounds with different distances between the reactive functional group and the building block core, such as the two neamine monomers shown in Fig. 1A, have been tested.
To perform DCC experiments by using thiol-disulfide exchange reactions, a suitably-modified ametantrone monomer, Amt-SH (Scheme 2), was required. We decided to replace the hydroxyl group of one of the side chains of ametantrone by a thiol group since this small modification was expected not to disturb the interaction with RNA. Ametantrone (Amt) was first synthesized following a reported procedure by reacting
1,4-difluoroanthraquinone with an excess of N-(2-hydroxyethyl)ethylenediamine.16 After selective Boc-protection of the secondary alkyl amino functions, Mitsunobu reaction of 1 with DIAD, PPh3 and thiolacetic acid afforded the thioacetate derivative (2) as a major product. Finally, Amt-SH was obtained after hydrolysis of the thioester group with sodium methoxide followed by an acidic treatment with TFA in the presence of TIS and water as scavengers to remove the Boc protecting groups.
Scheme 2 Synthesis of the thiol-derivatized ametantrone monomer (Amt-SH).
The DCC experiment was carried out as previously reported.13a Briefly, the
thiol-derivatized monomers (Amt-SH, Acr-SH, Nea-SH, Nea2-SH, Azq-SH and TyrP-SH; see Fig. 1A for their structures) were incubated with the biotinylated wt Tau RNA in aqueous Tris–HCl buffer (50 mM, pH 7.7) containing NaCl (100 mM) and EDTA (0.1 mM) at room temperature, under an air atmosphere without stirring. These conditions ensure the correct folding of the RNA target as well as the thiol-disulfide exchange (21 theoretical compounds may be formed). After isolation of RNA and its interacting ligands with streptavidin
anchored to magnetic beads, a hot acidic aqueous solution was used to denature it and to provoke the release of RNA-bound ligands. All the compounds were identified and quantified by UV-MS-HPLC (see Fig. 1B). The comparison with the control experiment (RNA free) allowed the determination of the % of amplification of the compounds in the presence of Tau RNA. As shown in Fig. 1C, disulfide heterodimers incorporating the ametantrone fragment were amplified in much higher ratio than those containing the acridine fragment, particularly when this heteroaromatic compound was combined with the neamine monomer: Amt-Nea (≈1600%) and Amt-Nea2 (≈3500%) vs Acr-Nea (≈50%) and Acr-Nea2 (≈150%) (see Fig. 1D and Scheme 1, respectively, for their structures). This
O O HN HN H N OH N H SH Amt-SH O F F H2N H N OH pyridine, 72 h O O HN HN H N OH N H OH Boc2O Na2CO3 dioxane/H2O 2:1 48% (2 steps) O O HN HN Boc N OH N Boc OH 1) PPh3, DIAD, 0ºC, 30 min 2) 1, 0ºC, 30 min 3) AcSH, 0ºC-RT, 17 h THF, Ar 1 O O HN HN Boc N OH N Boc SAc 2 Amt 1) MeONa/MeOH 1 h 2) TFA/TIS/H2O 95:2.5:2.5 30 min, RT 36% 12% Ar 3) DTT, H2O O
clearly indicated that ametantrone-containing ligands should have much higher binding affinity than those containing acridine.13a Interestingly, the amplification of Amt-Nea2 was about 2.2-fold higher than that of Amt-Nea. This result reproduced the tendency previously found for Acr-Nea/Nea2 ligands, indicating that a shortest distance between the
heteroaromatic fragment (acridine or ametantrone) and the small aminoglycoside neamine is preferred in this family of Tau RNA ligands.
On the basis of DCC results, we planned the synthesis of the Amt-Nea and Amt-Nea2 ligands at higher scale to study their interaction with Tau RNA. Although Amt-Azq (Fig. 1D) was amplified in a much lesser extent (≈200%) than ametantrone-neamine compounds, it was also selected because of the potential of the azaquinolone fragment to recognize the bulged adenine in the stem-loop.13a The synthesis of Amt-Nea/Nea2 and Amt-Azq was carried out in solution in a two-step process. First, one of the thiol-containing monomer (Nea/Nea2-SH or Azq-SH) was activated with 2,2’-dithiobis(5-nitropyridine) (DTNP) in a slightly acidic media.17 After reaction of the intermediates with the ametantrone-thiol monomer (Amt-SH), the expected disulfide heterodimers were isolated by reversed-phase HPLC (yields 33–55%), and fully characterized by MS and NMR.
Fig. 1 Results of a DCC experiment involving 5’-biotinylated wt Tau RNA and the Amt, Acr, Nea,
Nea2, Azq and TyrP thiol-derivatized monomers. (A) Structure and peptide sequence of the building blocks. (B) HPLC traces showing the composition of the DCL in the absence (left) and presence (right) of RNA, after 48 h. (C) Histograms showing the changes in the DCL composition
A zq -N e a A zq -T y rP A m t-N e a 2 A m t-N e a A m t-A m t A m t-A z q A m t-T y rP A cr 2 -N e a A cr 2 -N e a 2 A cr 2 -T y rP A cr 2 -A m t A cr 2 -A z q A cr 2 -A cr 2 A zq -N e a A zq -T y rP A m t-N e a 2 A m t-N e a A m t-A m t A m t-A z q A cr 2 -N e a A cr 2 -N e a 2 A cr 2 -T y rP A cr 2 -A m t A cr 2 -A z q A cr 2 -A cr 2 A m t-T y rP 0 5 10 15 20 25 30 Acr 2-Acr 2 Acr 2-Azq Acr 2-TyrP Acr2 -Am t Amt-A zq Am t-Am t Az q-Azq Acr 2-Nea Amt-T yrP Acr 2-N ea2 Am t-Nea Azq -Tyr P Azq -Nea Amt-N ea2 Azq -Nea 2 No RNA RNA -100 400 900 1400 1900 2400 2900 3400 Acr 2-Acr 2 Acr 2-Azq Acr 2-Ty rP Acr 2-A mt Am t-Azq Am t-Am t Azq -Azq Acr 2-N ea Am t-Tyr P Acr 2-Nea 2 Am t-Nea Azq -Tyr P Azq -Nea Am t-Nea 2 Azq -Nea 2 Effect of RNA 48 h % M o l % C h a n g e O O HN HN H N OH N H S O O NH2 HO HO H2N H2N O NH2 OH S n n=0 Amt-Nea2 n=4 Amt-Nea O O HN HN H N OH N H S S N H NH O N HN O Amt-Azq D 1 2 3 4 5 6 7 8 9 101112 13 14 15 16 171819 20
(left) and the percentage changes (% amplification) of each species (right) in the presence of wt Tau RNA. (D) Structure of the selected ligands in the DCC experiment.
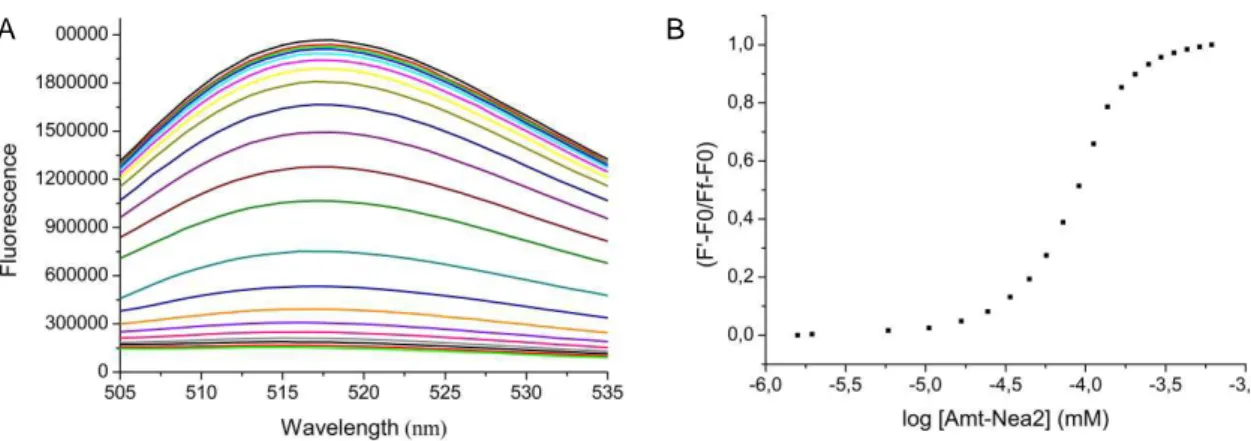
In order to validate the results from the DCC experiment, the binding affinities of the selected ligands (Amt-Nea/Nea2 and Amt-Azq) for Tau RNA were determined by fluorescence titration experiments by using the 5’-end fluorescein-labelled
oligoribonucleotide.14e As shown in Fig. 2A, the fluorescence of RNA was quenched upon addition of increasing concentrations of the ligand. A characteristic dose-dependent curve was obtained when the normalized fluorescence intensity at 517 nm was plotted versus of the compound concentrations. In all cases, the full titration was repeated in the absence of RNA to subtract the inherent fluorescence of the ligands from that of the labelled RNA. EC50 values, which can be assimilated to dissociation constants, were obtained by fitting
the data to a sigmoidal dose-response curve (Fig. 2B).
Fig. 2 (A) Fluorescence quenching of wt Tau RNA labelled with fluorescein upon addition of
increasing concentrations of Amt-Nea2. Experimental conditions: [RNA] = 25 nM and [ligand] = 0 to 614 nM, in 10 mM sodium phosphate buffer pH 6.8, 100 mM NaCl and 0.1 mM Na2EDTA. (B)
Plot of the normalized fluorescence signal at 517 nm against the log of the ligand concentration.
The normalized fluorescence was calculated by dividing the difference between the observed fluorescence, F’, and the initial fluorescence, F0, by the difference between the final fluorescence,
Ff, and the initial fluorescence, F0. Hence, absolute values of the fluorescence changes upon ligand
titration are shown.
Table 1 Binding of the ligands to wt RNA in the absence or in the presence of a tRNA competitor.
Ligand EC50 (nM)a EC50 (nM) +tRNAb EC50+tRNA / EC50 Neamine 3.1x10⁶ nd nd Mitoxantrone 168.8 + 6.2 803.3 4.8 Ametantrone 231.8 + 8.0 675.6 2.9 Amt-Azq 162.5 + 5.7 570.7 3.1 Amt-Nea 78.8 + 6.1 714.2 9.1 Amt-Nea2 70.6 + 7.2 569.8 8.1 a
Fluorescence measurements were performed in 10 mM sodium phosphate buffer pH 6.8, 100 mM NaCl and 0.1 mM Na2EDTA, with a [RNA] = 25 nM.
b
Measured in the presence of a 30-fold nucleotide excess of a mixture of tRNA (tRNAmix).
The EC50 values of the ametantrone-containing ligands together with those of ametantrone,
mitoxantrone and neamine are shown in Table 1. In good agreement with DCC results, the most amplified compounds exhibited the highest binding affinities. Indeed, ligands
containing the ametantrone fragment showed EC50 values that fall into the nanomolar scale
(EC50=78.8 and 70.6 nM for Amt-Nea and Amt-Nea2, respectively). It is also noticeable that ametantrone-neamine ligands bind Tau RNA much stronger than any of their components alone (see the neamine and ametantrone entries in Table 1), which indicates that the derivatization of one of the ametantrone side chains with a polycationic
aminoglycoside has a positive effect on binding affinity. Moreover, the binding was observed to be approximately two times stronger for Amt-Nea/Nea2 ligands than for mitoxantrone or Amt-Azq. Interestingly, a correlation was observed between the binding affinity and the linker length: the binding of Amt-Nea2 was slightly higher than that of the analogous compound with the longer spacer linking the ametantrone and neamine moieties (Amt-Nea). This is consistent with % amplification in DCC and with previous studies on Acr-Nea/Nea2 ligands.13a
One of the main problems of RNA ligands based on small molecules is the achievement of sequence selectivity, sometimes referred to as specificity.18 This is because the relatively low cellular expression level of disease-associated RNAs in comparison with ribosomal RNAs, which represent about 80–90% of the total RNA content of living cells.19 Hence, the ratio between the EC50 values in the presence and in the absence of large excess of tRNAmix from baker’s yeast might provide an idea of the specificity of the ligand. As shown in Table 1, ametantrone was found to be slightly more specific for Tau RNA than mitoxantrone. This result together with its reported low cytotoxicity15 supports the initial choice of ametantrone instead of mitoxantrone for developing new Tau RNA ligands. As expected, the combination of ametantrone with neamine afforded less specific ligands than the combination with azaquinolone. In the presence of the competitor, the EC50 values of Amt-Nea and Amt-Amt-Nea2 for wt RNA were increased by 9-fold and 8-fold, respectively, whereas that of Amt-Azq was only increased by 3-fold. Interestingly, the specificity of the
ametantrone-neamine ligands was significantly higher than that previously found for acridine-neamine ligands, particularly in the case of the compound containing the shorter linker. Comparison of specificity ratios for Amt-Nea and Amt-Nea2 indicates that a shorter
spacer provides a slightly higher specificity. This trend is similar to that previously reported by Tor et al.18b with ligands for the HIV-1 RRE RNA target based on the combination of acridine with neomycin, but differs from that we found with Acr-neamine ligands.13a The
overall results indicated that ametantrone not only generates ligands with higher affinity for Tau RNA than acridine upon combination with neamine, but that this anthraquinone
derivative confers higher specificity on them, particularly when comparing ligands with the shortest spacer.
Spectroscopic studies on the interaction of Amt-containing ligands with Tau RNA Our next objective was focused on the study of the interaction of ametantrone-containing ligands with Tau RNA by using several spectroscopic techniques (UV-Vis, fluorescence and NMR) in order to assess if this new family of compounds have a preferred binding site in the target. As previously stated for mitoxantrone, the presence of a bulged region in Tau RNA, where adenine is flanked by two G:C pairs, facilitates the intercalation of the
anthraquinone ring, causing the displacement of the bulged adenine and the establishment of sequence-specific contacts between the positively-charged side chains and the RNA nucleobases and phosphate groups.11
First, the UV-visible absorption spectra and the fluorescence emission spectra (upon excitation at 547 nm) were recorded for all the compounds (Amt, Azq and Amt-Nea/Nea2, see Fig. 3 and Fig. S2-S3 in the Supplementary Information) in the absence and in the presence of increasing amounts of wt Tau RNA. As expected, strong hypochromic and bathochromic effects were observed in the UV-Vis spectra during the titration, which are consistent with binding of the heteroaromatic moiety through an intercalative
mechanism. The intensity of the two bands in the 450-700 nm region decreased gradually until saturation was reached (about 3.9 mol equiv. of RNA), with two maxima at 594 and 642 nm (overall redshift of 12 and 16 nm, respectively). A similar behaviour was found with Amt-Azq and Amt-Nea/Nea2, although the hypochromic and batochromic effects were slightly more pronounced. Fluorescence titration experiments reproduced these results, although the quenching of the fluorescence was slightly higher for the ligands with smaller EC50 values, showing a parallelism with the binding affinity.
Although these results are consistent with the intercalation of the anthraquinone chromophore in Tau RNA, the comparison with the behaviour previously reported for mitoxantrone11 and some acridine-containing ligands13a seems to suggest some differences in their binding mode. This might be attributed to a higher affinity for a specific and well-defined binding site in the Tau RNA structure. As a consequence, these ligands would be allocated at their preferred binding site in the complex at a lower RNA/ligand ratio. More detailed information on the mode of interaction of ametantrone-containing ligands was obtained by NMR spectroscopy.20
Fig. 3 UV-Vis spectra (A) and fluorescence emission spectra (B) of Amt-Nea2 in the absence and in
the presence of increasing amounts of wt RNA in a 10 mM sodium phosphate buffer, pH 6.8, containing 100 mM NaCl and 0.1 mM Na2EDTA. 8.4 µM and 2 µM solutions of Amt-Nea2 were
used in UV-Vis and fluorescence titration experiments, respectively. The emission spectra were recorded from 600 ~ 850 nm with λex = 547 nm.
Titration experiments of the ligands (Amt, Amt-Azq and Amt-Nea/Nea2) with Tau RNA were monitored by NMR (see Fig. 4A and Fig. S4-S5 in the Supplementary Information). Addition of Amt or Amt-Azq caused a general line broadening of all RNA signals, in particular those close to the bulged adenine (U0 and G-1). In contrast, titration with Amt-Nea or Amt-Amt-Nea2 provoked very little line broadening, even in excess of ligand (Fig. 4 and S5). This different behaviour, and the observation of only one set of signals at 1:1 complex conditions, suggests that Amt-Nea/Nea2 bind to the target in a more defined binding site than the other compounds. As can be seen in Fig. 4A, at a RNA:Amt-Nea2 ratio of 1:0.5, different imino signals arising from the free and bound RNA could be observed. This indicates that both species are in slow equilibrium in the NMR time scale. 2D NMR experiments were carried out with the 1:1 complex Amt-Nea2:RNA. Provided the RNA concentration does not exceed 300 µM to avoid aggregation of the oligoribonucleotide, the resulting 2D spectra of Tau RNA and of the complex with the ligand were of sufficient quality to proceed with a more in-depth structural analysis. Some preliminary assignments could be obtained with standard 1H experiments (NOESY, TOCSY and DQF-COSY), facilitated by previous assignments on Tau RNA and Mtx-Tau RNA complex reported by Varani’s group.6a,11 To identify the region of the stem-loop structure more affected by the ligand, the exchangeable proton region was first examined since exhibits a favourable chemical shift dispersion (Fig. 4 and S6). Upon complex formation, the most pronounced changes in chemical shifts involved imino protons of G-1 and U0, which were shifted by – 0.88 and 0.36 ppm, respectively, compared with their values in the free RNA. In contrast,
imino signals of G+1 (∆δ= +0.1 ppm), U+2 (∆δ= +0.05 ppm) and G+3 (∆δ= –0.03 ppm) were not significantly affected in the complex. The imino proton signals of U+11 and G+5 were rather broad in the free RNA and were not clearly detected in the complex.
Interestingly, a new imino signal at 12.50 ppm appeared in the complex, which was assigned to G+17. This suggest that C-3:G+17 base pair is probably more dynamic and exposed to the solvent in the isolated RNA than in the complex with Amt-Nea2.
Fig. 4 (A) Imino region of the NMR spectra of wt Tau RNA alone and in the presence of increasing
amounts of Amt-Nea2. From bottom to top: ligand/RNA ratio = 0.0, 0.5, 1.0, 1.5 and 2.0.
Assignments in gray are labelled according to Varani et al.11 Experimental conditions: [RNA]= 100
of the NOESY spectrum (tm=100 ms) of the 1:1 complex Amt-Nea2:wt Tau RNA in H2O/D2O 9:1
in 10 mM phosphate buffer, pH=6.8, T=5ºC. [Tau RNA]= 280 µM. RNA and Amt-Nea2 proton signals are labelled according to the numbering schemes shown in Scheme 1 and Fig. 1D, respectively.
Regarding the ligand, some diagnostic signals were also easily distinguished in the NMR spectra of the complex. As shown in Fig. 4, two signals in the exchangeable proton region (δ = 9.92 and 9.52 ppm) corresponding to the amino protons NH(11) and NH(18) (see Fig. 1D for numbering) of the two side chains of the ametantrone moiety of the ligand were clearly observed. The two amino signals show numerous cross-peaks with other protons of the ligand (aromatic protons H2 and H3 and methylene protons of the side chains) and, importantly, with some exchangeable and non-exchangeable protons of RNA. A number of key intermolecular cross-peaks could be assigned:
NH(18)Amt-H2Amt/H3Amt/H41C+16/H42C+16/H8G+17/H1G+17, NH(11)-H2Amt/H3Amt/H8G-1 and H41C+16-H2Amt/H3Amt (Fig. 4B and S6 in the Supplementary Information). In addition, numerous cross-peaks between the Amt-Nea2 side chains protons and the
aromatic protons of the RNA were observed (Fig. S7). Although at this stage the sequential assignment of the later ones is still ambiguous, these contacts indicate that the side chains interact with the RNA through the major groove. Most neamine protons are in the 3.3–4.1 ppm region, but no intermolecular NOEs with the RNA could be found. However, the sign and intensity of NOE cross-peaks between neamine protons indicates that this moiety maintains the same correlation time than the rest of the complex, and is not dangling independently. Most probably, the neamine interacts mainly with the ribose-phosphate
backbone of the RNA, given rise to intermolecular cross-peaks that lie in very crowded regions of the NOESY spectra.
In summary, NMR data are consistent with a mode of interaction in which the ametantrone moiety of the ligand interacts with the bulged region of the RNA stem-loop structure, most probably occupying the same site than mitoxantrone.11 The structural determination of the complex Tau RNA:Amt-Nea2 is out of the scope of this work, since it requires a complete resonance assignment and the extraction of a full set of distance constraints, only possible with isotopic-labelling (13C, 15N and probably partial deuteration of riboses). Such study is now in progress and it will be presented in due course. However, a feasible model of the complex can be spotted on the basis of the previously reported complex between Tau RNA and mitoxantrone,11 and the experimental information obtained here (Fig. 5 and S8). In this model, the anthraquinone ring is intercalated between G(–1):C(+16) and C(–3):G(+17) base pairs, and the two side chains of ametantrone and the neamine moiety lie into the major groove of the double helical segment. The extensive contacts between the side chains of Amt and the spacer with the RNA probably contribute to the enhanced binding affinity of this ligand for Tau RNA and favour the formation of a unique complex in contrast to that observed for the complex with mitoxantrone.11
Fig. 5 Model of the 1:1 complex Tau RNA:AmtNea2. Coordinates for the Tau RNA:Mtx complex
determined by Varani et al.11 were used to build the model, as described in the Experimental Section.
As an additional check of the preference of ametantrone-neamine ligands for the Tau RNA bulged region, we explored the interaction of this ligand with two variants of the A-site RNA fragment: the native sequence, which contains an internal bulged region where aminoglycosides can be accommodated, and a mutant sequence lacking the internal bulged adenine. As shown in Fig. S13 (see the Supporting Information), the imino region of the NMR spectra of either the A-site sequence or its mutant analogue did not change
significantly in the presence of increasing amounts of Amt-Nea ligands (up to 1.5 mol equiv.). Moreover, no signals from the ametantrone side chain amino groups were observed in the exchangeable proton region of these spectra. These results clearly differ from those obtained with Tau RNA (see Fig. 3), supporting our conclusion that the bulged region of Tau RNA is a preferred binding site for the Amt-Nea ligands described in this study.
Effect of Amt-containing ligands on the thermal stability of Tau RNA mutated sequences
Once established that the derivatization of ametantrone with neamine generates ligands for Tau RNA with high binding affinity and a clear preference for the bulged region of the stem-loop structure, we focused on the evaluation of the impact of these compounds on the thermal stability of Tau RNA by UV-monitored melting experiments.14e As previously
stated, effective ligands for Tau RNA are expected to reverse the destabilization of the stem-loop structure caused by mutations associated with FTDP-17. The +3, +14 and +16 mutated sequences (see Scheme 1) were considered in this study since they cause a significant destabilization with respect to the wt sequence (–15 ºC, –13 ºC and –7 ºC, respectively). As shown in Table 2 and Fig. S9-S12 (see the Supplementary Information), the ∆Tm values for the RNA sequences in the presence of ametantrone were lower (about 2ºC) than those found for mitoxantrone, which is consistent with its lower binding affinity (see Table 1). Regarding the three ametantrone-containing ligands selected in our study, all of them had a positive effect on the thermal stability of all RNAs, particularly when the anthraquinone derivative was combined with neamine. This stabilization is substantially higher than that obtained with neamine or ametantrone alone (see Table 2), which supports the participation of both moieties in the interaction with the target. Interestingly, the stabilizing effect of the ametantrone-neamine ligands was considerably higher than that of mitoxantrone (e.g. the ∆Tm values for the +3 and +14 mutated sequences in the presence of 1 mol equivalent of mitoxantrone were +5.7 ºC and +4.6 ºC, respectively, whereas in the presence of the same amount of Amt-Nea2, the ∆Tm values were +12.9 ºC and +10.4 ºC, respectively). Moreover, the RNA stabilization caused by ametantrone-neamine ligands
was much higher than that of our previous ligands based on the combination of acridine with neamine.13a As shown in Table 2, the Tm value of wt Tau RNA was clearly increased in the presence of the ametantrone-neamine ligand with the shortest spacer (∆Tm=+8.9 ºC for Amt-Nea2 vs ∆Tm=+6.4 ºC for Amt-Nea). This tendency was also reproduced in the case of the mutated sequences and is in good agreement with previous results with acridine-neamine ligands where a correlation between the ligand’s binding affinity for Tau mutants and thermal stabilization was found.13a
Table 2 Melting temperatures (Tm, ºC) for the complexation of the ligands with Tau RNAs (1 µM
both in RNA and in ligands in 10 mM sodium phosphate buffer, pH 6.8, 100 mM NaCl and 0.1 mM Na2EDTA). Tmwt ∆Tma Tm+3 ∆Tma Tm+14 ∆Tma Tm+16 ∆Tma No ligand 66.5+0.1 - 51.4+0.3 - 53.5+0.3 - 59.6+0.2 Neamine 66.9+0.3 +0.4 51.5+0.5 +0.1 54.0+0.4 +0.5 60.1+0.3 +0.5 Mitoxantrone 69.2+0.4 +2.7 57.1+0.5 +5.7 58.1+0.4 +4.6 63.4+0.6 +3.8 Ametantrone 67.1+0.3 +0.5 54.2+0.5 +2.8 55.7+0.6 +2.2 61.6+0.4 +2.0 Amt-Azq 67.8+0.6 +1.3 56.1+0.6 +4.7 57.3+0.3 +3.8 61.8+0.4 +2.2 Amt-Nea 72.9+0.2 +6.4 60.7+0.4 +9.3 60.7+0.6 +7.2 66.5+0.5 +6.9 Amt-Nea2 75.4+0.4 +8.9 64.3+0.5 +12.9 63.9+0.5 +10.4 69.4+0.4 +9.8 a∆T
m= (Tm of the RNA in the presence of ligand) – (Tm of RNA alone).
Since the stability of RNA depends on the ionic strength and the most promising ligands (Amt-Nea/Nea2) are positively charged at physiological pH, we examined the influence of sodium ion concentration on the thermal stability of the target in the presence of these compounds.21 Melting curves of the most destabilized sequence, the +3 mutated RNA, were
recorded at two NaCl concentrations (50 mM and 150 mM) in the absence and in the presence of either ametantrone-neamine ligands or their isolated components (neamine or ametantrone). As expected, the stability of free RNA significantly increased with the Na+
concentration (Tm = 44.3, 51.4 or 52.5 ºC in 50, 100 or 150 mM NaCl, respectively). However, as shown in Fig. 6, the stability of the complexes clearly decreased upon increasing the Na+ concentration, which confirms the importance of the electrostatic
interactions between these ligands and RNA. Interestingly, this behaviour was also found with ametantrone, which indicates that the stabilization provided by this anthraquinone derivative is not only based on intercalation but also on electrostatic interactions. This is in good agreement with the structure of the complex Mtx-Tau RNA11 and with the NMR data on the interaction between Amt-Nea2 and Tau RNA reported in this work that reveals specific contacts between the amino functions of the side chains of the anthraquinone heteroaromatic fragment and RNA.
Fig. 6 Comparison of the stabilizing effect of the ligands upon complexation with +3 mutated Tau
RNA at different NaCl concentrations. Melting temperatures (Tm) were determined in 10 mM
sodium phosphate buffer, pH 6.8, 0.1 mM Na2EDTA and NaCl at the concentration indicated, at
equimolecular concentrations of RNA and ligand (1 µM).
3,8 1 0,3 8,9 2,8 1,7 14,5 9,3 7,5 16,5 12,9 9,1 0 2 4 6 8 10 12 14 16 18 5 0 m M 1 0 0 m M 1 5 0 m M 5 0 m M 1 0 0 m M 1 5 0 m M 5 0 m M 1 0 0 m M 1 5 0 m M 5 0 m M 1 0 0 m M 1 5 0 m M
Neamine Ametantrone Amt-Nea Amt-Nea2
∆ T m ( ºC )
CONCLUSIONS
In this work, we have described a new family of Tau RNA ligands based on the
derivatization of one of the side chains of ametantrone with azaquinolone (Amt-Azq) or neamine (Amt-Nea/Nea2). All the reported compounds bind Tau RNA with low EC50 values (nM scale), particularly those containing the aminoglycoside moiety (e.g. EC50= 70.6 nM for Amt-Nea2). In addition, ametantrone-containing ligands are able to stabilize both wt Tau RNA and some of the mutated sequences associated with the development of tauopathies, such as FTDP-17. The overall data indicates that the derivatization of one of the side chains of ametantrone with neamine through a short spacer results in the compound with the best RNA-binding properties. This is consistent with the results from dynamic combinatorial chemistry experiments, and supports the choice of anthraquinone derivatives, such as ametantrone, as a starting point to synthesize ligands with improved Tau RNA-binding properties. It is particularly relevant the ability of Amt-Nea2 to restore the
thermodynamic stability of the mutated sequences upon complexation to a similar or even higher level than that of wt RNA. Moreover, NMR spectroscopic studies revealed the existence of a preferred binding site for this ligand to Tau RNA in which the anthraquinone fragment intercalates in the bulged region of the stem-loop structure, and the neamine moiety and the Amt side chains interact with the major groove of the RNA stem.
Current efforts are underway to increase the cellular stability of the most promising ligand by replacing the disulfide linkage with a non-reversible isoster bond, as well as for
elucidating by NMR spectroscopy the tridimensional structure of the complex between Tau RNA and Amt-Nea2. All these studies and the present work reported here will provide valuable information for designing new ametantrone-containing ligands with improved RNA-binding properties, not only for modulating Tau pre-mRNA splicing but also for
binding to other therapeutically relevant RNA secondary structures that contain a
characteristic bulged region where an adenine nucleotide is flanked by two G:C base pairs, such as the Rev response element (RRE) RNA.1a,22
EXPERIMENTAL
Materials and Methods. Unless otherwise stated, common chemicals and solvents (HPLC grade or reagent grade quality) were purchased from commercial sources and used without further purification. Aluminium plates coated with a 0.2 mm thick layer of silica gel 60 F254 (Merck) were used for thin-layer chromatography analyses (TLC), whereas flash column chromatography purification was carried out using silica gel 60 (230-400 mesh).
Reversed-phase high-performance liquid chromatography (HPLC) analyses of thiol-derivatized monomers and ligands were carried out on a Jupiter Proteo C18 column (250x4.6 mm, 90 Å 4 µm, flow rate: 1 mL/min) using linear gradients of 0.045% TFA in H2O (A) and 0.036% TFA in ACN (B). In some cases, purification was carried out using the same analytical column. A semipreparative Jupiter Proteo column was used for the purification of some compounds (250x10 mm, 90 Å 10 µm, flow rate: 3 mL/min), using linear gradients of 0.1% TFA in H2O (A) and 0.1% TFA in ACN (B).
NMR spectra were recorded at 25ºC on Varian spectrometers (500 or 600 MHz) using deuterated solvents. The residual signal of the solvent (CD3OD or D2O) was used as a reference in 1H and 13C spectra. Chemical shifts are reported in part per million (ppm) in
the δ scale, coupling constants in Hz and multiplicity as follows: s (singlet), d (doublet), t (triplet), q (quadruplet), qt (quintuplet), m (multiplet), dd (doublet of doublets), td (doublet of triplets), ddd (doublet of doublet of doublets), br (broad signal).
High-resolution matrix-assisted laser desorption ionization time-of-flight (MALDI-TOF) mass spectra were recorded on a 4800 Plus spectrometer (ABSciex) both in positive (2,4-dihydroxybenzoic acid matrix) or negative mode (2,4,6-trihydroxyacetophenone matrix with ammonium citrate as an additive). Electrospray ionization mass spectra (ESI-MS)
were recorded on a Micromass ZQ instrument with single quadrupole detector coupled to an HPLC, and high-resolution (HR) ESI-MS on an Agilent 1100 LC/MS-TOF instrument. Oligoribonucleotides were synthesized on an ABI 3400 DNA automatic synthesizer (1-µmol scale) using 2’-O-tert-butyldimethylsilyl protection and following standard
procedures (phosphite triester approach). RNA, biotin and fluorescein phosphoramidites, solid-supports, reagents and solvents for oligoribonucleotide synthesis were purchased from Glen Research or Link Technologies. RNase-free reagents, solutions and materials were used when manipulating oligoribonucleotides. RNase-free water was obtained directly from a Milli-Q system equipped with a 5000-Da ultrafiltration cartridge.
Reversed-phase HPLC was used for the analysis and purification of the
oligoribonucleotides using linear gradients of 0.1 M aqueous NH4HCO3, and a 1:1 mixture
of 0.1 M aqueous NH4HCO3 and ACN. A Kromasil C18 column (250x4.6 mm, 10 µm, flow rate: 1 mL/min) was used for RNA analysis whereas a semipreparative Jupiter C18 column (250x10 mm, 300 Å 10 µm, flow rate: 3 mL/min) was used for purification at large scale. Characterization was carried out by high resolution MALDI-TOF MS (negative mode, THAP matrix with ammonium citrate).
The following oligoribonucleotide sequences were synthesized (* label denotes that the ends of the chains were modified with 2’-O-methylribonucleosides): wt RNA:
5’rG*C*GGCAGUGUGAGUACCUUCACACGUCC*C*; +3 mutated RNA: 5’rG*C*GGCAGUGUAAGUACCUUCACACGUCC*C*; +14 mutated RNA: 5’rG*C*GGCAGUGUGAGUACCUUCAUACGUCC*C*. +16 mutated RNA:
fluorescein was attached at the 5’-end of wt RNA. The following wt RNA sequence was used in NMR studies: 5’rGGCAGUGUGAGUACCUUCACACGUC.
Synthesis of the thiol-derivatized ametantrone monomer (Amt-SH)
1,4-Bis((2-((2-hydroxyethyl)amino)ethyl)amino)anthraquinone (Ametantrone or Amt). 1,4-difluoroanthraquinone (850 mg, 3.48 mmol) and N-(2-hydroxyethyl)ethylenediamine (3.5 mL, 34.8 mmol) were dissolved in dry pyridine (15 mL). After stirring for 72 h at RT under Ar, the reaction mixture, which acquired a deep blue colour, was evaporated in vacuo to dryness. The residue was dissolved in water (50 mL) and washed with diethyl ether (2 x 50 mL). The aqueous phase was taken up and extracted several times with 20%
MeOH/CHCl3 until the blue colour disappeared (approx. 5 x 50 mL). Finally, the resulting organic phase was dried over anhydrous MgSO4, filtered and concentrated in vacuo to
dryness to afford the crude of the expected compound, which was used without further purification in the following step. Rf (CHCl3/MeOH 7:3): 0.41; 1H NMR (500 MHz, D2O) δ (ppm): 8.04 (2H, HG, HF, dd, J = 6.0 Hz, J = 2.9 Hz), 7.81 (2H, HE, HH, ddd, J = 6.0 Hz, J
= 3.4 Hz, J = 0.8 Hz), 7.04 (2H, HB, HC, s), 3.93 (4H, HN, HN’, m), 3.79 (4H, HK, HK’, t, J
= 6.0 Hz), 3.43 (4H, HL, HL’, t, J = 6.0 Hz), 3.34 (2H, HM, HM’, m); MALDI-TOF MS, positive mode: m/z 413.5 (calcd mass for C22H29N4O4 [M+H]+: 413.22), 435.6 [M+Na]+
(calcd mass for C22H28N4NaO4 [M+Na]+: 435.20).
1,4-Bis((2-((2-hydroxyethyl)-N-Boc-amino)ethyl)amino)anthraquinone (1). A solution of Boc2O (1.47 g, 6.75 mmol) in a 2:1 (v/v) mixture of dioxane/water (25 mL) was added to a
solution of the crude of Amt and Na2CO3 (149.1 mg, 1.41 mmol) in a 2:1 (v/v) mixture of dioxane/water (75 mL). After stirring for 17 h at RT under Ar, the reaction mixture was evaporated in vacuo, and the residue was dissolved in ethyl acetate (75 mL). The resulting
organic phase was washed with water (3 x 75 mL), dried over anhydrous MgSO4, filtered and concentrated in vacuo to dryness. After flash column chromatography (gradient: 0-100% AcOEt/hexanes; 0-2.5% MeOH/AcOEt), the desired product was obtained as a blue solid (830 mg, 39 % (2 steps)). Rf (1 % MeOH in AcOEt): 0.23; 1H NMR (500 MHz, CD3OD) δ (ppm): 8.28 (2H, HG, HF, m), 7.72 (2H, HE, HH, m), 7.56 (1H, HB/HC, s), 7.46 (1H, HB/HC, m), 3.68 (8H, HN, HN’, HK, HK’, m), 3.60 (4H, HL, HL’, m), 3.37 (4H, HM, HM’,
m), 1.45 (9H, HO/HO’, HP/HP’, HQ/HQ’, s), 1.36 (9H, HO/HO’, HP/HP’, HQ/HQ, s); 13C NMR (100 MHz, CD3OD) δ (ppm): 183, 157.43, 147.70, 135.69, 133.19, 133.18, 127.03, 125.05, 110.84, 81.96, 61.39, 51.43, 49.35, 41.71, 28.73; HR-ESI MS, positive mode: m/z 613.3231 (calcd mass for C32H45N4O8 [M+H]+: 613.3232), 635.3062 [M+Na]+ (calcd mass for
C32H44N4NaO8 [M+Na]+: 635.3051).
1-((2-((2-Hydroxyethyl)-N-Boc-amino)ethyl)amino)-4-((2-((2-(tioacetyl)ethyl)-N-Boc-amino)ethyl)amino)anthraquinone (2). To a solution of PPh3 (17 mg, 0.65 mmol) in
anhydrous THF (2 mL) under Ar, DIAD (129 µL, 0.65 mmol) was added at 0ºC. The formation of a white precipitate was observed after stirring for 2 h at this temperature. At this point, a solution of 1 (200 mg, 0.33 mmol) in anhydrous THF (6 mL) was added dropwise. After stirring for 10 min at 0ºC, thiolacetic acid (48 µL, 0.65 mmol) was added and the reaction mixture was stirred overnight at RT. The reaction mixture was
concentrated in vacuo to dryness, dissolved in AcOEt (50 mL) and washed with water (3 x 50 mL). The combined organic phases were dried over anhydrous MgSO4, filtered and
concentrated in vacuo to dryness. After flash column chromatography (gradient: 0-100% AcOEt/hexanes; 0-5% MeOH/AcOEt), the desired product was obtained as a blue solid that was slightly impurified with triphenylphosphine oxide. Purification was finally
H2O and B: 0.1 % TFA in H2O/ACN 3:7, 600 mL each solvent). Pure fractions by MS-HPLC (linear gradient from 0 to 100 % B in 18 min; A: 0.1 % formic acid in H2O and B: 0.1 % formic acid in ACN; Rt= 19.4 min) were combined and lyophilized, providing the
desired product as a blue solid (79 mg, 36%). Rf (AcOEt): 0.68; 1H NMR (500 MHz, CD3OD) δ (ppm): 8.28 (2H, HG, HF, m), 7.72 (2H, HE, HH, m), 7.54 (1H, HB/HC, m), 7.47 (1H, HB/HC, m), 3.67 (10H, HK, HK’, HM, HM’, HN’, m), 3.39 (4H, HL, HL’, m), 3.03 (m, 2H,
HN), 2.29 (3H, HR, s), 1.46 (9H, HO/HO’, HP/HP’, HQ/HQ, s), 1.35 (9H, HO/HO’, HP/HP’, HQ/HQ, s); 13C NMR (125 MHz, CD3OD) δ (ppm): 197.10, 183.25, 157.44, 147.66, 135.73, 133.24, 127.06, 125.03, 110.93, 81.71, 61.39, 51.83, 47.98, 41.53, 30,71, 29.13, 27.16; MALDI-TOF MS, positive mode: m/z 671.3103 (calcd mass for C34H47N4O8S [M+H]+: 671.3109), m/z 693.2925 (calcd mass for C34H46N4NaO8S [M+Na]+: 693.2929).
1-((2-((2-Hydroxyethyl)amino)ethyl)amino)-4-((2-((2-mercaptoethyl)amino)ethyl)amino)anthraquinone (Amt-SH). To a stirred solution of thioester derivative 2 (40 mg, 0.060 mmol) in MeOH (0.5 mL) was added sodium methoxide (240 µL, 1 M in MeOH, 0.24 mmol) and the mixture stirred for 1.5 h at RT under argon. Solvent was removed in vacuo and the resulting crude was dissolved in a TFA/TIS/H2O mixture (10 mL, 95:2.5:2.5) and allowed to stand for 30 min at RT. After evaporation in vacuo, the residue was dissolved in Milli-Q H2O (10 mL) and
1,4-dithiothreitol (173 mg, 1.124 mmol) was added to the aqueous phase to reduce the disulfide bond of the resulting homodimeric compound. After stirring for 24 h at 37ºC under Ar, the aqueous phase was washed with AcOEt (6 x 10 mL) to remove 1,4-dithiothreitol and lyophilized. Purification was carried out by MPLC eluting with a gradient from 0 to 100 % of B (A: 0.1 % TFA in H2O and B: 0.1 % TFA in H2O/ACN 3:7, 600 mL each solvent).
TFA in H2O and B: 0.036 % TFA in ACN; Rt= 17.9 min) were combined and lyophilized, providing the TFA salt of the desired product as a blue solid (4.6 mg, 12%). MALDI-TOF MS, positive mode: m/z 429.4 (calcd mass for C22H29N4O3S [M+H]+: 429.20), m/z 451.4
(calcd mass for C22H28N4NaO3S [M+Na]+: 451.18); ESI MS, positive mode: m/z 429.03 [M+H]+, m/z 451.08 [M+Na]+.
Synthesis of ametantrone-containing ligands.
Amt-Nea2. 2,2’-dithiobis(5-nitropyridine) (6.7 mg, 21.6 µmol) and Nea2-SH (1.7 µmol) were reacted in a 2:1 (v/v) mixture of THF/aqueous 0.1 % TFA (3 mL) under argon at RT. After 17 h, THF was evaporated in vacuo and the remaining blue solution was diluted with H2O (2 mL). The aqueous phase was extracted with Et2O (5 x 5 mL) to remove the excess of 2,2’-dithiobis(5-nitropyridine). Then, a solution of Amt-SH (1.4 µmol) in aqueous 0.1 % TFA (3 mL) was added and the mixture was stirred overnight under Ar at RT. After
purification by semipreparative reversed-phase HPLC (linear gradient from 0 to 35 % B in 30 min; A: 0.1 % TFA in H2O and B: 0.1 % TFA in ACN; flow: 3 mL/min; Rt= 23.7 min) and lyophilization, the desired product was obtained as a blue solid (0.78 µmol, 56 %). 1H
NMR (600 MHz, D2O) δ (ppm): 8.25 (2H, HG, HF, m), 7.81 (2H, HE, HH, m), 7.49 (2H, HB, HC, s), 5.46 (1H, H1’, m), 4.02 (1H, Ha, m), 3.86 (5H, HN’, H5’, H6, Ha’, m), 3.80 (4H, HK, HK’, m), 3.72 (1H, H3’, m), 3.51 (2H, H6’, m), 3.38 (6H, H4, H5, HM’, HM, m), 3.33 (1H, H4’,
m), 3.21 (4H, HL, HL’, m), 3.09 (2H, H1, H3, m), 3.02 (1H, H2’, m), 3.00 (2H, HN, m), 2.82 (2H, Hb, m), 2.15 (1H, H2,eq, m), 1.48 (1H, H2,ax, m); HR-ESI MS, positive mode: m/z 809.3671 (calcd mass for C36H57N8O9S2 [M+H]+: 809.3690), m/z 831.3497 (calcd mass for
C36H56N8NaO9S2 [M+Na]+: 831.3509); analytical HPLC (0 a 35% B en 30 min): Rt = 21.6 min).
Amt-Nea. 2,2’-dithiobis(5-nitropyridine) (11.6 mg, 37.5 µmol) and Nea-SH (3 µ mol) were reacted in a 2:1 (v/v) mixture of THF/aqueous 0.1 % TFA (3 mL) under argon for 17 h at RT. After evaporation in vacuo and washings with Et2O, a solution of Amt-SH (1.7 µmol)
in aqueous 0.1 % TFA (3 mL) was added and the mixture was stirred overnight under argon at RT. After purification by HPLC (see the conditions used for Amt-Nea2) and
lyophilization, the desired product was obtained as a blue solid (0.57 µmol, 33 %). 1H
NMR (600 MHz, D2O) δ (ppm): 8.32 (2H, HG, HF, m), 7.87 (2H, HE, HH, m), 7.57 (2H, HB, HC, m), 5.42 (1H, H1’, d, J = 3.7 Hz), 3.95 (3H, H5’, HN’, m), 3.85 (4H, HK, HK’, m), 3.78 (1H, Ha, m), 3.66 (1H, H3’), 3.59 (1H, Ha’, m), 3.50 (1H, H6), 3.45 (3H, HM, H4), 3.39 (4H, H5, H6’, H4’, m), 3.24 (4H, HL, HL’, m), 3.18 (2H, HM’, m), 2.99 (2H,H1, H3, m), 2.87 (3H, H2’, HN, m), 2.50 (2H, Hf, t, J = 7.1 Hz), 2.16 (1H, H2,eq, m), 1.43 (5H, Hb, He, H2,ax, m),
1.10 (4H, Hc, Hd); HR-ESI MS, positive mode: m/z 865.4324 (calcd mass for C40H65N8O9S2 [M+H]+: 865.4316); analytical HPLC (0 a 35% B en 30 min): Rt = 23.8 min).
Amt-Azq. 2,2’-dithiobis(5-nitropyridine) (2.4 mg, 7.5 µmol) and Azq-SH (1.5 µmol) were reacted in a 1:1 (v/v) mixture of THF/1 M aqueous ammonium acetate pH=3.5 (4 mL) under argon at RT. After 5 h, THF was evaporated in vacuo and the remaining solution was diluted with H2O (2 mL). The aqueous phase was extracted with Et2O (5 x 5 mL) and lyophilized. A solution of Amt-SH in H2O-0.1 % TFA (2 mL) was added to the activated
azaquinolone monomer dissolved in 1 M aqueous ammonium acetate pH=3.8 (3 mL) under Ar. After stirring for 3 h at RT, Amt-Azq ligand was isolated by semipreparative reversed-phase HPLC (linear gradient from 0 to 40 % B in 30 min; A: 0.1 % formic acid in H2O and
B: 0.1 % formic acid in ACN; flow: 3 mL/min; Rt= 16.2 min) and after lyophilization, the desired product was obtained as a blue solid (0.73 µmol, 48 %). 1H NMR (600 MHz, D2O)
δ (ppm): 7.98 (1H, HF/HG, m), 7.94 (1H, HG/HF, m), 7.75 (2H, HE, HH, m), 7.56 (2H, HW, HV, m), 7,22 (2H, HB, HC), 6.79 (1H, HU, d, J=8.0 Hz), 6.38 (1H, HX, d, J=9.5 Hz), 3.86 (4H, HN’, HT, m), 3.76 (2H, HK/HK’, m), 3.64 (2H, HK/HK’, m), 3.31 (4H, HL/HL’, HQ, m), 3.19 (4H, HL/HL’, HM, m), 3.12 (2H, HM’, m), 3.00 (4H, HO, HN, m), 2.93 (2H, HS, m), 2.68
(2H, HP, m), 1.86 (2H, HR, m); HR-ESI MS, positive mode: m/z 747.3119 (calcd mass for C37H47N8O5S2 [M+H]+: 747.3111), m/z 769.2945 (calcd mass for C37H46N8NaO5S2
[M+Na]+: 769.2930); analytical HPLC (0 a 50% B en 30 min): Rt = 21.2 min).
General procedure for the RNA-templated DCC experiments
DCC experiments were carried out as previously described.13 Briefly, biotinylated wt RNA (6 nmol) was annealed in 240 µL of buffer (50 mM Tris-HCl, pH 7.7, 100 mM NaCl and 0.1 mM Na2EDTA) by heating to 90ºC for 5 min and then slowly cooling to room
temperature. After overnight incubation at RT, the solutions were stored at 4ºC. The annealed biotinylated RNA was added to an Eppendorf tube containing the quantified (Ellman’s test) thiol building blocks (24 nmol of each monomer), and the resulting mixture left to stand at RT under air without stirring. At the desired time, the disulfide exchange was stopped by the addition aqueous 0.1 % TFA (v/v) solution until pH ∼ 5–6 was reached. The biotinylated RNA and the binding ligands were isolated with streptavidin-coated magnetic beads (Biomag Streptavidin, 5 mg mL-1 suspension, Qiagen). A magnet was used in all washing procedures to retain the beads in the tube while the supernatant was pipetted off. The beads (500 µL of suspension for each DCL aliquot) were first washed with an acidic buffer (3 x 500 µ L of 50 mM Tris-HCl, pH 5.8, 100 mM NaCl and 0.1 mM Na2EDTA). After incubation for 20 min at RT with the DCL aliquots, the beads were
After washing the beads (3 x 200 µL of 50 mM Tris-HCl, pH 5.8, 100 mM NaCl and 0.1 mM Na2EDTA) to remove the non-interacting compounds, a treatment with a hot solution of 0.1% TFA in H2O (v/v) was used to liberate RNA-binding ligands (3 x 200 µ L,
incubation at 90ºC for 10 min). The three acidic solutions were combined and evaporated to dryness in a Speed-Vac to provide a residue that was dissolved in 0.1 % TFA in H2O (v/v) and analysed by UV-MS HPLC. Elution was performed on a Kinetex C18 column (100 x 4.6 mm, 2.6 µm, 100 Å, flow rate: 0.2 mL min-1
) with linear gradients of H2O and ACN
containing both solvents, either 0.1% formic acid (v/v) or 0.1 % formic acid (v/v) and 0.01 % TFA (v/v), to avoid the overlapping of some peaks and to allow a more accurate
integration. All peak areas of the HPLC traces were integrated and normalized taking into account the previously described extinction coefficients at 260 nm.13a The following extinction coefficient was calculated for ametantrone-containing compounds: ε260: 39.253 M-1cm-1.
Evaluation of the interaction between RNA and ligands
All the assayed compounds displayed a purity ≥95%, determined by HPLC analysis.
UV-monitored melting experiments: Melting curves were recorded as previously
described.13a,13b Briefly, samples were cooled from 90ºC to 20ºC at a constant rate of 0.5 ºC min-1 and the absorbance at 260 nm was measured as a function of temperature. The denaturation curves (20ºC to 90ºC) were also recorded. All experiments were repeated at least three times until coincident Tm values were obtained. The estimated error in Tm values was ± 0.2ºC. The solutions were 1 µM both in RNA (wt, +3, +14 or +16) and in ligands, in 10 mM sodium phosphate buffer pH 6.8, 100 mM NaCl and 0.1 mM Na2EDTA.
UV-Vis and Fluorescence titration experiments: First, UV-Vis spectra or fluorescence emission spectra of the free ligand in the previous buffer were recorded. Subsequent aliquots of a wt RNA solution in the same buffer (previously folded by heating the solution for 5 min to 90ºC and left to slowly cool to RT) were added to the ligand’s solution, and the UV-Vis or fluorescence emission spectra were recorded.
Fluorescence binding assays: Fluorescence measurements were performed in 1-cm path-length quartz cells on a QuantaMaster fluorometer (PTI) at 25ºC, with an excitation slit width of 4.8 nm and an emission slit width of 8 nm. Upon excitation at 490 nm, the
emission spectrum was recorded over a range between 505 and 540 nm until no changes in the fluorescence intensity were detected. All binding assays were performed in the melting curves’ buffer. The sample was continuously stirred except during the fluorescence
measurement. First, the fluorescence spectrum of the buffer was recorded, to be used as the baseline. For each experiment, the spectrum of a 25 nM solution of refolded fluorescein-derivatized RNA (25 pmol in 1 mL buffer) was recorded, and the baseline blank subtracted. Subsequent aliquots of 1 µ L of aqueous ligand’ solutions (of increasing concentrations, depending on the ligand’s affinity) were added to the RNA-containing solution. The fluorescence spectrum was recorded after addition of each aliquot until the fluorescein fluorescence signal at 517 nm reached saturation (typically 5–10 min). Over the entire range of ligand concentrations used, the emission maxima varied less than 1 nm. The total volume of the sample never changed more than 10-15 %. The full titration was repeated in the absence of labelled RNA to correct for the presence of the ligand’s fluorescence. These spectra were subtracted from each corresponding point of the labelled RNA titrations, and the resulting fluorescence intensity was corrected for dilution (F’=F*V/V0).
The emission fluorescence at 517 nm was normalized by dividing the difference between the observed fluorescence, F’, and the initial fluorescence, F0, by the difference between the final fluorescence, Ff, and the initial fluorescence, F0. This normalized fluorescence
intensity was plotted as a function of the logarithm of the total ligand concentration in each point of the titration. Finally, nonlinear regression using a sigmoidal dose-response curve was performed with the software package GraphPad Prism 4 (GraphPad Software, San Diego, CA) to calculate the EC50 values. Experimental errors were less than or equal to ± 25% of each value.
For competitive experiments, a tRNA from baker’s yeast (S. cerevisiae) was purchased from Sigma. Stock solutions of tRNAmix were quantified using an average extinction coefficient of 9.640 cm-1 per base.13a The fluorescence binding assays were carried out as
described above with the exception that a 30-fold excess (base) of the tRNAmix was added to the refolded fluorescein-labelled RNA (or to the buffer for the titration without target RNA).
NMR Spectroscopy: NMR spectra were acquired in Bruker Advance spectrometers operating at 600 or 800 MHz, and processed with Topspin software. Samples were dissolved in 10 mM phosphate buffer, pH 6.8, either in D2O or in H2O/D2O 9:1.
For titration experiments, wt RNA (60 nmol) was dissolved in 600 µL of 10 mM sodium phosphate buffer (pH 6.8), and 2 µL of a 33.3 µM solution of DSS in water were added. After lyophilization, the residue was dissolved in 600 µ L of a 9:1 H2O/D2O mixture. Annealing was performed by heating at 90ºC for 3 min, followed by snap cooling on ice for 20 min. NMR spectra were recorded at 5ºC to minimize the exchange with water. Water suppression was achieved by using an excitation sculpting sequence (zgesgp). Subsequent 1D 1H NMR spectra were recorded at 5ºC upon addition of increasing quantities of ligand
(0.5, 1.0, 1.5 and 2.0 mol equiv.). The total volume of the sample never changed more than 5%.
A 0.28 mM RNA sample (147 nmol in 525 µ L sodium phosphate buffer) was used for recording 2D spectra in H2O/D2O at 5ºC. The complex with Amt-Nea2 was prepared by adding 1 mol equivalent of the ligand. A series of DQF-COSY, TOCSY and NOESY experiments were recorded in D2O. The NOESY spectra were acquired with mixing times
of 100, 250 and 300 ms, and the TOCSY spectra were recorded with standard MLEV-17 spin-lock sequence, and 80 ms mixing time. In addition, NOESY spectra in H2O were acquired with 100 ms mixing time. In 2D experiments in H2O, water suppression was
achieved either by using an excitation sculpting sequence or by including a WATERGATE module in the pulse sequence prior to acquisition. Two-dimensional experiments in D2O were carried out at temperatures ranging from 5 ºC to 25 ºC, whereas spectra in H2O were recorded at 5 ºC to reduce the exchange with water. The spectral analysis program Sparky was used for semiautomatic assignment of the NOESY cross-peaks and quantitative evaluation of the NOE intensities. Structural models based on NMR constraints were built with the program Sybyl (Tripos Inc) on the basis the Mtx:Tau RNA complex11 (PDB
code:1Qc8). The ametantrone and neamine moieties were set at similar positions as the mitoxantrone and neomycin in their respective complexes with the RNA.9,11 Initial coordinates of the complex were energy minimized, submitted to a short run of molecular dynamics, and energy minimized again to optimized the geometry and eliminate steric contacts. These calculations were carried out with the program Sybyl using built-in force fields. Analysis of the structures was carried out with the programs Sybyl and MOLMOL.
ACKNOWLEDGEMENTS
The authors acknowledge Dr. M. Gairí from the Barcelona Scientific Park for NMR technical support, and Dr. I. Fernández and L. Ortiz from the facilities of the Servei
d’Espectrometria de Masses of the University of Barcelona for MS support. This work was supported by funds from the Spanish Ministerio de Ciencia e Innovación (grant CTQ2010-21567-C02-01-02, the Generalitat de Catalunya (2009SGR-208 and the Xarxa de
Referència de Biotecnologia) and the Programa d’Intensificació de la Recerca (Universitat de Barcelona). Paula López-Senín received a fellowship from the Ministerio de Educación y Ciencia and Gerard Artigas from the Universitat de Barcelona.
NOTES AND REFERENCES
1 (a) J. Gallego and G. Varani, Acc. Chem. Res., 2001, 34, 836–843; (b) Y. Tor,
ChemBioChem, 2003, 4, 998–1007; (c) P. A. Sharp, Cell, 2009, 136, 577–580; (d) W. E. Georgianna and D. D. Young, Org. Biomol. Chem., 2011, 9, 7969–7978.
2 (a) C. S. Chow and F. M. Bogdan, Chem. Rev., 1997, 97, 1489–1513; (b) G. J. R. Zaman, P. J. A. Michiels and C. A. A. van Boeckel, Drug Discov. Today, 2003, 8, 297–306.
3 (a) J. R. Thomas and P. J. Hergenrother, Chem. Rev., 2008, 108, 1171–1224; (b) F. Aboul-ela, Future Med. Chem., 2010, 2, 93–119; (c) L. Guan and M. D. Disney, ACS
Chem. Biol., 2012, 7, 73–86; (d) L. O. Ofori, J. Hoskins, M. Nakamori, C. A. Thornton and B. L. Miller, Nucleic Acids Res., 2012, 40, 6380–6390; (e) J. L. Childs-Disney, R. Parkesh, M. Nakamori, C. A. Thornton and M. D. Disney, ACS Chem. Biol., 2012, 7, 1984–1993; (f) L. Guan and M. D. Disney, Angew. Chem. Int. Ed., 2013, 52, 1462–1465; (g) J.-P. Joly, G. Mata, P. Eldin, L. Briant, F. Fontaine-Vive, M. Duca and R. Benhida, Chem. Eur. J., 2014, 20, 2071–2079.
4 (a) T. Xia, Curr. Opin. Chem. Biol., 2008, 12, 604–611; (b) T. Tuccinardi, Future Med.
Chem., 2011, 3, 723–733; (c) A. C. Stelzer, A. T. Frank, J. D. Kratz, M. D. Swanson, M. J. Gonzalez-Hernandez, J. Lee, I. Andricioaei, D. M. Markovitz and H. M. Al-Hashimi,
Nature Chem. Biol., 2011, 7, 553–559; (d) D. I. Bryson, W. Zhang, P. M. McLendon, T. M. Reineke and W. L. Santos, ACS Chem. Biol., 2012, 7, 210–217.
5 (a) C. Ballatore, V. M. Lee and J. Trojanowski, Q. Nat. Rev. Neurosci., 2007, 8, 663–672; (b) W. Noble, A. M. Pooler and D. P. Hanger, Expert Opin. Drug. Discov., 2011, 6, 797– 810.
6 (a) L. Varani, M. Hasegawa, M. G. Spillantini, M. J. Smith, J. R. Murrell, B. Ghetti, A. Klug, M. Goedert and G. Varani, Proc. Natl. Acad. Sci. U. S. A., 1999, 96, 8229–8241; (b) C. P. Donahue, C. Muratore, J. Y. Wu, K. S. Kosik and M. S. Wolfe, J. Biol. Chem. 2006, 281, 23302–23306.
7 (a) M. G. Spillantini, J. R. Murrell, M. Goedert, M. R. Farlow and A. Klug, Proc. Natl.
Acad. Sci. U.S.A., 1998, 95, 7737–7741; (b) F. Liu and C. X. Gong, Mol. Degener., 2008, 3:8; (c) M. S. Wolfe, J. Biol. Chem. 2009, 284, 6021–6025; (d) M. Niblock and J.-M. Gallo, Biochem. Soc. Trans., 2012, 40, 677–680; (e) E. Peacey, L. Rodríguez, Y. Liu and M. S. Wolfe, Nucleic Acids Res., 2012, 40, 9836–9849.
8 (a) E. Buratti and F. E. Baralle, Mol. Cell. Biol., 2004, 24, 10505–10514; (b) N. N. Singh and R. N. Singh, Nucleic Acids Res., 2007, 35, 371–389.
9 L. Varani, M. G. Spillantini, M. Goedert and G. Varani, Nucleic Acids Res., 2000, 28, 710–719.
10 C. P. Donahue, J. Ni, E. Rozners, M. A. Glicksman and M. S. Wolfe, J. Biomol.
11 S. Zheng, Y. Chen, C. P. Donahue, M. S. Wolfe and G. Varani, Chem. Biol., 2009, 16, 557–566.
12 Y. Liu, E. Peacey, J. Dickson, C. P. Donahue, S. Zheng, G. Varani and M. S. Wolfe, J.
Med. Chem. 2009, 52, 6523–6526.
13 (a) P. López-Senín, I. Gómez-Pinto, A. Grandas and V. Marchán, Chem. Eur. J., 2011, 17, 1946–1953; (b) P. López-Senín, G. Artigas and V. Marchán, Org. Biomol. Chem., 2012, 10, 9243–9254; (c) P. López-Senín, Ph.D. Thesis, 2010, University of Barcelona (Spain); (d) G. Artigas and V. Marchán, J. Org. Chem., 2013, 78, 10666−10677.
14 (a) P. T.Corbett, J. Leclaire, L. Vial, K. R. West, J.-L. Wietor, J. K. M. Sanders and S. Otto, Chem. Rev., 2006, 106, 3652–3711; (b) In Dynamic Combinatorial Chemistry: In
Drug Discovery, Bioorganic Chemistry, and Materials Science (Miller, B. L., Ed.), John Wiley & Sons, Inc., 2010, Hoboken, N. J; (c) C. Sherman Durai and M. M. Harding, Aust.
J. Chem., 2011, 64, 671–680; (d) A. Herrmann, Chem. Soc. Rev., 2014, 43, 1899–1933; (e) B. D. Blakeley, S. M. DePorter, U. Mohan, R. Burai, B. S. Tolbert and B. R. McNaughton,
Tetrahedron, 2012, 68, 8837–8855.
15 (a) A. Gianoncelli, S. Basili, M. Scalabrin, A. Sosic, S. Moro, G. Zagotto, M. Palumbo, N. Gresh and B. Gatto, ChemMedChem, 2010, 5, 1080–1091; (b) A. Skladanowski and J. Konopa, British J. Cancer, 2000, 82, 1300–1304.
16 B. Stefanska, M. Dzieduszycka, S. Martelli and E. Borowski, J. Med. Chem., 1989, 32, 1724–1728.
17 F. Rabanal, W. F. DeGrado and D. L. Dutton, Tetrahedron Lett., 1996, 37, 1347–1350. 18 (a) P. C. Gareiss, K. Sobczak, B. R. McNaughton, P. B. Palde, P. B., C. A. Thornton and B. L. Miller, J. Am. Chem. Soc., 2008, 130, 16254–16261; (b) N. W. Luedtke, Q. Liu and Y. Tor, Biochemistry, 2003, 42, 11391–11403; (c) J. R. Thomas, X. Liu and P. J.
Hergenrother, Biochemistry, 2006, 45, 10928–10938; (d) S. J. Lee, S. Hyun, J. S. Kieft and J. Yu,. J. Am. Chem. Soc., 2009, 131, 2224–2230.
19 L. Guan and M. D. Disney, Angew. Chem. Int. Ed., 2013, 54, 1462–1465.
20 (a) R. Moumné, M. Catala, V. Larue, L. Micouin and C. Tisné, Biochimie, 2012, 94, 1607–1619; (b) T. Lombes, R. Moumné, V. Larue, E. Prost, M. Catala, T. Lecourt, F. Dardel, L. Micouin and C. Tisné, Angew. Chem. Int. Ed., 2012, 51, 9530–9534.
21 A. M. Smith, J. Kassman, K. J. Srour and A. M. Soto, Biochemistry, 2011, 50, 9434– 9445.
22 (a) S. R. Kirk, N. W. Luedtke and Y. Tor, J. Am. Chem. Soc., 2000, 122, 980–981; (b) J. Zhang, S. Umemoto and K. Nakatani, K. J. Am. Chem. Soc., 2010, 132, 3660–3661; (c) T. Tran and M. D. Disney, Nat. Commun., 2012, 3, 1–9.
TABLE OF CONTENTS GRAPHIC AND TEXT
Ligands with a preferred binding site in the bulged region of the stem-loop structure of Tau pre-mRNA have been identified by dynamic combinatorial chemistry.