A contribution of fuzzy logic to sustainable
tourism through a case analysis in Brazil
1
Luciano Barcellos de Paula
a,b*, Anna María Gil-Lafuente
cand Daniela F. Alvares
daCENTRUM Cátolica Graduate Business School, Jirón Daniel Alomía Robles 125, Urbanización Los Álamos de Monterrico, Santiago de Surco 15023, Lima, Perú.
bPontificia Universidad Católica del Perú, Av. Universitaria 1801, San Miguel 15088, Lima, Perú.
cDepartment of Business Administration, University of Barcelona, Av. Diagonal 690, 08034 Barcelona, Spain. dInstituto Federal de Minas Gerais, Belo Horizonte, Brazil.
Abstract. Society is increasingly concerned about environmental, social and economic issues. According to the World
Tour-ism Organization, over the past six decades, tourTour-ism has experienced a continuous expansion and diversification to become one of the fastest-growing economic sectors in the world. Furthermore, studies affirm the complexity of the tourism sector and the fact that sustainable development depends on various topics that are not correctly identified by managers and policymakers. For these reasons, this paper aims to reflect on the effects of tourism and to propose alternatives that can be sustainably man-aged. In terms of results, knowledge gaps have been identified and, through a case analysis in Brazil, the forgotten effects of tourism activity that can have an impact on sustainable development have been exposed. Also, an algorithm has been presented to manage uncertainty and facilitate decision-making.
Keywords: Sustainable tourism, Sustainability, Decision-making, Fuzzy logic, Forgotten effects.
1This study is the extension of a presentation made by authors at the International Workshop “Innovation, Complexity and Uncertainty in
Economics and Business”, held at Royal Academy of Economic and Financial Sciences, 14th November 2019, Barcelona, Spain.
1. Introduction
According to the World Tourism Organization (UNWTO), tourism is an important economic sector, accounting for 10% of global Gross Domestic Product (GDP), 30% of service exports and 1 in 10 jobs in the world. Studies also indicate that tourism is the third-largest export category in the world (1,586 USD billion) after chemicals (1,993 USD billion) and fuels (1,960 USD billion), and ahead of automotive products and food [27]. In 2018, “international tourist arrivals grew by 5% to reach the 1.4 billion mark. At the same time, export revenues generated by tourism [rose] to 1.7 USD billion” [28]. In summary, the results show nine consecutive years of sustained growth, demonstrating the strength and resilience of tourism [28].
However, there is a growing societal concern for sustainability, which increases the sector’s responsibility for sustainable development (SD). Tourism has the potential to contribute, directly or indirectly, to the sustainable development goals (SDGs). In particular, it has been included within targets under Goals 8, 12 and 14 regarding inclusive and sustainable economic growth, sustainable consumption and production and sustainable use of oceans and marine resources, respectively [28]. For the authors [21] sustainable development is also understood as development that is socially just and ethically acceptable. Sustainability is an integrative concept that considers environmental, social, and economic aspects as three fundamental dimensions, denoted as pillars of sustainability, referred to more colloquially as planet, people, and profits [15]. Furthermore, studies affirm the complexity of the tourism sector, for example, the relationships between sustainable development, tourism and localities [16] and that sustainable development depends on various topics that are not correctly identified by managers and policymakers.
For these reasons, the aims of this paper are to reflect on the consequences of tourism with respect to sustainable development and to propose alternatives to manage these consequences in a sustainable way. To achieve the objectives of the study, the research undertaken can be classified as applied, with the explanatory objective and combined approach (quantitative-qualitative), through modeling and simulation, and a case study [17].
Due to the complexity involved in sustainable tourism, this paper uses Fuzzy Logic to support decision-makers. Fuzzy logic has been successfully
used in different fields [9] and, in the specific case of the Forgotten Effects Theory [2], this algorithm has proven to be a very useful tool in sustainable development issues in enterprises [8]. This paper provides anovel contribution by applying the algorithm to the concept of sustainable tourism.
In terms of results, knowledge gaps have identified and, through the case analysis in Brazil, the forgotten effects of tourism activity on sustainable development have been exposed.
The main contribution of the manuscript is to reflect on the complexity of the tourism sector and present an algorithm that can cope with uncertainty and contribute to sustainable development. The most important limitation concerns the number of small and medium-sized enterprises (SMEs) that participated in the analysis.
The paper is structured as follows: Section 2 introduces the materials and methods, Section 3 explains the results, Section 4 discusses the obtained results, Section 5 provides conclusions and is followed by the bibliographical references.
2. Materials and methods
This section is organized into four parts. First, a summary of the sustainable tourism (ST) literature is provided, considering the most cited papers from Web of Science (WoS) on the subject. Secondly, a case analysis on ST in Brazil is described. Thirdly, a bibliometric study on “sustainable tourism” and “fuzzy”, as well as the knowledge gaps are identified. Fourthly, an algorithm of fuzzy logic that can be used in ST is explained.
2.1. Sustainable tourism
Research using the specific term “ST” began just two decades ago[20]. As a reference, “ST may be regarded most basically as the application of the sustainable development idea to the tourism sector” [4]. In other words, tourism activity is developed in a sustainable way without compromising future generations. ST encompasses various subjects, such as heritage management [11], environmental concern [22], respect for local culture and gastronomy [23], and must be linked to sustainable development [5].
However, tourism is like any other industry in the sense that it can make both a positive and negative contribution to the environment and communities[16]. Scientific studies suggest that the global environmental consequences of tourism occur
locally, but they are added to global phenomena [25]. For example, CO2 emissions from tourism have a significant impact on the environment. It is estimated that approximately 40% of this impact comes from air transport, 32% from car transport and 21% from accommodation [7]. Other research [25] identified five areas of impacts stemming from tourism: “land cover and land-use change, energy use, biotic exchange and extinction of wild species, exchange, and dispersal of diseases, and changes in perception and understanding of the environment through travel” [25].
In the same line of research, [6] supports that ST presents a paradox.On the one hand ST is a success as a result of its diffusion across several sectors, such as business, politics and academia. On the other hand, policies have failed to reduce the environmental impacts of tourism activity. One of the reasons for this is the unwillingness of key actors in tourism policy networks to acknowledge policy failure [6]. For [20] the industry is not yet close to sustainability and “the main driver of improvement is regulation rather than market measures” [20].
Another point to highlight is the importance of governance for ST and the difficulties of coordinating between various stakeholders. Governance faces a number of obstacles, mainly at the political level, and it can be difficult to influence the private sector [4]. The same author suggests that social theory can help building a strategic relationship between stakeholders [4].
According to [16], sustainability is a matter of both local and global responsibilities, with globalization presenting an enormous challenge for political and economic actors to place much greater emphasis on human relations and ethics in tourism.
2.2. Sustainable Tourism Certification Program
This section presents a case analysis on ST in Brazil based on the implementation of the Sustainable Tourism Certification (STC) Program [14] in Brazil. This program was a pioneer on the subject and has served as the basis for the ISO 21401:2018 standard.
The program was executed by the Hospitality Institute with the support of the Export and Investment Promotion Agency (APEX-Brazil), Inter-American Development Bank (IDB), Brazilian Micro and Small Business Support Service (known as SEBRAE in Brazil), Estrada Real Institute, Brazilian Association of Hotel Industry, and the Brazilian
Council of Sustainable Tourism (known as CBTS in Brazil). The aim of this program was to improve the quality and competitiveness of SMEs in tourism by stimulating their best performance in environmental, socio-cultural and economic areas, through the adoption of standards, a sustainability management system and pursuit of certification.
In Brazil, this program was applied to 365 accommodation establishments in 19 different tourist destinations from 2004 to 2007. The object of this study is the implementation of this STC program in the “Serra do Cipó”, a tourist region located in the province of Minas Gerais, Brazil. This region is considered a natural heritage as a result of its biodiversity and potential for ecotourism. In addition to natural attractions, this region also offers a rich folkloric culture, inclduing cuisine and production of handicrafts, rooted in the Afro-brazilian and Portuguese population.
The STC program lasted 7 months in “Serra do Cipó”(from April to October 2006) and included the participation of 20 accommodation establishments. Due to confidentiality reasons, the names of the SMEs and owners are notdisclosed.
The program used the Brazilian technical standard (NBR 15401 - Sustainability Management System - Accommodation facilities), based on the Sustainable Tourism Principles (STP), as a reference. The concept of the standard is established on a Sustainability Management System (SMS) and contemplates environmental, socio-cultural and economic dimensions.
According to SMS requirements, the participating enterprises had to establish and maintain an SMS in order to ensure the continued and systematic service of the STP, with reference to Sustainability Policy; Management Responsibilities; Planning; Implementation and Operation; Verification, Monitoring and Corrective Actions; Critical Analysis; Transparency, Communication and Promotion of Sustainable Tourism.
Regarding the environmental requirements, the practices of the enterprise had to be sustainable and minimize the degradation of the environment, with reference to: Preparation and Assistance to Environmental Emergencies; Natural Areas, Flora and Fauna; On-site Construction Architecture and Impacts; Landscaping; Emissions, Effluents, and Solid Waste; Energy Efficiency; Conservation and Management of Water Use; Selection and Use of Inputs.
The socio-cultural requirements ensured that business operations and practices contributed to
recognizing, promoting and respecting the historical-cultural heritage of the region and non-predatory cultural traditions and values. This set of requirements also ensured the socio-environmental and economic development of workers and communities involved in the production chain, with reference to: Local Communities; Work and Income; Working Conditions; Cultural Aspects; Health and Education; Traditional Populations.
Finally, the economic requirements made sure that business practices were safe, viable, met customer expectations and complied with legislation, with reference to: Economic Viability of the Enterprise; Quality and Customer Satisfaction; Customer Safety and Health and Safety at Work. From PDCA (plan-do-check-act), the implantation method had 16 steps, beginning with the diagnosis and finishing with corrective and preventive actions, as shown in Figure 1.
Fig. 1. Implementation method [13].
The technical assistance process included consulting through 12 workshops and 9 technical visits over a total of 134 hours for each entrepreneur. The project had two consultants and each one assisted 10 SMEs. Entrepreneurs received support material that contained an implementation guide, good practice manuals and indicators for sustainability.
In general terms, the project achieved the following results: completion of program implementation within the forecasted deadline; commitment of 100% of the participants enrolled in the program (i.e. there was no abandonment); presence and punctuality of the participants; participation and integration among participants; understanding of the standard by entrepreneurs; and the implementation of good practices for sustainable tourism by all enterprises. At the end of the program,
the indicators were measured and the achieved results are included in Table 1. Excellent results are observed with low energy consumption (6.82 Kw/h), a high rate of local labour recruitment (91.44%) and customer satisfaction (95%).
Table 1
Sustainability Indicators after 7 months of the project [14].
Environmental dimension
Water consumption/guest/night (l) 225.10 Energy consumption/guest/night (kw/h) 6.82 Waste generation/guest/night (kg) 1.34 Gross revenue invested in environmental plans (%) 1.08
Sociocultural dimension
Local labor (%) 91.44 Labor turnover (%) 1.89 Number of hours of training/employee (h) 134 Gross revenue applied in socio-cultural plans (%) 1.06
Economic dimension
Customer satisfation (%) 95 Accident rates (with remoteness and absence) 0 Occupancy rate (%) 30.55 Break-even point (%) 28
To achieve responsible management based on sustainability criteria, it is important to measure the impacts an enterprise might cause with its activity. With the indicators, SMEs have been able to see how sustainability is important for both their businesses and society. The next step would be to take action to reduce impacts and maintain management in a sustainable way.
The positive results of the programme combined with the importance of ST for society were decisive for creating a new version of the NBR 15401 standard in 2014, when the process began by actively participating in the ISO Tourism Committee. In 2016, the ST working group (WG 13) comprising 60 specialists from 26 different countries was created. After five meetings (May/2016 – Kuala Lumpur; October/2016 - Rio de Janeiro; May/2017 - Panama City; October/2017 - Madrid and May/2018 - Buenos Aires) the work concluded with the final development of ISO 21401:2018 – Tourism and related services — Sustainability management system for accommodation establishments — Requirements [1]. The standard is aligned with Agenda 2030 and its implementation will help organizations achieve the SDGs, essentially by managing the main aspects and impacts of sustainability-related to the business.
2.3. Bibliometric study
To analyse the literature, a bibliometric study was conducted through the WoS database on November, 13th, 2019. In line with the focus of this study, the keywords “Fuzzy” and “Sustainable tourism” were used. It is worth noting that this report provides a particular snap-shot of publications in time because the number of records is frequently increasing and topics constantly expanding. It is also relevant to highlight that the identified publications depend heavily on the choice of keywords; therefore, not all the papers that match the keywords “fuzzy” and/or “sustainable tourism” may be directly related to the research. The results are as follows.
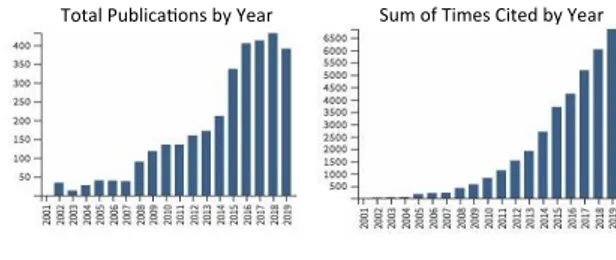
First, the keyword “fuzzy” included 217,525 publications in different areas. The areas with the most results were Computer Science Artifical Intelligence (72,333 records), Engineering Electrical Electronic (57,419 records), and Computer Science Theory Methods (30,980 records). Furthermore, the results reveal that the number of publications and citations both show an increasing trend. Secondly, the keywords “sustainable tourism” included 3,311 publications (88 in h-index) and 36,069 citations. Figure 2 shows the distribution of papers published and citations by year from 2002 to 2019. The results confirm a positive trend in both publications and citations, demonstrating an increasing interest in the topic.
Fig. 2. Total of publications and citations by year using keywords “Sustainable tourism”. Source: Web of Science (2019).
Finally, the keywords “sustainable tourism” and “fuzzy” included 23 publications (8 in h-index) and 198 citations. Figure 3 displays the distribution of the published papers and citations.
Fig. 3. Total of publication and citations by year using keywords “Sustainable tourism” and “Fuzzy”.
The results also show that the citations of these papers increased in the last two years. This demonstrates the presence of a knowledge gap on the two topics and the need for more research. For example, the most cited articles (fuzzy logic and sustainable tourism) cover topics such as: sustainable tourism indicators [26], environmental management decision-making [24], marketing strategies [18], sustainable tourism mobility [10], community-based tourism management strategy [12], and purchase intention [19]. However, there is still a research gap in regard to the forgotten effects on sustainable tourism.
2.4. Forgotten Effects Theory
In order to show how Forgotten Effects Theory [2] works, its methodological foundations are briefly presented. Its starts with two sets of elements
𝐴 = {𝑎𝑖 ⁄ = 1,2, … , 𝑛}, 𝐵 = {𝑏𝑖 𝑗⁄ = 1,2, … , 𝑚} 𝑗 There is an incidence of 𝑎𝑖 on 𝑏𝑗if the value of the characteristic function of belonging of the pair (𝑎𝑖, 𝑏𝑗) is valued in[0,1], that is to say:
∀(𝑎𝑖, 𝑏𝑗) ⇒ 𝜇(𝑎𝑖, 𝑏𝑗) ∈ [0,1]
The set of pairs of valued elements will defined as a “direct incidence matrix”, which shows the cause-effect relationships that occur with different graduations between the elements of set A (causes) and the elements of set B (effects):
↱ 𝑏1 𝑏2 ⋯ 𝑏𝑚 𝑎1 𝜇𝑎1𝑏1 𝜇𝑎1𝑏2 ⋯ 𝜇𝑎1𝑏𝑚 𝑀̃ = 𝑎2 𝜇𝑎2𝑏1 𝜇𝑎2𝑏2 ⋯ 𝜇𝑎2𝑏𝑚 ⋮ ⋮ ⋮ ⋮ ⋮ 𝑎𝑛 𝜇𝑎𝑛𝑏1 𝜇𝑎𝑛𝑏2 ⋯ 𝜇𝑎𝑛𝑏𝑚
This matrix can also be represented by the associated incidence graph, which in the event that its characteristic function of belonging was null, would eliminate the arc that joins the elements of set 𝐴 and the elements of set 𝐵 . This matrix can also be represented by the associated incidence graph, which
in the event that its characteristic function of belonging was null, would eliminate the arc that joins the elements of set 𝐴 and the elements of set 𝐵:
Using the concept of adhesion function: Γ{𝑎𝑖} = {𝑏𝑗⁄Γ−1{𝑏𝑗}= 𝑎𝑖}
𝑖 = {1, … , 𝑛} 𝑗 = {1, … , 𝑚}
The set of incidences that show us these three ways of presenting the cause-effect relations that take place between two sets of elements, represents the matrix of direct incidences (or also called first-order). They are those that have been considered at the moment of establishing the repercussions that some elements have on others. In fact, it is the first step towards establishing the model that will allow for the recovery of different levels of incidence that have not been detected, or simply forgotten. Suppose, for example, that the third set of elements appears: 𝐶 = {𝑐𝑘⁄ = 1,2, … , 𝑧} . Which is formed by elements 𝑘 that act as effects of the set 𝐵, that is to say:
↱ 𝑐1 𝑐2 ⋯ 𝑐𝑧 𝑏1 𝜇𝑏1𝑐1 𝜇𝑏1𝑐2 ⋯ 𝜇𝑏1𝑐𝑧 𝑁̃ = 𝑏2 𝜇𝑏2𝑐1 𝜇𝑏2𝑐2 ⋯ 𝜇𝑏2𝑐𝑧 ⋮ ⋮ ⋮ ⋮ ⋮ 𝑏𝑚 𝜇𝑏𝑛𝑐1 𝜇𝑏𝑛𝑐2 ⋯ 𝜇𝑏𝑛𝑐𝑧
Two incidence matrices are obtained, which will have the elements of set 𝐵 in common:
↱ 𝑏1 𝑏2 ⋯ 𝑏𝑚 𝑎1 𝜇𝑎1𝑏1 𝜇𝑎1𝑏2 ⋯ 𝜇𝑎1𝑏𝑚 𝑀̃ = 𝑎2 𝜇𝑎2𝑏1 𝜇𝑎2𝑏2 ⋯ 𝜇𝑎2𝑏𝑚 ⋮ ⋮ ⋮ ⋮ ⋮ 𝑎𝑛 𝜇𝑎𝑛𝑏1 𝜇𝑎𝑛𝑏2 ⋯ 𝜇𝑎𝑛𝑏𝑚 ↱ 𝑐1 𝑐2 ⋯ 𝑐𝑧 𝑏1 𝜇𝑏1𝑐1 𝜇𝑏1𝑐2 ⋯ 𝜇𝑏1𝑐𝑧 𝑁̃ = 𝑏2 𝜇𝑏2𝑐1 𝜇𝑏2𝑐2 ⋯ 𝜇𝑏2𝑐𝑧 ⋮ ⋮ ⋮ ⋮ ⋮ 𝑏𝑚 𝜇𝑏𝑛𝑐1 𝜇𝑏𝑛𝑐2 ⋯ 𝜇𝑏𝑛𝑐𝑧
The graphs of incidences associated 𝜇(𝑎𝑖, 𝑏𝑗)and 𝜇(𝑏𝑗, 𝑐𝑝) with each of the two matrices would be the following ones:
Where the numerical value 𝜇(𝑎𝑖, 𝑏𝑗)indicating the degree of incidence of 𝑎𝑖 on 𝑏𝑗 would be indicated above each arrow. From here, there are two incidence relations 𝑀̃ and 𝑁̃ that can be considered as fuzzy subsets of 𝐴𝑋𝐵 and 𝐵𝑋𝐶 respectively. The mathematical operator that allows establishing the incidences of 𝐴 on 𝐶 is the composition max-min, when from 𝑀̃and 𝑁̃ can be raised a new relation of incidence 𝑃̃ between the elements 𝐴 and 𝐶 defined by: 𝑃̃ = 𝑀̃ ∘ 𝑁̃ , where the symbol ∘ represents precisely the max-min composition. The composition of two uncertain relationships is such that:
∀(𝑎𝑖, 𝑐𝑝) ∈ 𝐴𝑋𝐶:
𝜇(𝑎𝑖, 𝑐𝑝)𝑀̃∘𝑁̃=∨𝑏𝑗(𝜇𝑀̃(𝑎𝑖, 𝑏𝑗) ∧ 𝜇𝑁̃(𝑏𝑗, 𝑐𝑝)) Therefore, it can be affirmed that matrix P defines the causality relations between the elements of the first set A and the elements of the third set C, in the intensity or degree involved in considering the elements belonging to set B.
Direct and indirect causal relationships: After a brief analysis of the methodology used to determine the incidence of relations considering three sets of elements, a methodology is presented whose aim is to uncover the cause-effect relations that are hidden when a causality study is conducted among different elements. The approach starts with the existence of a direct incidence relationship; that is, an uncertain cause-effect matrix defined by two sets of elements: 𝐴 = {𝑎𝑖⁄ = 1,2, … , 𝑛} which act as 𝑖 causes;𝐵 = {𝑏𝑗⁄ = 1,2, … , 𝑚} which act as effects 𝑗 and a causality relationship 𝑀̃ defined by the 𝑛 × 𝑚 dimension matrix:
[𝑀̃] = {𝜇𝑎𝑖𝑏𝑗 ∈ [0,1] 𝑖⁄ = 1,2, … , 𝑛; 𝑗 = 1,2, … , 𝑚} being 𝜇(𝑎𝑖, 𝑏𝑗) of the values the characteristic function of belonging of each one of the elements of the matrix 𝑀̃ (formed by the rows corresponding to the elements of the set - causes - and the columns corresponding to the elements of the set - effects).
It can be said, then, that the matrix 𝑀̃is composed of the estimates made around all the effects that the elements of set 𝐴 exert on the elements of set 𝐵. The
more significant this incidence ratio is, the higher the valuation assigned to each of the elements of the matrix. In this case, since it is assumed that the characteristic function of belonging had to belong to the interval[0,1], it is understood that the higher the incidence ratio, the closer to 1 the assigned valuation is. Conversely, the weaker a causal relationship between two elements is considered, the closer the corresponding valuation is to 0. It should be emphasized that this initial matrix 𝑀̃ is elaborated from direct cause-effect relationships; that is, from the first generation.
The objective of this study is based on obtaining a new matrix of incidences that not only reflects the direct causal relationships, but also those that, although not evident, exist and are sometimes fundamental for the appreciation of a phenomena. In order to achieve this objective, it is necessary to establish the devices that determine that different causes may have effects on themselves and, at the same time, take into account that certain effects may also give rise to incidences on themselves. For this reason, it is necessary to build two additional incident relationships, which include the possible effects derived from relating both causes to each other and effects on each other. These two auxiliary matrices are square matrices that are expressed as follows:
[𝐴̃] = {𝜇𝑎𝑖𝑎𝑗 ∈ [0,1] 𝑖⁄ , 𝑗 = 1,2, … , 𝑛} [𝐵̃] = {𝜇𝑏𝑖𝑏𝑗 ∈ [0,1] 𝑖⁄ , 𝑗 = 1,2, … , 𝑚} Matrix[𝐴̃] lists the incidence relations that can occur between each of the elements that act as causes and matrix [𝐵̃] lists the incidence relations that can occur between each of the elements that act as effects. Both [𝐴̃] and[𝐵̃] coincide in the fact that both are reflective matrices, that is to say:
𝜇𝑎𝑖𝑎𝑗 = 1 ∀𝑖=1,2,…,𝑛 𝜇𝑏𝑖𝑏𝑗= 1 ∀𝑗=1,2,…,𝑚
This means that an element, whether cause or effect, affects itself with the greatest presumption. Neither[𝐴̃]nor[𝐵̃] are symmetrical matrices, there is at least some pair of subscripts 𝑖, 𝑗 so: 𝜇𝑎𝑖𝑎𝑗≠ 𝜇𝑎𝑗𝑎𝑖 𝑎𝑛𝑑 𝜇𝑏𝑖𝑏𝑗≠ 𝜇𝑏𝑗𝑏𝑖 .
Once the matrices[𝑀̃] , [𝐴̃] and [𝐵̃] have been constructed, direct and indirect incidences are established; that is, incidences in which, at the same time, some cause or effect intervenes. For this the max-min composition of the three matrices is used: [𝐴̃] ∘ [𝑀̃] ∘ [𝐵̃] = [𝑀̃∗].
The order in the composition must always allow the number of elements in the row of the first matrix to coincide with the number of elements in the column of the second matrix. The result obtained is a new [𝑀̃∗] matrix that collects the incidences between second-generation causes and effects, or the initial causal relationships affected by the possible interposed incidence of some cause or effect. In this sense the matrice is:
↱ 𝑏1 𝑏2 ⋯ 𝑏𝑚 𝑎1 𝜇∗𝑎1𝑏1 𝜇 ∗ 𝑎1𝑏2 ⋯ 𝜇 ∗ 𝑎1𝑏𝑚 [𝑀̃∗] = 𝑎 2 𝜇∗𝑎2𝑏1 𝜇 ∗ 𝑎2𝑏2 ⋯ 𝜇 ∗ 𝑎2𝑏𝑚 ⋮ ⋮ ⋮ ⋮ ⋮ 𝑎𝑛 𝜇∗𝑎 𝑛𝑏1 𝜇 ∗ 𝑎𝑛𝑏2 ⋯ 𝜇 ∗ 𝑎𝑛𝑏𝑚
From this new matrix[𝑀̃∗], the difference between the second-generation effects matrix and the direct incidences matrix will allows for the determination ofthe degree to which some causality relationships have been forgotten or ignored: [𝐹̃] = [𝑀̃∗] − [𝑀̃]
↱ 𝑏1 … 𝑏𝑚 𝑎1 𝜇∗𝑎1𝑏1− 𝜇𝑎1𝑏1 … 𝜇 ∗ 𝑎1𝑏𝑚− 𝜇𝑎1𝑏𝑚 [𝐹̃] = 𝑎2 𝜇∗𝑎2𝑏1− 𝜇𝑎1𝑏1 … 𝜇 ∗ 𝑎2𝑏𝑚− 𝜇𝑎2𝑏𝑚 ⋮ ⋮ ⋮ ⋮ 𝑎𝑛 𝜇∗ 𝑎𝑛𝑏1− 𝜇𝑎𝑛𝑏1 … 𝜇 ∗ 𝑎𝑛𝑏𝑚− 𝜇𝑎𝑛𝑏𝑚 Using the degree of forgetfulness of some incident, it is possible to determine the element (cause or effect) that acts as a link. To do this, the steps made from the max-min composition of the matrices indicated in Figure 4 must be followed.
Fig. 4. The max-min composition of the matrices.
Finally, the higher the corresponding value between an element 𝑎𝑖 and an element 𝑏𝑗 of the characteristic function of belonging to the matrix [𝐹̃], the higher the degree of oblivion between 𝑎𝑖 and 𝑏𝑗 produced in the initial relationship and incidence. This means that the implications derived from incidents that are not considered or taken into
account in their proper intensity may give rise to erroneous or, at the very least, badly valued actions.
In the next section, the model is presented with an example applied to ST considering elements seen in the STC Program case study. The intention is to show how the application of the theory of forgotten effects can open the field of sustainable development in the tourism sector.
3. Application of Forgotten Effects Theory 3.1. Data processing
The data was processed using the FuzzyLog© software. It should be noted that this is a conceptual study based on modeling and simulation, with information from the case study of the “Serra do Cipó”, Brazil.
3.2. Modeling and Simulation Configuration
In order to apply the Forgotten Effects Theory, it was necessary to select a set of external and other elements related to ST. The criterion used to determine the external elements is based on the behaviors observed in a western economy and the application of the model to the tourism sector. To determine the elements that can act as effects, the sustainability requirements listed in standard NBR 15401 are chosen as a reference. The algorithm was applied as follows.
First, based on the group of experts’ validation, the set of 𝐶 elements was considered, these are supposed to be external to strict business control and act as causes that may have an impact on sustainability [3]. Table 2 presents the external elements.
Table 2 Causes (External elements) 1.Educational level
2.Purchasing power of the population 3.Natural resources
4.Cultural resources 5.Security level 6.Political stability 7.Social stability 8.Climate of the country 9.Energy price
10.Communication infrastructure 11.Legislation
©Anna María Gil-Lafuente.
12.Level of corruption 13.Economic stability 14.Transport infrastructure 15.Immigration/Emigration Relationship 16.Stakeholder engagement 17.Health services 18.Natural disasters
19.Institutional support and partnerships 20.Currency volatility
Secondly, search terms comprising the set of 𝐸 elements is considered, which represents the three dimensions (environmental, social-cultural and economic) and act as effects and can have an impact on business sustainability. Table 3 shows the sustainability requirements.
Table 3
Effects (Sustainability requirements) 1.Preparation and Assistance to Environmental Emergencies 2.Natural Areas, Flora and Fauna
3.On-site Construction Architecture and Impacts 4.Landscaping
5.Emissions, Effluents and Solid Waste 6.Energy Efficiency
7.Conservation and Management of Water Use 8.Selection and Use of Inputs
9.Local Communities 10.Work and Income 11.Working Conditions 12.Cultural Aspects 13.Health and Education 14.Traditional Populations
15.Economic Viability of the Enterprise 16.Quality and Customer Satisfaction
17.Customer Safety and Health and Safety at Work
Thirdly, a group of experts assessed the causes and effects of sustainability in companies. Semantic correspondence was used for 11 values, from 0 to 1 (the so-called endecadarian scale), with the help of the level of truth in the notion of incidence, where the value 0 means no incidence, and the value 1 means the greatest incidence.
In the “Direct Incident Matrix” [𝑀̃], the cause-effect relationships are shown in different degrees that are produced between the elements of set 𝐶 (causes) and the elements of set 𝐸 (effects), as presented in Figure 5.
However, this initial matrix [𝑀̃] is elaborated from the opinion expressed by experts, and represents direct cause-effect relationships, that is, first-generation. The objective is to obtain a new matrix of incidences that reflects not only the direct causal relationships but also those that, although they not evident, exist and are sometimes fundamental for the appreciation of the phenomena.
Fig. 5. Direct Incident Matrix.
To achieve this objective, it is necessary to establish the devices that make it possible for different causes to have effects on themselves and, at the same time, take into account that certain effects may also have an effect on themselves. For this reason, it is necessary to construct two relations of additional incidences that include the possible effects derived from relating causes to each other, on the one hand, and effects to each other, on the other. In order to achieve these results, the experts’ opinions is again requested to assess the existing incidences between the causes, establishing a square matrix [𝐴̃] and the matrix [𝐵̃] with the existing incidences among the effects. Once the matrices [𝑀̃], [𝐴̃]and [𝐵̃] have been constructed, direct and indirect incidences are established; that is to say, incidences in which, at the same time, some cause or effect intervenes. For this purpose, the max-min composition of the three matrices is carried out:
[𝐴̃] ∘ [𝑀̃] ∘ [𝐵̃] = [𝑀̃∗].
Figure 6 shows the composition max-min between [𝐴̃] and [𝑀̃].
Fig. 6. Composition max-min between [𝐴̃] and [𝑀̃].
The result obtained is a new matrix [𝑀̃∗] , cumulative effects matrix (Figure 7), which collects the incidences between second-generation causes and effects,or the initial causal relationships affected by the possible interposed incidence of some cause or effect.
Finally, the difference between the cumulative effects matrix and the direct incidences matrix allows for the determination of the degree to which some causality relationships have been forgotten.
The forgotten effects matrix is then obtained [𝐹̃] = [𝑀̃∗] − [𝑀̃]. Figure 8 shows the Forgotten Effects Matrix.
Fig. 7. Cumulative effects matrix[𝑀̃∗].
3.3. Results
The results presented in Figure 8 demonstrate that the cause-to-effect relationships that were initially rated 0 (i.e. no incidence) in the direct incidence matrix, showed a very strong incidence relationship of 0.9 at by the end of the forgotten effects matrix, with which it had been forgotten to consider an important incidence. This highlights those significant degrees that reveal some forgotten effects that can influence the sustainable development of tourism.
Table 4 shows the cause-effect relationships that presented very strong incidences of 0.9 and were recovered with the application of the model:
Table 4 Cause-effect relationships
Causes Effects
Educational level Natural Areas, Flora, and Fauna Security level Energy Efficiency Natural disasters Energy Efficiency
Fig. 8. Forgotten Effects Matrix [𝐹̃].
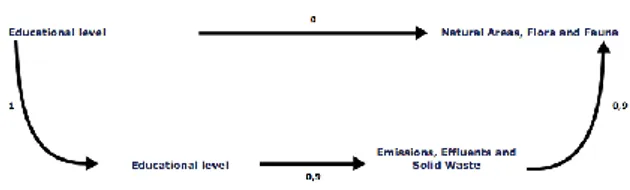
In order to show the elements that contributed the most to the indirect effects, the cause-effect relationships were analyzed in the matrix of forgotten effects. First, Figure 9 presents the incidence variation between Education level and Natural Areas,
Flora and Fauna (incidence C1, E2).
Fig. 9. Incidence variation (forgotten effect) between the Education level cause and the Natural Areas, Flora, and Fauna
effect.
This incidence ratio indicates that although an initial estimate of 0 was established in the Education
level incidence on Natural Areas, Flora, and Fauna,
in reality this ratio increases to 0.9 given that there is an interposed element (Emissions, Effluents and Solid
Waste) that potentiates and accumulates effects in the
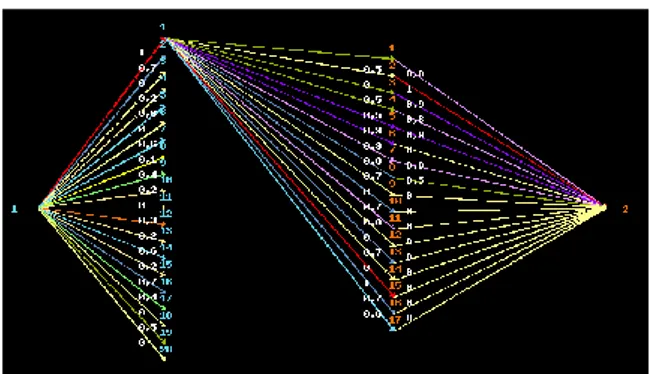
causality relationship. Figure 10 shows the total graph of incidences ofthe cause Education level on the effect Natural Areas, Flora and Fauna.
Fig. 10. Total graph of incidences of the cause Education level on the effect Natural Areas, Flora, and Fauna.
Secondly, Figure 11 shows the incidence variation between the Security level and Energy Efficiency (incidence C5, E6).
Fig. 11. Incidence variation (forgotten effect) between the Security level cause and the Energy Efficiency effect.
This incidence ratio indicates that, although initially an estimate of 0 was established in the
Security level incidence on Energy Efficiency, in
reality this ratio increases to 0.9 given that there is an interposed element (Economic Viability of the
Enterprise) potentiating and accumulating effects in
the causality relationship. Figure 12 shows the total graph of incidences ofthe cause Security level on the effect of Energy Efficiency.
Fig. 12. Total incident graph of the Security level cause on the Energy Efficiency effect.
Thirdly, Figure 13 displays the incidence variation between Natural disasters and Energy Efficiency (incidence C18, E6).
Fig. 13. Incidence variation (forgotten effect) between the Natural disasters cause and the Energy Efficiency effect.
This incidence ratio demonstrates that, although initially an estimate of 0 was established in the
Natural disasters incidence on Energy Efficiency, in
reality this ratio increases to 1 given that there is an interposed element (Energy price) potentiating and accumulating effects in the causality relationship. Figure 14 shows the total graph of incidences ofthe cause of Natural disasters on the effect of Energy
Efficiency.
Fig. 14. Total graph of incidences of the cause Natural disasters on the effect Energy Efficiency.
4. Discussion
In response to the suggestion by [4] that social theory can create a strategic relationship among stakeholders, the results of this study show that this relationship generated a positive impact, since several organizations, mainly SMEs, supported the program and were 100% committed in achieving the implementation of the sustainability requirements. Likewise, the results provide evidence to support the statement by [25] that case studies can help us to assess the interactions among the various dimensions of tourism, sustainable development and governance at specific junctures.
It is important to note that accommodation establishments are responsible for most of the direct land disturbances related to tourism [5] and for 21% of the sector’s CO2 emissions [7]; this reinforces the contribution of this manuscript in addressing ST in this type of tourism business. The study also provides evidence to support the assertion by [16] that sustainability is a matter of both local and global responsibilities. The creation of the ISO 21401:2018 strengthens the tourism sector’s concern for sustainable development [5], it also demonstrates the contribution of the pilot project implemented in the “Serra do Cipó” that has now become an international standard [1]. In line with [16], the main contribution of the manuscript is to reflect on the complexity of the tourism sector and to present an algorithm that can address uncertainty[8] and contribute to sustainable development [21].
5. Conclusion
In this paper, the studied subject is broad and complex, as there are multiple factors that directly and indirectly influence the achievement of sustainable tourism. Knowledge gaps have been identified through a bibliometric study. A case analysis on ST in Brazil has been conducted applying the forgotten effects methodology, which has made it possible to identify some elements that are not easily observable and may impact sustainable development. Also, an algorithm was presented to manage uncertainty and facilitate decision-making in ST.
It is important to recognize the limitations of this research in terms of the relatively small number of SMEs that participated in the analysis and the focus of the study on one country (Brazil), which means that the results cannot be generalized more broadly.
The contribution of this work consists in providing a causality model to the study of ST, because it is a useful tool in objective selection processes. It has been shown that the combination between the different elements that form a direct or indirect part of the business context decisively affect decision-making. Failure to consider forgotten or indirect causal relationships can lead to irreversible errors.
This article brings an important contribution that will support future lines of research in the field of incidence matrices and the application of the methodology of recovery of forgotten effects on the sustainable development of tourism. Future research
could also include studies in other countries with companies implementing ISO 21401:2018.
Acknowledgments
The authors wish to thank CENTRUM Católica Graduate Business School, University of Barcelona and Royal Academy of Economic and Financial Sciences, Spain.
References
[1] A. Garrido, Gestão da Sustentabilidade, (2019). [Online]. Available: https://alexandregarrido.blog/category/gestao-da-sustentabilidade/.
[2] A. Kaufmann and J. Gil-Aluja, Modelos para la investigación
de efectos olvidados. Vigo: Editorial Milladoiro, 1988.
[3] A.M. Gil-Lafuente and L. Barcellos de Paula, Una aplicación de la metodología de los efectos olvidados: los factores que contribuyen al crecimiento sostenible de la empresa,
Cuadernos Del CIMBAGE, 12 (1) (2010), 23–52.
[4] B. Bramwell, Governance, the state and sustainable tourism: A political economy approach, Journal of Sustainable
Tourism, 19 (4–5) (2011), 459–477.
[5] C. Hunter, Sustainable tourism as an adaptive paradigm,
Annals of Tourism Research, 24 (4) (1997), 850–867.
[6] C. Michael Hall, Policy learning and policy failure in sustainable tourism governance: From first- and second-order to third-order change?, Journal of Sustainable Tourism, vol.
19 (4–5) (2011), 649–671.
[7] D. Scott, P. Peeters, and S. Gössling, Can tourism deliver its ‘aspirational’ greenhouse gas emission reduction targets?,
Journal of Sustainable Tourism, 18(3) (2010), 393-408 .
[8] E. Vizuete Luciano, A. M. Gil-Lafuente, A. García González, and S. Boria-Reverter, Forgotten effects of corporate social and environmental responsibility, Kybernetes, 42 (5) (2013), 736–753.
[9] F. Blanco-Mesa, A. M. Gil-Lafuente, and J. M. Merigó, New aggregation operators for decision-making under uncertainty: an applications in selection of entrepreneurial opportunities,
Technological and Economic Development of Economy, vol.
24 (2) (2017), 335–357.
[10] F. Melissen and K. Koens, Adding researchers’ behaviour to the research agenda: bridging the science–policy gap in sustainable tourism mobility, Journal of Sustainable Tourism,
24 (3) (2016), 335–349.
[11] G. Moscardo, Mindful visitors: Heritage and Tourism, Annals
of Tourism Research, 23 (2) (1996), 376–397.
[12] H. G. T. Olya, E. K. Shahmirzdi, and H. Alipour, Pro-tourism and anti-tourism community groups at a world heritage site in Turkey, Current Issues in Tourism, 22 (7) (2019), 763–785. [13] Instituto de Hospitalidade, CTI/DT/01 Método de implantação
da norma: Meios de Hospedagem - Requisitos para a sustentabilidade, Salvador (2004).
[14] Instituto de Hospitalidade, PCTS – Programa de Certificação de Turismo Sustentável (2006).
[15] J. Elkington, Cannibals with Forks: The triple bottom line of 21st centuryThe triple bottom line of 21st century, Alternative
[16] J. Saarinen, Traditions of sustainability in tourism studies,
Annals of Tourism Research, 33 (4) (2006), 1121–1140.
[17] J. Will M. Bertrand and J. C. Fransoo, Operations management research methodologies using quantitative modeling, International Journal of Operations & Production
Management, 22 (2) (2002), 241–264.
[18] M. Kozak and D. Martin, Tourism life cycle and sustainability analysis: Profit-focused strategies for mature destinations,
Tourism Management, 33 (1) (2012), 188–194.
[19] N. Pappas, The complexity of purchasing intentions in peer-to-peer accommodation, International Journal of Contemporary Hospitality Management, 29 (9) (2017), 2302–
2321.
[20] R. Buckley, Sustainable tourism: Research and reality, Annals
of Tourism Research, 39 (2) (2012), 528–546.
[21] R. Hansmann, H. A. Mieg, and P. Frischknecht, Principal sustainability components: empirical analysis of synergies between the three pillars of sustainability, International
Journal of Sustainable Development & World Ecology, 19 (5)
(2012), 451–459.
[22] R. Santos-Lacueva, S. A. Clavé, and Ò. Saladié, The vulnerability of coastal tourism destinations to climate change:
The usefulness of policy analysis, Sustainability
(Switzerland), 9 (11) (2017), 1-19.
[23] R. Sims, Food, place and authenticity: Local food and the sustainable tourism experience, Journal of Sustainable
Tourism, 17 (3) (2009), 321–336.
[24] S. Arsić, D. Nikolić, I. Mihajlović, A. Fedajev, and Ž. Živković, A New Approach Within ANP-SWOT Framework for Prioritization of Ecosystem Management and Case Study of National Park Djerdap, Serbia, Ecological Economics, 146, no. October 2017, (2018), 85–95.
[25] S. Gössling, Global environmental consequences of tourism,
Global Environmental Change, 12 (4) (2002), 283–302.
[26] T. H. Lee and H. P. Hsieh, Indicators of sustainable tourism: A case study from a Taiwan’s wetland, Ecological Indicators,
67 (2016), 779–787.
[27] World Tourism Organization, 2017 International Tourism Results: the highest in seven years, UNWTO World Tourism Barometer, 16, no. January, (2018), 1–7.
[28] World Tourism Organization, International Tourism Highlights, 2019 Edition, World Tourism Organization (UNWTO), Madrid, Aug. (2019).
![Fig. 1. Implementation method [13].](https://thumb-eu.123doks.com/thumbv2/123dokorg/2973646.27658/4.892.466.787.320.541/fig-implementation-method.webp)