Ph.D. School in Earth, Environmental and Resources Sciences (DiSTAR) - XXXI Cycle
Multi-component and multi-source approach to model subsidence
in deltas. Application to Po Delta Area
Ph.D. Thesis
2018
Candidate:
Eleonora Vitagliano
Tutor:
Prof. Rosa Di Maio
Co-tutors:
Prof. Domenico Calcaterra Prof. Umberto Riccardi
ii
Acknowledgements Acronyms
Abstract
Introduction . . . 1
1. Land subsidence: State of the art . . . 3
1.1. Land subsidence: effects, monitoring and causes . . . 3
1.1.1. Subsidence effects & risks . . . 3
1.1.2. General aspects of subsidence monitoring tools . . . . 7
1.1.3. Subsidence monitoring and reference vertical datum . . . . 9
1.1.4. Subsidence causes . . . 11
2. From classical methods to a new multi-component and multi-source approach for studying land subsidence . . . 15
2.1. Current techniques for measuring subsidence: Time series analysis . . . 15
2.1.1. Interferometry Synthetic Aperture Radar . . . 16
2.1.2. Continuous Global Positioning System . . . . 19
2.2. Classical study approaches . . . 22
2.2.1. Data to Source . . . . 23
2.2.2. Residual to Source . . . . 26
2.2.3. Peering Approach . . . . 29
2.3. A new multi-component and multi-source approach . . . . 30
2.3.1. Main features and limits of the proposed procedure . . . 31
3. Application of the proposed approach to the Po Delta . . . 38
3.1. Land subsidence in Po Delta . . . 38
3.2. Geological setting . . . . 42
iii
3.4.2. Step 2: Multi-disciplinary and multi-methodological comparative analysis . . . 66
3.4.3. Step 3: Modelling of the main physical processes . . . 76
4. Conclusions . . . 94
References. . . . . . 97
List of figures . . . 111
iv
I would like to express my deepest gratitude to my advisor, Prof. Rosa Di Maio, for her continuous guidance on the PhD research, she supported all the research phases with precious and thorough discussions about methodologies and contents. My thanks also go to Prof. Calcaterra, he had constant thrust in my scientific work. I am grateful to Dr. Umberto Riccardi, he was available with a kind and continuous support through suggestions and insights. I am also especially grateful to Dr. Ester Piegari, she contributed to significant discussions on the research project. I am indebted to Dr. Emilio Norelli (Eni): with his scientific curiosity and irony, he made me go deeper in the research topics. My sincere thanks also go to Prof. Pietro Teatini and Prof. Frederic Masson, they kindly revised my thesis providing insightful and encouraging comments to improve the topic development. I also thank all those who support me in several phases of the research: Prof. Nicola Scafetta helped me to deal with climate aspects; Dr. Chiara D’Ambrogi (ISPRA), Dr. Leonardo Piccinini (Unipd), Dr. Carlo Donadio (Unina) and Prof. Henk Kooi (Deltares), they favourably cooperated during the modelling phase. Professor Kooi offered me the internship opportunity in Deltares, at the Institute of Applied Research in Utrecht, and led me to the study of the relation between groundwater flow and subsidence. I bring back memories of the relevant discussions had in Deltares also with Dr. Gilles Erkens and Dr. Ger de Lange and of the kind hospitality of all the staff. Thanks to Proff. Vladimiro Achilli, Massimo Fabris, Mario Floris, and their Research Group of Padua University, their availability in sharing geodetic data and discussing criticalities, their support on cartographic tools and their suggestions on various topics were essential to carry on the application study. I am grateful to Eng. Ermanno Tronchin for his wide and deep scientific expertise and human availability, to an anonymous geo-technician of the Po Delta for the key suggestions on sea-land relationship and to Eng. Claudio Chattarin for the brain storming on geotechnical topics and for the research material. I thank the specialists of Public Institutions who provided me basic information on the Po Delta: in particular, Dr. Paolo Severi (Regione Emilia Romagna), Dr. Stefano Tosini and Dr. Matteo Bozzolan (Consorzio di Bonifica del Delta del Po) and Dr. Alessandro Bondesan (Consorzio di Bonifica Pianura di Ferrara).
Finally, I would like to thank also Payal and Rolando, who helped me to deepen the understanding of some geophysical topics, and Ileana and Maria, who kindly supported me in the editing phase. Special thanks to my family, they cheer for the project, following the study evolution and giving also scientific advice.
v
BP Before Present
CGPS Continuous Global Positioning System CMA Centered Moving Average
CPT Coherent Pixel Technique DEM Digital Elevation Model DInSAR Differential InSAR
EDM Electronic Distance Measurement Height ESA European Space Agency
ETRF European Terrestrial Reference Frame GB-InSAR Ground-Based InSAR
GIS Geographic Information System GNSS Global Navigation Satellite System GPS Global Positioning System
IAHS International Association of Hydrological Science IGS International GNSS Service
InSAR Interferometric Synthetic Aperture Radar IPTA Interferometric Point Target Analysis ITRF International Terrestrial Reference Frame LIDAR LIght Detection And Ranging
LGM Last Glacial Maximum LOS Line Of Sight
MBES Multi Beam Echo Sounder MLE Maximum Likelihood Estimator PWD Paleo-Water Depth
PPP Precise Point Positioning PSs Permanent Scatterers PSD Power Spectral Density
PSI/PSInSAR Persistent Scatterers Interferometry PSL Paleo-Sea level
vi
RMT Radioactive Marker Technique SBAS-InSAR Small BAseline Subset InSAR
SIMS Subsidence Integrated Monitoring System SMPS Stanford Method for Persistent Scatterers SPG Seabed Pressure Gauge
SRTM Shuttle Radar Topographic Mission TLS Terrestrial Laser Scanning
UNESCO United Nations Educational Scientific and Cultural Organization WA Wavelet Analysis
WTC Wavelet Transform Coherence XWT Cross Wavelet Transform
vii
This thesis focused on the definition of a study approach able to deal with the complexity of the land subsidence phenomenon in deltas. In the framework of the most up- to-date multi-methodological and multi-disciplinary studies concerning land subsidence and targeting to predict and prevent flooding risk, the thesis introduces a procedure based on two main innovations: the multi-component study and the multi-source analysis. The proposed approach is a “multi-component” procedure as it investigates, in the available geodetic datasets, the permanent component apart from the periodic one, and, at the same time, it is a “multi-source” approach because it attempts to identify the relevant processes causing subsidence (sources) by a modelling based on multi-source data analysis. The latter task is accomplished first through multi-disciplinary and multi-methodological comparative analyses, then through modelling of the selected processes.
With respect to past and current approaches for studying subsidence phenomena, the developed procedure allows one to:
i. overcome the one-component investigation, improving the accuracy in the geodetic velocity estimate;
ii. fix the “analyses to modelling” procedure, enhancing qualitative or semi-quantitative procedures that often characterize the “data to source” and the “residual to source” approaches;
iii. quicken the source validation phase, accrediting the relevance of the source on the basis of the analysis results and before the modelling phase, differently from the “peering approach”, which validates the source on the basis of the model findings.
The proposed procedure has been tested on the Po Delta (northern Italy), an area historically affected by land subsidence and recently interested by accurate continuous geodetic monitoring through GNSS stations. Daily-CGPS time series (three stations), weekly- CGPS time series (two stations) and seven sites of DInSAR-derived time series spanning over the time interval 2009 – 2017 constituted the used geodetic datasets. Several meteo/hydro parameters collected from fifty-seven stations and wide stratigraphic-geological information formed the base for the performed comparative analyses. From the application of the proposed procedure, it turns out that the periodic annual component highlighted in the continuous GPS stations is explained by two water mass-dependent processes: soil moisture mass change, which seems to control the ground level up-or-down lift in the southern part of the Delta, and the river water mass change, which influences the ground displacement in the central part of the Delta. As it concerns
viii
1
Introduction
Reliable estimation of land subsidence is crucial in deltas and coastal areas, where the effects of climate variability (e.g., frequent and intense rain storms, peaks in river discharge and sea level fluctuations), coupled with natural or anthropogenic land sinking, represent serious factors of inundation and flooding risk. Over the past 25 years the number of large floods in Europe has increased (Kundzewicz et al., 2013), likely due to intensification of rainfalls and inadequacy or man-made changing of river morphologies and geometries appropriate to contain the higher peak-flow discharges. The significant cost in terms of human and economic losses caused by vulnerability of the Italian landscape to flooding events (e.g. Po Plain, 1951: 84 victims; Firenze, 1966: 35 victims) has stressed the importance to establish cause-effect relationships underlying the observed phenomena. Undoubtedly, downward ground movements favour flooding processes, but understanding the causes of these movements is a challenging task due to the high number of variables involved in the natural and anthropic processes and to their complex interplay.
Today, the integration among terrestrial and space geodetic techniques, such as Global Navigation Satellite System (GNSS), Interferometry Synthetic Aperture Radar (InSAR) and high precision levelling, allows an accurate continuous or discrete monitoring of land subsidence over urban areas, rural lands and vegetated zones. When the expected magnitude of the target physical process is small and, thus, the relative geodetic signal is elusive, a realistic estimate of uncertainties in geodetic observations becomes fundamental. For instance, very accurate geodetic observations are needed to deal with studies aimed at separating current-day tectonic from other contributions (e.g. sediment compaction) or at properly interpreting subsidence driven by fluid withdrawals from that generated by natural drainage variations. Moreover, the tectonic and anthropogenic signals can be overlapped by Earth’s surface deformations, caused by loading processes due to hydrological dynamics and natural mass re-distribution within the atmosphere-ocean systems. All these signals, which are characterised by different spatial and spectral features, can be recorded as temporal coordinate variations at permanent GNSS terrestrial stations.
In general, many site-position time series exhibit a linear trend plus seasonal oscillations of annual and semi-annual periods, frequently masked by the superposition of several correlated or uncorrelated noise sources (Bock and Melgar, 2016). Although periodic components observed in the geodetic signals affect the estimate of the subsidence rates and have to be recognized and properly modelled (e.g. Bos et al., 2010), nowadays the studies for prediction and prevention of subsidence-associated risks calculate
2
the linear rates on the basis of “data to source” and “residual to source” approaches (Dong et al., 2002), which not contemplate periodic components. Conversely, the studies focused on retrieving active tectonic processes remove the seasonal components from the original geodetic data on the basis of statistical models and rarely apply the “peering approach” (Dong et al., 2002), which allows to quantify influence, distribution and magnitude of individual processes and to understand the main mechanisms affecting the geodetic time series.
Differently from the mentioned approaches, herein a multi-component and multi-source procedure is proposed for individuating the physical mechanisms that better explain both the linear and the seasonal components, clearly exhibited by the geodetic time series. The proposed approach is component”, because it investigates the linear component apart from the seasonal ones, and is “multi-source” in the sense it allows to define the key processes (sources) causing subsidence. This innovative approach is structured in steps based on multi-methodological and multi-disciplinary analyses, and on modelling of multiple processes.
The thesis is organized as follows: in Chap. 1 an overview is given on effects, occurrences and causes of the subsidence phenomena. Therein, crucial aspects are addressed, such as the integration among different monitoring techniques and the need of a proper vertical datum for making the different geodetic observations consistent and comparable. Then, the geodetic time series analysis is reported on, bearing in mind the importance of discriminating between permanent (or inelastic) and periodic (or elastic) ground displacements. Chap. 2. presents first a synthesis on the nowadays multi-methodological and multi-disciplinary procedures for studying land subsidence at regional scale. Then, the new approach is presented and discussed, pointing out specific aspects and limitations. Afterwards, Chap. 3 deals with the case study of the Po Delta, an area historically affected by land subsidence, where a continuous GNSS network operates and differential InSAR-derived time series are available. Finally, the conclusions synthetize the main results derived from the analytical and modelling phases applied to Po Delta and highlight the unresolved issues to carry on for future works.
3
Chapter 1
Land subsidence: state of the art
This Chapter describes the subsidence phenomenon according to the following frame: effects, observations and causes of subsidence. In particular, in the first part land subsidence is related to the human and environmental risk to point out the importance of its study. As the present PhD thesis is focused on delta systems, special emphasis is laid on the risk in coastal areas. The second part is devoted to the monitoring approach, fundamental for assessing subsidence, i.e. for orienting the damage prevention and mitigation. This part is not structured as a systematic review of the main monitoring tools, as it aims to highlight some crucial aspects of the integration among different monitoring techniques. A paragraph is also dedicated to clarify the reference levels of the measurements (normally corresponding to the mean sea level). In the third part the main processes governing both natural and anthropogenic subsidence are qualitatively described.
1.1 Land subsidence: effects, monitoring and causes
According to the most common definition given by Bates and Jackson (1980), subsidence is the "sudden sinking or gradual downward settling of the Earth's surface with little or no horizontal
motion”. It is a land lowering process, which tends to generate a depression in response to natural
and anthropogenic causes (Carminati et al., 2006).
Although subsidence is differentiated in sudden and gradual processes, only the second meaning is dealt with in this study. Therefore, the term “subsidence” hereinafter used indicates the slow deepening of the soil, amounting to few millimeters per year, and it is not referred to the instantaneous fall down of the soil that occurs, for example, in the case of a sinkhole.
1.1.1. Subsidence effects & risks
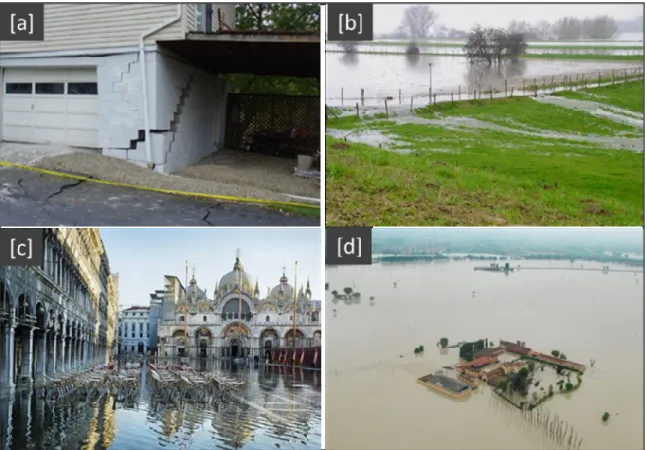
Subsidence constitutes a risk for human health and economic activities because the downward ground movement is accompanied by both deformations of natural and anthropic surface elements and formation of depressions (Fig. 1.1).
4
Figure 1.1 – Examples of effects associated to subsidence: (a) house cracking in America; (b) change in surface
water drainage in Holland; (c) landward incursion of seawater in Venice, Italy; (d) flooding in Italy.
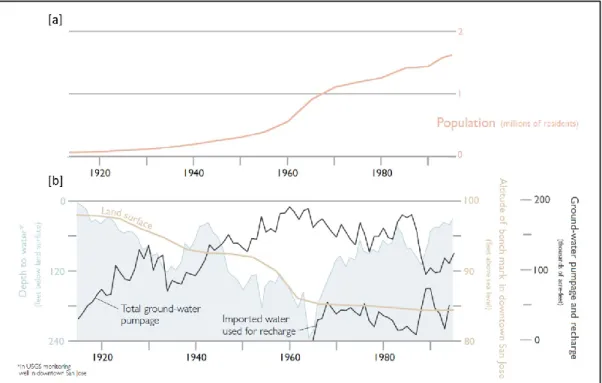
The awareness of the risk associated to subsidence, especially to the man-induced subsidence, grew during the last few decades thanks to the cooperation between international organizations and associations of engineers and hydrological scientists. In particular, the United Nations Educational Scientific and Cultural Organization (UNESCO) and the International Association of Hydrological Science (IAHS) promoted worldwide many working groups and symposiums on land subsidence, with the aim to gather scientists, engineers and authorities and to discuss the occurrence of land subsidence, including remedial measures (Barends et al., 1995). The proceedings of these meetings (Tison, 1969; IAHS, 1977; Johnson et al., 1986; Johnson, 1991; Barends et al., 1995; Carbognin et al., 2000; Zhang et al., 2005; Carreón-Freyre et al., 2010; Daito and Galloway, 2015) clarified the environmental impact and the social harm in relation to the anthropogenic causes. In particular, these and other studies showed the relation between human development/population growth and ground sinking (Dang et al., 2014), and highlighted the role of the natural resources exploitation with respect to the subsidence risk (Fig. 1.2). In fact, it is demonstrated that the intense and programmatic exploitation of the underground resources
5
increases the occurrence of hazardous events and the presence of goods and people within the area exposed to risk (Ubertini, 2009).
Figure 1.2 – Relation between population growth and water pumping at Santa Clara Valley (California, USA):
(a) population growth; (b) pumped/recharged water and subsidence (modified after Ingebritsen and Jones, 1999).
Environmental and social harms caused by subsidence can be differentiated according to the natural contest in which the phenomenon occurs, whether in inland or in deltas and coastal areas (Galloway, 2014). The main environmental impact of the inland subsidence is given by alteration of the ground-surface gradients and, consequently, by changes in the runoff of surface water, water infiltration and in the groundwater recharging and discharging of the natural system. The alteration of the hydrological features also impacts on the ecosystems including drainage of wetland areas and formation of floods and ponds in depressed zones. The main social harms are: damage to buildings, roadways, canals, aqueducts, wells and pipelines; changes in the gradient of drainage ways (e.g. sewers, canals/aqueducts and streams) and, furthermore, formation of floods and ponds (Galloway, 2014). Otherwise, the main environmental impact of the coastal subsidence is the marine transgression, i.e. the landward incursion of seawater, which drowns the saltwater and freshwater marshes, causing the alteration of marsh ecosystem and associated biotic communities. Moreover, during the last decades, the frequency of flood events in deltas due to both man-induced soil compaction and reduced sediment deposition on floodplains (associated with the levee systems
6
construction), has increased alarmingly (Schmidt, 2015). Galloway (2014) indicates that the “chief
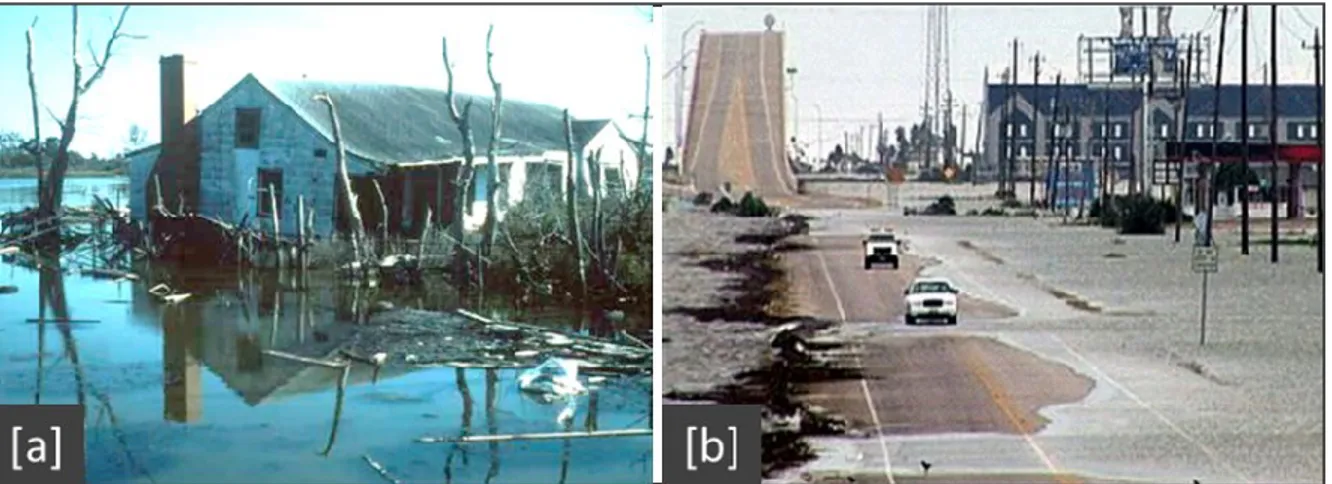
social harm in coastal subsidence-affected areas is coastal flooding from increased susceptibility to storms surges, but also flooding related to gradient reductions and reversals of streams and rivers coursing to the sea”. Figure 1.3 shows the storm effect in an urbanised US coastal area affected by
man-induced subsidence.
Figure 1.3 – Storm impact in some urbanised USA coastal areas: Houston (a) Galveston Baytown; (b)
Galveston Freeport.
Flooding risk on coasts is not only due to frequent and intense rainstorms that occur in subsiding areas, but also to subsidence associated with eustatic sea level rise (Yin et al., 2013). These two processes cause the rise of water level and potentially increase coastal or tidal flooding in the low-lying areas that were previously above high-tide level (Marfai and King, 2008). The induced anthropogenic subsidence may also alter the riverine flood hazard and the risk in flood-prone areas. Carisi et al. (2017) clarify that the presence of the levee systems favourites the growth of urban, industrial and agricultural areas on dyke-protected floodplains of the major rivers. These authors also suggest that “many existing embankment systems were built centuries ago; they prevented the
riverbed from gradually adapting to changes of topography induced by natural (and anthropogenic) land subsidence, and this may have resulted in significant modifications of the spatial distribution of flood hazard in the case of embankment failure”. Finally, several studies reveal that hydrodynamic
inundation modelling is a useful modern approach for assessing and mapping flooding risk and point out that reliable results are obtained by using high resolution Digital Elevation Model (DEM) and accurate representations of the major topographic discontinuities, such as artificial irrigation lines and roads/railway. More complete simulations are needed for taking into account the potential
7
effects of ground-lowering gradients, which alter the safety level of river embankments and hence the flood hazard (Carisi et al., 2017).
1.1.2. General aspects of subsidence monitoring tools
The reduction of environmental and human risks may be possible by improving the understanding of subsidence processes. Subsidence monitoring is finalised to achieve this objective and therefore is the key activity for assessing ground-surface motions. Monitoring methodologies, which aim at measuring and mapping ground displacements, spatial gradients and temporal rates of regional and local subsidence (Galloway et al., 1999), are implemented for satellite, aerial, terrestrial and bathymetric surveys (Tab. 1.1).
Survey Category Observation techniques Acronym References
Satellite Global Positioning System GPS Bock and Melgar (2016) Satellite Interferometric Synthetic
Aperture Radar InSAR Ye (2010); Tomas et al. (2014) Aerial LIght Detection And Ranging LIDAR Weitkamp (2005) Aerial Airborne SARs Hensley et al. (2009) Aerial Photogrammetry Glass (2013)
Terrestrial Precise levelling Schomaker and Berry (1981) Terrestrial Electronic Distance
Measurement traversing EDM Rüeger (1990) Terrestrial Terrestrial Laser Scanning TLS Pfeifer and Lichti (2004) Terrestrial Ground-Based InSAR GB-InSAR Monserrat et al. (2014) Terrestrial Vertical extensometer Riley (1986)
Terrestrial Gravity-based Torge (1986); Niebauer et al. (1995) Terrestrial Radioactive Marker
Technique RMT Brambilla (2000) Terrestrial Deep Compaction
Electromagnetic Monitoring Verdecchia et al. (2011) Terrestrial Micro-seismic array Maxwell et al. (2010) Bathymetric Sidescan sonar systems Klaucke I. (2018) Bathymetric Multi Beam Echo Sounder MBES Lurton (2002) Bathymetric Seabed Pressure Gauge SPG Stenvold et al. (2006)
8
Tab. 1.1 contains the list of traditional and innovative techniques for subsidence monitoring and the references for finding detailed explanations on technologies, methodologies or applications. A more specific explanation of InSAR and GPS techniques will be given in Par. 2.1. in relation to the time series analysis, while the use of geodetic data derived from these tools will be detailed in Chap. 3 associated to the Po Delta case study. In particular, two aspects of the subsidence monitoring are herein addressed: the relation between monitoring tools and size of investigated processes and the importance of integration among different techniques.
As it concerns the first aspect, the monitoring instruments investigate different dynamic and kinematic components of the subsidence mechanisms (Fig. 1.4) and vary for costs, accuracy, spatial/temporal resolution, data type (punctual, linear or areal) and frequency of measures (Tomas et al., 2014). Fig. 1.4 points out that each monitoring tool provides a partial contribution to the identification of the processes driving subsidence. It also suggests that the integration of different tools enhances a more complete subsidence risk assessment and it is crucial for extracting precision data (Fabris et al., 2014). As it concerns the data accuracy, the degree of accuracy of high-precision levelling is lower than 1 mm per km (Bitelli et al., 2015), while Persistent Scatterers InSAR (PS-InSAR) (see also Par. 2.1.1.) can provide high density of information points with precision on the order of 1–2 mm per year. Global Navigation Satellite System (GNSS) permanent stations (see also Par. 2.1.2.) are able to provide measurements of velocity components with an accuracy of about 1 mm per year in the vertical component, after at least 3 years of continuous acquisition (Kontny and Bogusz, 2012).
Figure 1.4 – Example of temporal and spatial scales resolution: (a) subsidence monitoring tools (modified
after Kourkouli, 2015); time scale is defined as: short-term (0-1 year), medium-term (1-20 years) and long-term (20-400 years); (b) processes contributing to subsidence (modified after Yuill et al., 2009); time scale is defined as: instantaneous (0-1 year), management (1-20 years), Anthropocene (20-400 years) and geologic (more than 400 years).
9
With respect to the second aspect, Bitelli et al. (2015) explain that subsidence monitoring in the last few decades has followed the development of technology in the land surveying disciplines. Referring to the three main monitoring techniques (geodetic levelling, GNSS and InSAR), these authors assert that: “Whereas geodetical infrastructures are available, the integration of the three
techniques can constitute the best approach to the problem, when datum definition and transformations permit all the datasets can be aligned into a single reference frame. […] The study of subsidence, in a similar way as any other geodetic phenomenon that is described with respect to a geographically defined reference frame, requires the definition of a geometrical and velocity datum to allow the comparison between observations collected at different times (epochs). This datum can be defined according to geometrical criteria or external measurements (i.e. GNSS time series), or according to more qualitative criteria related to geological setting”. Many scientific works
today deal with this aspect and suggest both methodological and technological solutions. For instance, Fabris et al. (2014), while integrating data from high-precision levelling, differential InSAR and multi-temporal GPS surveys in the Po Delta (North Italy), provide a data checking procedure and a geoid undulations modelling in order to better compare ellipsoid and orthometric elevations, especially when historical benchmarks may have been lost and/or replaced with other points, but at different elevations. In the same area, Dacome et al. (2015) adopt a surveying technology able to collect measures from different techniques (two SAR corner reflectors, a Continuous GPS station and a levelling benchmark) keeping the same reference level, in order to improve data congruence and facilitate the integration.
1.1.3. Subsidence monitoring and reference vertical datum
As already mentioned, the definition of vertical datum, namely the vertical component of the reference frame, is fundamental for integrating the elevation measures acquired by different tools. Furthermore, this aspect is important because the “mean sea level”, normally considered as reference level for the ground elevation, is not stable over time.
Monitoring tools usually refer elevations to three surfaces that approximate the Earth’s shape, defined as topography (or terrain), Geoid and Ellipsoid (Fig. 1.5a). Actually some observation techniques, mainly ground-based ones (e.g. hydrology, bore-hole stratigraphy, etc.), refer measurements to topography. The Geoid is a gravitational equipotential surface that is oriented everywhere perpendicular to the force of gravity and is used as a reference for heights above sea
10
level, while the Ellipsoid is a purely mathematical imaginary surface that approximates the geoid and it is used as a reference for geodetic latitude and longitude (Bock and Melgar, 2016).
Figure 1.5 – Aspects related to reference levels: (a) reference surfaces (from Bock and Melgar, 2016); (b) sea
level rise from 1993 to 2017 and main contributions (modified after NOAA 2018); (c) global sea level change through geological time (modified after Lambeck and Chappell, 2001); (d) schematic network from tidal to geodetic stations for acquiring absolute sea level data (Woodworth, teaching material).
Elevation on land, or topography, is measured with respect to the ‘mean sea level’ as represented by the geoid; over the oceans the topography is obtained by radar altimeters as the difference between the remotely sensed surface and the reference geoid determined by gravity measurements (Bock and Melgar, 2016). GPS observations are provided with respect to an Earth-centered global oblate ellipsoid rotating with the Earth (e.g. World Geodetic System 1984), and these measures are independent of gravity. GPS positions are expressed in terms of geodetic latitude, longitude and height above the reference ellipsoid WGS84. The height of the geoid relative to the reference ellipsoid is called “geoidal undulation”. It depends on the direction and intensity of gravity at any point and ranges between -105 m and 85 m over the Earth (Bock and Melgar, 2016). The spirit levelling and the satellite gravity observations provide the detailed global gravimetric model useful to realize the geoidal surface and the connection to GPS observations through the geoidal undulation.
As it concerns the “mean sea level”, global sea level data from 1901 to 2010 show a sea level rise rate ranging between 1.5 and 1.9 mm/yr(Stocker et al., 2014). These variations are classified according to changes in ocean volume/density and ocean mass (Bock and Melgar, 2016; IPCC, 2013).
11
Sea level changes, both globally and locally, resulting from changes in water density are called steric, and could be even related to deformation of the solid Earth for thermal expansion (thermos-steric sea level change). Global mean sea level change resulting from change in the mass of the ocean, as due for instance to the melting of land ice, is called barystatic. Both these processes are active today (Fig. 1.5b) and responsible of sea level changes of several hundred meters in the past millions of years (Fig. 1.5c). Lambeck and Chappell (2001) assume that the tectonic forces have induced changes through geological time in the ocean basin geometry, causing the main variations in the sea level. Conversely, during the Quaternary the periodic exchange of mass between ice sheets and oceans has been the dominant contribution to the sea level change.
It is worth to note that the estimate of the sea level rise may be apparent because the tide gauge stations are relative to a fixed point of the land, which is affected in many cases by subsidence or uplift. Satellite radar altimetry over the oceans provides a direct measurement of the sea surface (dynamic) topography and does not suffer from the susceptibility of sparse tide gauge measurements to vertical land motion. Otherwise, GNSS site position data from a global network of tracking stations are absolute with respect to a global terrestrial reference frame (ITRF) and can be also used to supplement and calibrate other observational systems including satellite radar altimeters, satellite gravimeters, and tide gauges (Bock and Melgar, 2016). Fig. 1.5d shows an ideal system for acquiring absolute measurements of sea level.
1.1.4. Subsidence causes
Defining the causes of the land subsidence is not an easy target because the subsidence is a complex phenomenon generally resulting from the contribution of different processes. Indeed, such processes, which are characterized by a specific origin and may act in different spatial and temporal intervals, can overlap giving rise to a single land movement effect, whose individual causes can hardly be discriminated. Moreover, these processes involve different geoscience disciplines (e.g. geology, geophysics, geothecnics, meteorology and hydrology) and thus a wide earth science knowledge is required for a proper analysis of the subsidence phenomenon. Therefore, the subsidence causes are herein not exhaustively dealt with, but only qualitatively described in accordance with the scientific knowledge achieved over the last fifty years.
With respect to the phenomenon complexity, land subsidence can occur by natural or anthropogenic drivers, which induce the onset of, or accelerate, natural processes (Galloway, 2014). The natural contribution is related mainly to geodynamic, sedimentological and climatic processes
12
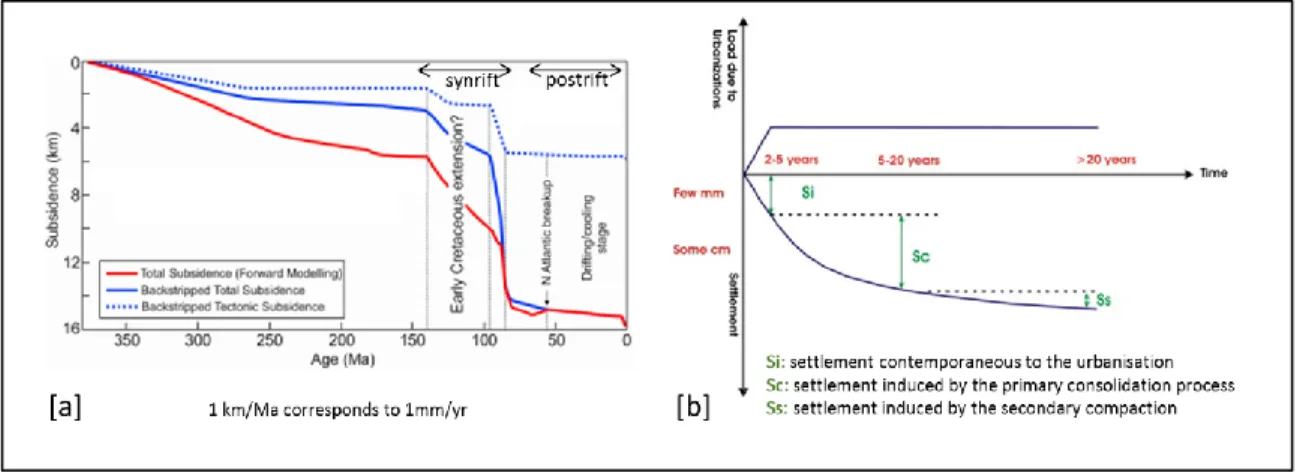
(Carminati et al., 2006), while the anthropogenic driver is mainly due to fluid (oil and gases) withdrawal and groundwater pumping (Poland, 1984; Dang et al., 2014). Land subsidence acts at local (from few to tens of km) or regional scale (from tens to hundreds of km): the natural causes may act at both scales (Johnson, 1991), while the anthropogenic causes act mainly at local scale. Finally, the processes responsible for the ground lowering act from short to long time (from years to millions of years) and the duration of the subsidence effect is strictly related to the origin of the process and its evolution. For instance, due to geodynamic processes, many basins show higher subsidence rates during the initial phase of basin formation (syn-rift) and lower rate in the following period (post-rift) (Fig. 1.6a). This “subsidence behaviour” is due to lithospheric stretching during the syn-rift phase and to thickening for thermal cooling during the post-rift (e.g., McKenzie, 1978). Another example refers to the soil mechanics (Fig. 1.6b) and regards the settlement due to consolidation (e.g., Terzaghi and Peck, 1967). In case of urbanization on recent alluvial deposits, the over-imposed loads induce settlement due to the combination of primary consolidation processes and secondary compression. Settlements ascribable to the primary consolidation process are largely greater than those ascribable to the secondary compression and relative to the viscous behaviour of very fine-grained soils and organic soils (Stramondo et al., 2008).
Figure 1.6 - Relevance of the time parameter in the processes causing subsidence: (a) subsidence in the
Træna Basin (Norway) due to geodynamics (modified after Zastrozhnov et al., 2018); (b) subsidence in the city of Rome (Italy) due to soil mechanics (modified after Stramondo et al., 2008).
Regarding the progressive understanding of the causes, a first significant description of the processes that govern subsidence is found in Prokopovich (1972; 1979): based on data collected in the US, the author classifies subsidence in “endogenic”, or caused by Earth’s interior processes, and “exogenic”, or caused by Earth’s surface processes (Fig. 1.7). Fig. 1.7 shows that the endogenic
13
processes are natural and fundamentally due to plate tectonics (e.g., top magma chamber that sinks as effect of partial chamber emptying, formation of grabens), while the exogenic mechanisms are both natural and anthropogenic (e.g. hydrocompaction, piezometric decline due to aquifer depletion, oxidation of organic particles, melting of ice).
Figure 1.7 – Subsidence classification according to Prokopovich (1979).
In the same period, many case histories on subsidence collected from engineering’s activity provided data useful for describing both natural and anthropogenic causes through qualitative and quantitative approaches. In particular, Allen (1984) indicates five different compaction causes: natural loading, drainage in clay and peat of low-lying areas, vibration during earthquakes, hydrocompaction due to low rainfall and fluid withdrawal. Moreover, Poland et al. (1984) differentiate the fluid extraction in three main types: withdrawal of oil, gas and associated water; withdrawal of hot water or steam for geothermal power; withdrawal of ground water. They also provide an accurate physical and mathematical description of mechanisms and properties (e.g. theory of the aquifer-system compaction, analysis of stresses causing subsidence, layers’ compressibility and storage characteristics). Moreover, in relation with agricultural issues, Glopper and Ritzema (1984) propose also the loss of soil particles as a result of the oxidation of organic matter and the leaching of mineral components. Such examples refer essentially to near-surface sediment compaction processes that, in many cases, act at local or reservoir scale.
As it regards the subsidence at regional scale, likely related to processes occurring at great depths, Allen (1984) mentions the subsidence due to lateral flow of plastic material (e.g., salt), while Royden and Keen (1980) study the rifting processes. In this regard, a great impulse in quantifying crustal and rifting processes and, consequently, tectonic subsidence, derives from the basin modelling activity performed in the petroleum industry. Such a kind of modeling starts to be used for exploring the sedimentary basin formation and for quantifying burial and thermal processes, which influence the hydrocarbon generation (Hantschel and Kauerauf, 2009).
14
Today, many studies reveal a good understanding of some anthropogenic and natural processes: for instance, Gambolati and Teatini (2015) present a thorough review on the relation between vertical ground motion and geomechanics due to extracted/injected fluids; Oude Essink and Kooi (2012) quantify at regional scale the effect of saltwater intrusion on groundwater system and on land subsidence; other authors address their researches on the interplay between subsidence rates and fault kinematics, or in general deal with land displacements in relation with tectonic and non-tectonic processes, on the basis of GPS and InSAR data (e.g. Fuhrmann et al., 2013; Peyret et al., 2013; Karakhanian et al., 2013). Beside these improvements, great attention is given also to man-induced processes (Fig. 1.8). In particular, among the main anthropogenic drivers, Galloway (2014) indicates: the oxidation induced by drainage, the induced erosion, the induced thawing of permafrost and the sediment starvation, although he stresses that the occurrence of subsidence in particular regions in the world depends on the distribution of the geological features (e.g. sediment types, rock dynamics) and on the anthropogenic subsidence that overlays the existing natural processes.
15
Chapter 2
From classical methods to a new multi-component and multi-source
approach for studying land subsidence in deltas
The complexity of the subsidence phenomenon described in Chap. 1 points out an essential item in the study approach: the cooperative effort among different disciplines during the phases of data collection, analysis and modelling (cfr. Allen, 1984). For this reason, in the following Chapter, the main focus is devoted to regional scale studies that better integrate aspects regarding different scientific fields (geodesy, geology, geophysics, soil mechanics, hydrology and meteorology).
2.1. Current techniques for measuring subsidence: time series analysis
Most of the subsidence studies can be led to the fundamental relation:
𝑆𝑚𝑒𝑎𝑠 = 𝐶𝑛+ 𝐶𝑎 , (1)
where Smeas indicates the subsidence measured by whatever monitoring tools, Cn and Ca are the
natural and anthropogenic components, respectively. Due to the temporal resolution of the geodetic data and the nature of the investigated process (see also Par. 1.1.2.), some studies identify the Smeas with a constant rate of ground lowering. This assumption is reasonable when the process
that causes subsidence is acting since long time without changing, like the geological processes that take place in thousands or millions of years. Meanwhile, there are some natural and anthropogenic mechanisms that cause non-uniform strains on the ground. For instance, Galloway (2014) states that the geological materials deform in response to natural and anthropogenic perturbations (e.g., natural tidal and atmospheric loading), while anthropogenic loads imposed on the land (e.g. built infrastructure) cause measureable elastic and non-elastic displacements.
In the next section, a brief description of geodetic time series analysis is given, as it allows to measure the subsidence discriminating the main components that contribute to the ground motions.
16
2.1.1. Interferometry Synthetic Aperture Radar
One of the techniques to detect the Earth’s surface displacements is the Interferometry Synthetic Aperture Radar (InSAR). It allows to obtain high resolution images from data acquired by side-looking radar instruments carried by aircraft or spacecraft (Curlander and McDonough, 1991). The basic concept of the interferometry is to combine pairs images, acquired in different dates, for generating a set of differential interferograms that contain information on the interferometric phase (Rosen et al., 2000; Hanssen, 2001). Differential interferograms comprise the ground displacement component, due to the different acquisition times of the two SAR images, plus other terms that contribute to the interferometric phase. According to Hanssen et al. (2001), the interferometric phase (ψint) can be expressed as:
𝜓𝑖𝑛𝑡 = 𝜓𝑓𝑙𝑎𝑡 + 𝜓𝑡𝑜𝑝𝑜 + 𝜓𝑚𝑜𝑣 + 𝜓𝑎𝑡𝑚𝑜𝑠 + 𝜓𝑛𝑜𝑖𝑠𝑒 , (2)
where ψflat is the flat-earth component related to orbit errors, ψtopo is the topographic phase
commonly referred to DEM error, ψmov is the phase change due to the pixel movement in the
satellite Line-of-Sight (LOS) direction, ψatmos is the difference in atmospheric phase delay between
passes due to atmospheric disturbances or artefacts and ψnoise is the phase noise due to both
variabilities in scattering and thermal noise. In particular, the effect of the topographic undulation needs to be corrected from the SAR backscatter images (Luckman, 1998; Sun et al., 2002; Soja et al, 2010) and the process of correcting for topography is sometimes referred to as differential InSAR (DInSAR) (Hooper et al., 2012). As shown in equation (2), the interferometric phase contains not only the ground displacement term, but also other components that needs to be isolated during the data processing because they could mask the ground displacement information (Fig. 2.1).
17
Figure 2.1 - Example of interferogram displaying co-seismic deformation due to Tohoku-oki earthquake –
2011 (Japan): (a) displayed interferometric phase, (b) displacements after processing (from Hooper et al., 2012).
Moreover, the degradation of the interferometric phase quality (decorrelation), which is due to the relative movement of the scatterers (e.g. change in land cover) or to the change in the sight direction of the radar platform, impact not-homogenously on the interferograms (Tomas et al., 2014). This aspect can be improved by selecting more reliable pixels from a set of interferograms, where decorrelation noise is minimised. In addition, signal can be also affected by other effects (e.g., small strain in plate motion), and this aspect can be solved by estimating the non-deformation signal through the combination of synthetic time series obtained from conventionally formed interferograms or by filtering (Hooper et al., 2012). The algorithms for the time series analysis, developed to better address these two aspects, are divided in two categories: Persistent Scatterers InSAR (PS-InSAR) (Ferretti at al., 2001) and Small BAseline Subset (SBAS) (Berardino et al., 2002). The former is based on measuring single and highly coherent permanent scatterers, the latter combines multiple interferograms using small geometric and temporal baselines and considers the sum of many independent small distributed scatterers. In addition, other techniques can be used to estimate the SAR-derived subsidence, such as the Interferometric Point Target Analysis (IPTA) (Werner et al., 2003), which is an implementation of the PS-InSAR technique, the Coherent Pixel
18
Technique (CPT) (Blanco-Sánchez et al., 2008), the Stanford Method for Persistent Scatterers (SMPS) (Hooper et al., 2004) and the SqueeSAR™ (Ferretti et al., 2011). In general, these techniques provide information on subsidence distribution, magnitude and kinematics, as well as on the data processing quality (Tomas et al., 2014). Furthermore, the InSAR data are measured respect to the LOS and are represented as maps, namely spatial distribution of displacement, either average rates (average displacement respect to the considered time period, expressed in mm/yr or cm/yr) or accumulated magnitude (total amount of subsidence with respect to the first SAR acquisition, expressed in mm or cm). Spatial resolution of the ground displacement data depends on the radar sensor and the processing algorithm: for instance, the amplitude criterion of pixel selection allows to keep the original resolution of the SAR image. The temporal resolution depends on the satellite revisiting period, which determines the availability of SAR images: short revisiting period improves the possibility to identify seasonal patterns (Fig. 2.2a). Data acquired in areas with high subsidence rates can be affected by aliasing effect, which occurs when the sampling frequency is too low and the motion between two dates is greater than the system resolution (half of the radar wavelet, λ/2). Finally, areas with waters and vegetation disperse the radar-emitted SAR signals and reduce the amplitude of the returned signals, while areas associated to urbanization or rock outcrops provide stable electromagnetic response over time (Fig. 2.2b).
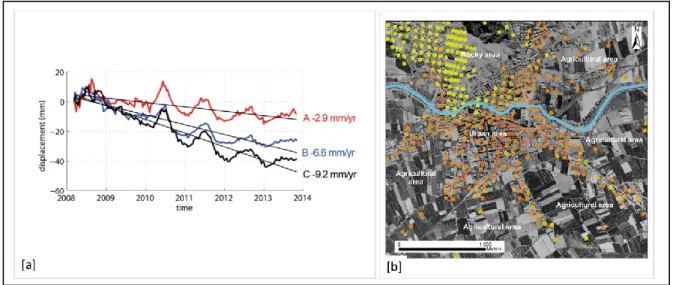
Figure 2.2 – Example of InSAR-derived displacement time-series. (a) Displacement patterns through time and
main rates in three different points (A, B and C); InSAR data are from TerraSAR-X interferometry at Jesolo, Italy (modified after Tosi et al., 2018). (b) High and low density of Permanent Scatterers (PSs) in urban/rocky and agricultural areas at Orihuela, Spain (modified after Tomas et al., 2014).
19
2.1.2. Continuous Global Positioning System
Another crucial monitoring technique for studying solid Earth and atmospheric processes that drive natural hazards, weather and climate on global and regional scales, is the Continuous Global Positioning System (CGPS). CGPS is part of the more generic Global Navigation Satellite System (GNSS), which provides autonomous geo-spatial positioning with global coverage and includes, for instance, the Russian GLONASS, the European Galileo, the Chinese BeiDou and other regional systems (Bock and Melgar, 2016).
During the acquisition stage, GPS data are sampled at a rate of, typically, 15 or 30 s, aggregated into daily files, stored in a standard international format (RINEX) and archived at several global data centers under the auspices of the International GNSS Service (IGS) and other geodetic organizations. During the data processing stage, the GPS data are analysed by two steps to provide station position estimates (X, Y, Z) in daily Earth-centered terrestrial reference frame (ITRF) positions. The first step corresponds to a relative or differential positioning approach, developed for positioning stations with respect to at least one fixed reference station, within a local or regional network. The second one is the precise point positioning (PPP), introduced for individually estimating local and regional station positions directly with respect to a global reference network, the same used to estimate the satellite orbits (Bock and Melgar, 2016). These processing strategies or algorithms are implemented in software packages, such as Bernese (Beutler et al., 2001), GAMIT-GLOBK (Herring et al., 2008) and GIPSY-OASIS (Webb and Zumberge, 1997). The coordinates can be then transformed into more intuitive local topocentric displacements in the North, East and Up directions (ΔN, ΔE, ΔU), with respect to station positions (X0, Y0, Z0) at an initial epoch t0. Afterwards, the time series analysis can
be performed component by component since the correlations between the local displacement components are small (Zhang, 1996).
As suggested by Bock and Melgar (2016), the time series of the individual component of the observed motion, y(t), can be described by the analytical model (Nikolaidis, 2002):
𝑦(𝑡𝑖) = 𝑎 + 𝑏𝑡𝑖+ 𝑐𝑠𝑖𝑛(2𝜋𝑡𝑖) + 𝑑𝑐𝑜𝑠(2𝜋𝑡𝑖) + 𝑒𝑠𝑖𝑛(4𝜋𝑡𝑖) + 𝑓𝑐𝑜𝑠(4𝜋𝑡𝑖)
+ ∑𝑛𝑔 𝑔𝑗𝐻(𝑡𝑖− 𝑇𝑔𝑗) + 𝑣𝑖
𝑗=1 , (3),
where ti, for i = 1, …, N, are the daily solution epochs in units of years and H is the Heaviside step
function. The first two terms are the site position, a, and the linear rate, b, respectively. Coefficients
20
next term corrects for any number (ng) of offsets, with magnitudes g and epochs Tg, and vi is the
error term. The data are cleaned using an outlier detection algorithm and modelled to create time series of position residuals, which are then examined for repeatability and noise content (Nikolaidis, 2002). After estimating the correlated noise amplitudes, the modelled time series is re-modelled to attain more realistic uncertainties of model parameters (linear trend, periodic terms, etc.). The noise analysis is based on the power spectral density (PSD) and the maximum likelihood estimator (MLE), while the final parameter estimates are obtained by several iterations through the weighted last squares algorithm. Fig. 2.3 shows an example of simultaneous estimation of linear trend, annual and semi-annual sinusoids with constant phase and amplitude in a CGPS time series. This procedure is generally indicated as the standard model.
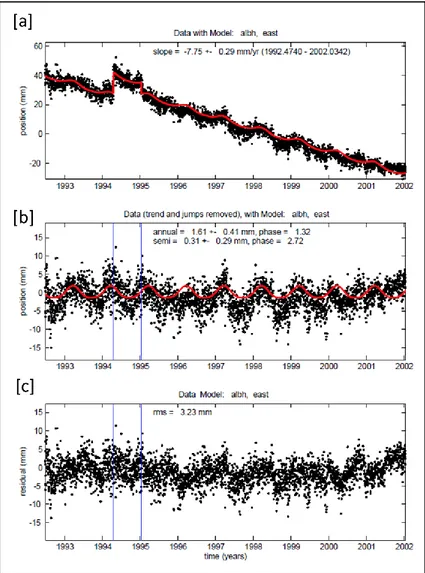
Figure 2.3 - Example of GPS time series analysis along East direction (from Nikolaidis, 2002): (a) standard
model (red line includes two instrumental offsets, linear and annual periodic signal), (b) daily solutions after linear trend and offsets removal, (c) final residual (model subtracted from data).
21
As it regards the physical processes exhibited within the geodetic time series, some of them, which have power mainly at diurnal and semi-diurnal frequencies (e.g. solid Earth tides and ocean tide loading), are modelled and reduced in the processing stage (Teferle et al., 2008). Other periodic terms with annual or semi-annual frequencies (e.g. atmospheric and hydrological loading, human exploitation) or transient (e.g. earthquakes) are partially modelled or are absorbed into the error term during the time series analysis stage. However, in this case the processes-related uncertainty is large or unknown, especially at local scale (Teferle et al., 2008).
The influence of the seasonal signals on the GPS-derived velocity estimates is studied by several authors: for instance, Blewitt and Lavallée (2002) demonstrate that the annual signals affect the velocity uncertainties, and that the velocity bias becomes negligible after ~4.5 years of data time span, while it increases if the time series are extended less than 2.5 years. With respect to the short time series, Bos et al. (2010) suggest estimating the noise properties in order to reduce the trend error. Santamarìa-Gomez et al. (2011) analyse the noise content within time series from 2.5 to 13 years long by testing several noise models and describe the bias velocity decreasing with the increasing of data time span.
With respect to the nature of the observed seasonal variations, Dong et al. (2002) reveal that the joint contributions from surface mass redistribution (atmosphere, ocean, snow, and soil moisture) are the primary causes for the observed annual vertical variations of site positions. Bos et al. (2010) mention the importance of having a methodology to estimate, for any station, how much the accuracy of the linear trend will improve when trying to subtract the annual signal from the GPS time-series by using a physical model. Finally, Davis et al. (2012) highlight that, during the time series analysis, neglecting the stochastic component, as in case of standard model, may significantly affect the velocity estimates and their uncertainties (Fig. 2.4).
22
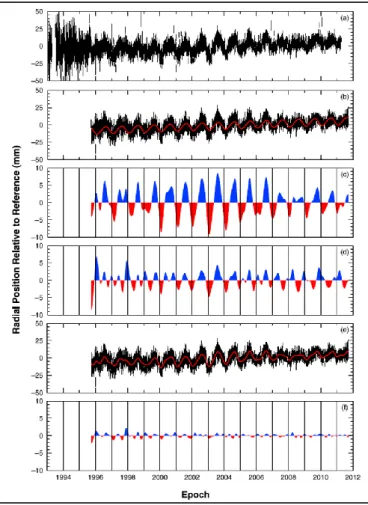
Figure 2.4 – Example of procedures for estimating the seasonal component: (a) original time series; (b) fit
using standard model (red line); (c) time series after band-pass filtering; (d) band-pass-filtered residuals to the standard model; (e) fit using stochastic model (linear Kalman filter); (f) band-pass-filtered residuals to the stochastic model (from Davis et al., 2012).
2.2. Classical study approaches
Recent studies have shown similar methodological approaches for understanding the origin of the regional subsidence that occurs in inland and coastal areas. For instance, Raspini et al. (2013) compare the displacement map derived from InSAR data with the geological information, while Higgins et al. (2014) superimpose paleo-river channels on the GPS-calibrated InSAR map, finding clear correlations with soil distribution. Sanabria et al. (2013) present a more quantitative approach by comparing geodetic map with piezometric levels and soft soil thickness. Karegar et al. (2016) use an analytical approach to compare GPS-derived displacements with groundwater and sediment thickness trends, and, in addition, account for Holocene sea level rise and model glacial isostatic adjustment. Smith et al. (2017) innovate the use of InSAR information and formulate a quantitative relation for obtaining hydraulic head from InSAR data and calculating the inelastic deformation due
23
to groundwater pumping. Therefore, all the most recent studies investigate one or two possible sources of the subsidence through qualitative or quantitative methodologies.
Briefly, the state of the art indicates three main methodological paths for understanding the physical processes (sources) by means of their geodetic measurable effects (data):
1) data to source; 2) residual to source; 3) peering.
These approaches were introduced and shortly described for the first time by Dong et al. (2002) within the pioneering paper that dealt with the seasonal variations observed in the CGPS time series. These authors analysed more than four hundred CGPS stations for retrieving the main natural causes of the annual signals, neglecting the anthropogenic processes. Differently from Dong et al. (2002), the mentioned methods are herein considered three valid procedures for investigating the sources of both periodic and permanent components to land subsidence, i.e. for identifying both natural and anthropogenic causes of subsidence. Specifically, we consider such approaches as a compass to orient the general recognition of strengths and weaknesses of each subsidence study, also within the Po Delta Area. The detailed description of these methods provided in the following paragraph represents the basis for better clarifying the innovative items of the new approach proposed in the current work (Par. 2.3.).
2.2.1. Data to Source
The main issue of this approach is the knowledge of the relevant sources, which means that some of the acting processes are known and monitorable with the geodetic data. Indeed, Dong et al. (2002) state that: “To explore the nature of the observed seasonal variations, an ideal approach is
to compare the observed values with the joint contributions from all relevant sources”. Starting from
this statement and extending it also to the permanent trend, the scheme of Approach 1 may be defined and organized in three main steps (Fig. 2.5): the first step corresponds to the time series analysis, which is necessary to recognize the components of the geodetic signal; in the second step, a component is selected according to available data and process comprehension; in the third step, the chosen geodetic component is compared with data or modelling results related to the relevant sources. The quoted authors also highlight some difficulties inherent in this methodology because
24
many relevant sources are not well understood. Therefore, it is clear that one of the approach limitations is the definition of the criteria for differentiating between relevant and not-relevant processes.
Figure 2.5 – Scheme of Approach 1: Data to Source.
An example of Approach 1 is traceable in the subsidence study proposed by Tosi et al. (2009). They focus on the velocity component of the vertical ground motion and use the subsidence rate derived from SIMS, which stands for Subsidence Integrated Monitoring System (Teatini et al., 2005), by integrating at regional scale five different monitoring techniques: spirit levelling, differential GPS, continuous GPS, InSAR and IPTA. With respect to the relevant processes, Tosi et al. (2009) investigate several sources and modify the following basic relation described by Carminati and Di Donato (1999):
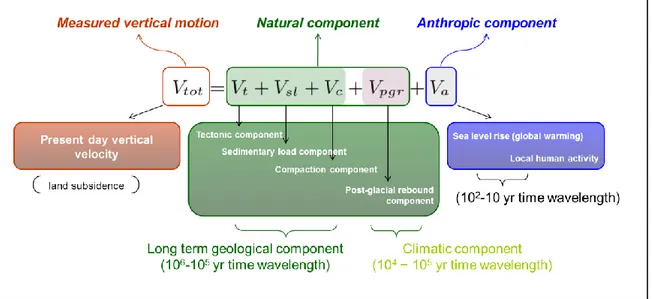
𝑉𝑡𝑜𝑡 = 𝑉𝑡+ 𝑉𝑠𝑙 + 𝑉𝑐 + 𝑉𝑝𝑔𝑟 + 𝑉𝑎 , (4), where Vtot is the measured total subsidence rate, Vt, Vsl, Vc and Vpgr are the natural contributions
related to tectonic, sediment loading, sediment compaction and post glacial rebound, respectively, and Va is the anthropogenic component. Based on Carminati and Di Donato’s findings (1999), Tosi
et al. (2009) consider relevant two of the natural terms of the proposed equation (4) (i.e., Vt and Vc)
and enlarge the contributions given by the anthropogenic sources (Va). On the basis of a “weight
criterion”, they neglect the terms Vsl and Vpgr because they reach rates around 0.2 - 0.3 mm/yr and
0.1 mm/yr, respectively, while the total natural subsidence rate ranges between 0.9 and 1.6 mm/yr. Moreover, the authors introduce the new equation:
25
where Vm, Vch and Vl are due to the anthropogenic component and, in particular, correspond to the
compaction due to mechanical processes (water withdrawal), chemical processes (salinization of clay pore fluid and peat oxidation) and load of buildings, respectively.
It is worth to note that in the study of Tosi et al. (2009) the sources of motion differentiate on the basis of the depth, specifically distinguished in deep, medium and shallow causes. The deep causes act at depths generally greater than 400 m (below mean sea level), in relation with the movement of the pre-Quaternary basement. The medium causes act at depths between 400 m and 50 m depending on the compressible clay layers and the groundwater withdrawals. The shallow causes, acting between 50 m and the ground surface, are related to: thickness and compressible behaviour of the Pleistocene-Holocene deposits; geochemical compaction due to the increase of salt concentration in the clayey sediments; oxidation of the outcropping organic soils drained by land reclamation. Therefore, the methodology used by Tosi et al. (2009) and synthetized in Fig. 2.6, although focused only on one component of the ground motion (velocity), can be considered as a reference point for regional studies on land subsidence in coastal areas, especially for the use of displacement data derived from an integrated monitoring system and for the broad investigation of anthropogenic causes. Contrarily, the comparison between measured ground displacements and source-related data needs improvement, since it is based on qualitative descriptions and semi-quantitative procedures. In fact, only the sediment compaction and the peat oxidation processes are dealt with analytical procedures or modelling (Gambolati et al., 2005), while the remaining sources are mainly qualitatively described. Afterwards, Tosi et al. (2009) improve some of the highlighted qualitative aspects: for instance, the subsidence due to primary compaction of Holocene strata is enhanced in Teatini et al. (2011), while the subsidence due to groundwater exploitation and to load of buildings is quantitatively described in Da Lio et al. (2013) and Tosi et al. (2013), respectively.
26
Figure 2.6 – Scheme of Approach 1 applied to the study of Tosi et al. (2009). In the column of relevant sources,
the green colour scale represents the depth-dependent processes (deep processes in dark green, shallow processes in light green).
2.2.2. Residual to Source
The main issue of this approach is the possibility to investigate the less known sources, i.e. the remaining ones, after the residual calculation. Indeed, according to Dong et al. (2002), the aim of the approach “is to subtract the contributions of the well determined or modelled sources from the
observation data first, then study the relation between the observed residual seasonal variations with remaining contributors”. Based on this description, it is possible to draft the scheme of
Approach 2 introducing five main steps (Fig. 2.7).
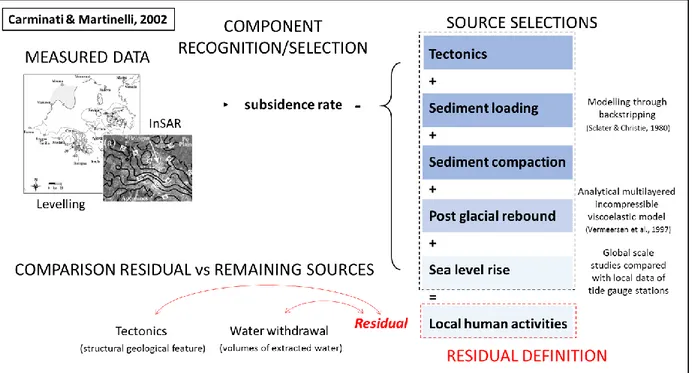
An example of this approach is found in Carminati and Di Donato (1999) and Carminati and Martinelli (2002). According to these authors, the equation (4) can be completed by considering also the two terms of the anthropogenic component, i.e.:
𝑉𝑡𝑜𝑡 = 𝑉𝑡+ 𝑉𝑠𝑙 + 𝑉𝑐 + 𝑉𝑝𝑔𝑟+ 𝑉𝑐𝑙 + 𝑉𝑙𝑜𝑐 , (6), where Vcl is the global contribution associated with the sea-level rise, due to climatic warming
27
As shown in Fig. 2.8, the geological and the anthropogenic components of the vertical movement act on different time scales (millions to thousands of years and hundreds to tens of years, respectively), and this peculiarity allows one to calculate separately each component.
Figure 2.7 – Scheme of Approach 2: Residual to Source.
Figure 2.8 – Components and contributions to subsidence according to Carminati and Di Donato (1999).
The methodology behind their study consists in retrieving the local anthropogenic contribution (Vloc)
by knowing the other terms of equation (6). In particular, the rate of the vertical ground movement is estimated through geodetic data, while the geological and climatic components are modelled by using the backstripping procedure (Sclater and Christie, 1980) and the analytical scheme based on
28
the normal mode technique (Vermeersen et al., 1997), respectively. The anthropogenic component of sea level rise related to the global warming is calculated by comparing trends derived from a global study with local patterns obtained from tide gauge stations. The results provided by the modelling are validated by using analyses of archaeological, palynological and paleontological data. Finally, the residual is compared with information related to aquifers (dating and chemical composition of groundwater, hydrogeological properties, years and volumes of extracted groundwater) and tectonics (active thrusts). Fig. 2.9 shows the scheme of Carminati and Martinelli’s methodology (2002) according to Approach 2.
As the study of Tosi et al. (2009), also the work of Carminati and Martinelli (2002) can be considered as a reference for evaluating regional subsidence through a multidisciplinary approach. The strength of their study is the quantification, through a modelling procedure, of the geological processes acting on the Earth’s surface but rooted in the lithosphere, while the limit is the simplified assumptions in the geological model (i.e., stratigraphic model) due to the poor data availability.
Figure 2.9 - Scheme of Approach 2 applied to the study of Carminati and Martinelli (2002). In the column of
source selections, the blue colour scale represents time-dependent processes (geological time processes in dark blue, anthropogenic and recent processes in light blue).
Afterwards, Carminati et al. (2003a; 2003b; 2006) improve the proposed methodology adding other considerations related to glacio-isostatic mechanisms or to geodynamics (subduction and thrusting). It is worth to note that their perspective of separating the time-dependent mechanisms,
29
is quite similar to the one proposed by Tosi et al. (2009) (see Par. 2.2.1.) concerning the depth-dependent mechanisms. Indeed, the former authors use a simplified model for computing the compaction process (one Quaternary layer) and consequently calculate only the “deep” compaction. The latter authors, by using a more refined stratigraphic geometry, determine the sediment compaction also at medium depth.
2.2.3. Peering Approach
In the third approach, defined by Dong et al. (2002) as “peering approach”, “the observed apparent
seasonal variations of site positions include contributions from various geophysical processes, as well as from errors in modeling seasonal effects. There is no single dominant contributor. It is difficult to obtain a clear picture of the observed seasonal variations by analysing the contribution from just a single source”. Specifically, the authors examine the influence, distribution and magnitude of
individual geophysical sources and define this approach “peering” because it is a way to depict the contributions of the comparatively well-known seasonal sources to get insight into the relatively poorly known contributors. In other words, based on the assumption that “a priori” there is no single source playing a dominant role, they compare the joint contribution of these geophysical sources with the observed seasonal variations. Fig. 2.10 shows a schematic representation of the “peering approach”, while Fig. 2.11 shows its application to the study presented by Dong et al. (2002). In this study, indeed, the authors evaluate the contributions from pole tide effects, ocean tide loading, atmospheric loading, non-tidal oceanic mass and groundwater loading. They model the pole tide geometrical correction through the formulas adopted by the International Earth Rotation Service (McCarthy, 1996) and calculate the oceanic response to surface pressure variations on the basis of the inverted barometer model (Dickman, 1988; Fu and Pihos, 1994). Furthermore, they compute the mass redistribution from variations of snow cover and soil moisture derived from the assimilated model (Kanamitsu et al., 1999; Roads et al., 1999). It is worth noting that the strength of their study is the quantitative comparison between data and modelling results, while its weakness is the absence of “indicators” driving the source choice before modelling.
After the peering approach, Dong et al. (2002) also apply the Approach 2 by removing the seasonal effects from the observations, in order to investigate the contributions from other sources (e.g., wet troposphere effects, bedrock thermal expansion, errors in phase centre variation models and errors in orbital modelling).
30
Figure 2.10 - Scheme of Approach 3: Peering Approach.
Figure 2.11 - Scheme of Approach 3 applied to the study of Dong et al. (2002).
2.3. A new multi-component and multi-source approach
Deltas and coastal areas are crucial places for life and economic development of a country, harbouring small towns and megacities, feeding agricultural activities and fishing, and hosting important ecosystems. These complex natural systems, although modified over the centuries by human interventions, are founded on a delicate water-land balance that strongly depends on climatic variability. For instance, it is well known that seasonal precipitations changes are spatially variable and depend on climate change over a region (e.g. IPCC, 2001) or that the sediment input to deltaic and estuarine areas is associated with episodic pulsing events climate-related, such as major storms events and river floods (Day et al., 2011). As described in the Par. 1.1.1, it is also clear that climate variability constitutes, as well as subsidence, a hazardous factor of the flooding risk, both in lowlands or coastal regions and in flat inland areas. The seasonal and periodic components of the