Scuola di Dottorato di Ricerca in Scienze dell’Ingegneria
Curriculum Ingegneria Biomedica, Elettronica e delle Telecomunicazioni
Activity Monitoring and Behaviour Analysis
Using RGB-Depth Sensors and Wearable
Devices for Ambient Assisted Living
Applications
Ph.D. Dissertation of:
Samuele Gasparrini
Advisor:
Prof. Ennio Gambi
Curriculum Supervisor:
Prof. Franco Chiaraluce
Scuola di Dottorato di Ricerca in Scienze dell’Ingegneria Facoltà di Ingegneria
Acknowledgments
I would like to express my gratitude to my advisor Prof. Ennio Gambi and his assistant Dr. Susanna Spinsante for their time, constant support and assistance during these years. You gave me the opportunity to grow as researcher and person.
I would also like to thank Automa, the company that has financed my Ph.D. grant.
I also thank Prof. Thomas Lind, Jonas Wåhslén and Ibrahim Orhan from the KTH-Royal Institute of Technology, who assisted me during the STSM in Stockholm.
Many thanks also to Prof. Francisco Flórez-Revuelta for his suggestions and support during the collaboration at the Kingston University. A special thank to the people in the SB1018 laboratory at Penrhyn Road campus, in particular for the cakes during the reading groups!
A thank goes to the colleagues and friends of the “Lunch group” of the Department of Information Engineering at the Polytechnic University of Marche; we have spent enjoyable moments together. A special thank to Enea Cippitelli who helped me during these years and without him most of the results would have not been achieved.
Finally, a thank to my family and my girlfriend Francesca. I cannot thank you enough for the support that you gave me during these years.
Ancona, January 2016
Sommario
Nei paesi sviluppati, la percentuale delle persone anziane è in costante crescita. Questa con-dizione è dovuta ai risultati raggiunti nel capo medico e nel miglioramento della qualità della vita. Il trend è ulteriormente rafforzato dal basso livello di nascite in Europa, che porterà all’incremento del rapporto tra popolazione anziana e attiva dal 27.8% al 50.1% nel periodo 2015-2060.
Con l’avanzare dell’età, le persone sono più soggette a malattie correlate con l’invecchiamento. Esse sono classificabili in tre gruppi: fisiche, sensoriali e mentali. Come diretta conseguenza dell’aumento della popolazione anziana ci sarà quindi una crescita dei costi nel sistema sanitario, che dovrà essere affrontata dalla EU nei prossimi anni.
Una possibile soluzione a queste sfide è l’utilizzo della tecnologia. In particolare, diversi servizi e dispositivi possono essere utilizzati a casa, per rendere la vita delle persone anziane più confortevole e allo stesso tempo indipendente. Questo concetto porta a dei vantaggi diretti, in primo luogo l’ospedalizzazione della persona viene ritardata il più possibile e permette alla stessa di continuare a vivere nella propria abitazione, tenendo conto delle sue abilità, limitazioni e condizioni fisiche. In secondo luogo, la tecnologia può essere utilizzata per supportare l’attività del caregiver, grazie alla possibilità di monitorare lo stato della persona senza la necessità di una visita diretta.
Questo concetto è chiamato Ambient Assisted living (AAL) e copre diverse aree quali ad esempio il supporto alla mobilità, la cura delle persone, la privacy, la sicurezza e le interazioni sociali.
In questa tesi, due differenti famiglie di sensori saranno utilizzate per mostrare le potenzial-ità della tecnologia nel contesto dell’AAL. In particolare verranno utilizzati due tipi di disposi-tivi: telecamere RGB-profondità e sensori indossabili. I sistema della prima famiglia, forniscono un’informazione molto utile essendo simile al sistema di visione umano. Sfortunatamente, se la camera è posizionata in una configurazione fissa, la ridotta area monitorata rappresenta una limi-tazione per questo tipo di sensore.
Per quanto riguarda l’altra famiglia di dispositivi, il problema precedente viene superato, dato che il dispositivo può essere sempre indossato dalla persona. Le limitazioni di questi sistemi si presentano però quando è necessario monitorare specifici comportamenti della persona che possono portare a situazioni di pericolo. Essi sono caratterizzati da fattori complessi che non possono essere identificati solo tramite l’utilizzo di sensori indossabili (accelerometri, giroscopi e barometri).
Negli ultimi anni, l’approccio data-fusion ha attirato l’attenzione della comunità scientifica. Combinando infatti le informazioni fornite dai dispositivi indossabili e dai sistemi video è possibile migliorare le prestazioni dell’applicazione finale. In questo lavoro, vengono trattate le problem-atiche di sincronizzazione tra i due tipi di sensori descritti in precedenza al fine di sviluppare tre applicazione nel contesto AAL.
di profondità sincronizzata con l’accelerazione fornita da un dispositivo indossabile per classificare le attività realizzate dalla persona in due gruppi: Activities of Daily Living (ADL) e cadute.
Al fine di valutare il fattore di rischio caduta negli anziani, la seconda applicazione usa la stessa configurazione descritta in precedenza per misurare i parametri cinematici del corpo durante un test clinico chiamato “Timed Up and Go”.
Infine, la terza applicazione monitora i movimenti della persona durante il pasto con l’obbiettivo di valutare se il soggetto sta seguendo una dieta corretta. In particolare, l’informazione di profon-dità viene sfruttata per riconoscere particolari azioni mentre quella RGB per classificare oggetti di interesse come bicchieri o piatti posizionati sul tavolo.
Abstract
Nowadays, in the developed countries, the percentage of the elderly is constantly growing. This situation is a consequence of improvements in people’s quality life and developments in the med-ical field. At the same time, the low fertility condition all over Europe will increase this trend, with forecasts that state a demographic old-age dependency ratio estimated to raise from 27.8% to 50.1% in the period 2015-2060. Because of ageing, people have higher probability to be affected by age-related diseases classified in three main groups: physical, perceptual and mental. There-fore, the direct consequence is a growing of healthcare system costs and a not negligible financial sustainability issue which the EU will have to face in the next years.
One possible solution to tackle this challenge is exploiting the advantages provided by the tech-nology. In particular, different services and devices can be used at home, in order to have a living space more suitable as well as comfortable for the independent life of the elderly and also to be adaptable to the users’ needs.
There are many positive advantages behind this living concept. First of all, the hospitalization of the elderly is delayed as long as possible and allows them to independently live at their home, considering their abilities, impairments and chronic conditions. Secondly, the technology could be a support to the caregiver’s activities, thanks to the possibility to monitor and assess the health status of the person without a need of a doctor’s visit.
This paradigm is called Ambient Assisted Living (AAL) and concerns different areas, such as mobility support, health and care, privacy and security, social environment and communication.
In this thesis, two different types of sensors will be used to show the potentialities of the tech-nology in the AAL. Low-cost RGB-Depth cameras and wearable devices will be studied to design affordable solutions. The first sensor family is very powerful as it provides information quite similar to the human vision which is used to understand the surrounding environment. Unfortunately, if the camera is in a fixed position, the finite covered area represents a limit for this sensor. On the other hand, the wearable devices can overcome the problem because the user always wears them. They integrate heterogeneous sensors like accelerometer, gyroscope and barometer to measure the most important parameters of the user’s health status. However, when the behaviours of the pa-tient must be monitored to infer possible risk situations, some limitations arise. They are due to the complex factors that characterize these movements which cannot be measured using wearable sensors only.
In the last years, the so-called data fusion approach has drawn the attention of the research community. Indeed, the combination of wearable and camera devices can improve the performance of the final application. In this work, the synchronization issues between RGB-Depth cameras and wearable sensors are addressed and three AAL applications are designed.
the target and the camera to monitor more people inside the covered area. The application will trigger an alarm when recognizes a fall. An alternative implementation of the same solution synchronizes the information provided by a depth camera and a wearable device to classify the activities performed by the user in two groups: Activities of Daily Living (ADL) and fall.
In order to assess the fall risk in the elderly, the second proposed application uses the previous sensor configuration to measure kinematic parameters of the body during a specific assessment test called “Timed Up and Go”. Finally, the third application monitor’s the user’s movements during an intake activity. Especially, the drinking gesture can be recognized by the system using the depth information to track the hand movements and the RGB stream of the camera to classify important objects like a glass placed on a table.
Contents
1. Introduction 1
1.1. Contest . . . 1
1.2. Background . . . 5
1.3. Thesis Outlines . . . 12
2. Camera Sensors and Wearable Devices: Principles and Characteristics 15 2.1. Range Imaging Solutions . . . 15
2.1.1. Pinhole Camera Model . . . 16
2.1.2. Stereo Vision System . . . 18
2.1.3. Structured Light . . . 20 2.1.4. Time Of Flight . . . 22 2.2. Kinect V1 . . . 25 2.3. Kinect V2 . . . 27 2.4. Wearable Device . . . 30 2.5. Recording Tools . . . 32 3. Synchronization Algorithms 41 3.1. Kinect and SHIMMER Time Synchronization . . . 41
3.1.1. BT Packets Synchronization with the Pc . . . 43
3.1.2. Transmission and Exposure Times for Kinect Streams . . . 44
3.1.3. Streams Synchronization . . . 47
3.2. Spatial Synchronization of RGB and Depth Frames . . . 48
3.2.1. Calibration Procedure . . . 49
3.2.2. Performances Evaluation . . . 52
4. Self-Organizing Networks 57 4.1. Self-Organizing Map . . . 58
4.1.1. Algorithm Description . . . 59
4.1.1.1. Initialization of the Network . . . 59
4.1.1.2. Competition . . . 61
4.1.1.3. Cooperation . . . 61
4.1.1.4. Reference Vectors Adaptation . . . 62
4.2. Extended SOM . . . 63
4.3. Growing Neural Gas . . . 66
4.3.1. Algorithm Description . . . 66
4.3.2. Topology Preservation . . . 69
5. Applications 71 5.1. Fall Detection Algorithms . . . 71
5.1.1. Depth Frame as Input Data . . . 72
5.1.1.1. Pre-processing Phase and Segmentation . . . 73
5.1.1.2. Blob Labelling . . . 74
5.1.1.3. Person Identification . . . 76
5.1.1.4. Person Tracking . . . 79
5.1.1.5. Fall Detection . . . 81
5.1.2. Depth Streaming and Compression . . . 83
5.1.3. Skeleton and Acceleration as Input Data . . . 88
5.1.3.1. Algorithm 1-2 . . . 90
5.1.3.2. Algorithm 3 . . . 90
5.2. Timed Up and Go Test . . . 95
5.3. Tracking Solutions for Intake Analysis . . . 102
5.3.1. Input Values to the Self-Organizing Algorithms . . . 103
5.3.2. Models Fitting . . . 106
5.3.2.1. SOM . . . 106
5.3.2.2. SOM_Ex . . . 111
5.3.2.3. GNG . . . 113
5.3.3. Hand Joints Recognition . . . 119
5.3.4. Tracking Performance . . . 123
5.3.5. Processing of the RGB Stream . . . 127
5.3.6. Drinking Recognition . . . 129
6. Conclusions 133 6.1. Contributions . . . 134
6.2. Future Research Directions . . . 135
6.3. Looking Forward: Trends and Technologies . . . 136
6.4. Publications . . . 137
Appendices 139 A.1. Morphological Operations: Erosion, Dilation, Morphological Gradient . . . 141
A.2. Edge Detection Algorithms . . . 142
A.3. Hough Transform - Linear and Circular version . . . 143
List of Figures
2.1. General scheme of the most important range imaging techniques used to calculate
the depth data. . . 16
2.2. Pinhole model. 3D view (a) and lateral views (b). . . 17
2.3. Frame corrections (a). Triangulation with a pair of rectified and aligned cameras (b). 19 2.4. Scheme of the direct TOF (a). Transmitted and received signals in the CWIM solution. 23 2.5. External view of Kinect V1 (a) and internal components: IR projector (green), RGB camera (red) and IR camera (yellow) (b). . . 26
2.6. External view of Kinect V2 (a) and internal components: RGB camera (red), IR camera (green) IR projectors (yellow) (b). . . 28
2.7. External view of the SHIMMER Rev. 1.3 and orientations of acceleration axes (a). Frontal (b) and back (c) views. . . 30
2.8. Recording tool for Kinect V1. . . 35
2.9. Recording tool for Kinect V2. . . 36
3.1. System configuration. The SHIMMER device sends packets to the Pc at 100 Hz while Kinect V2 streams information at approximately 30 fps. . . 41
3.2. Synchronization issues between Kinect and SHIMMER devices. tK and tSH axes show the instants when samples are generated, while the received data are repre-sented in tP caxis. . . 42
3.3. Samples at the Pc before (a) and after (b) the synchronization. . . 44
3.4. Scheme used to assess the RGB transmission time of Kinect V2. . . 45
3.5. Scheme used to assess the RGB exposure time of Kinect V2. . . 46
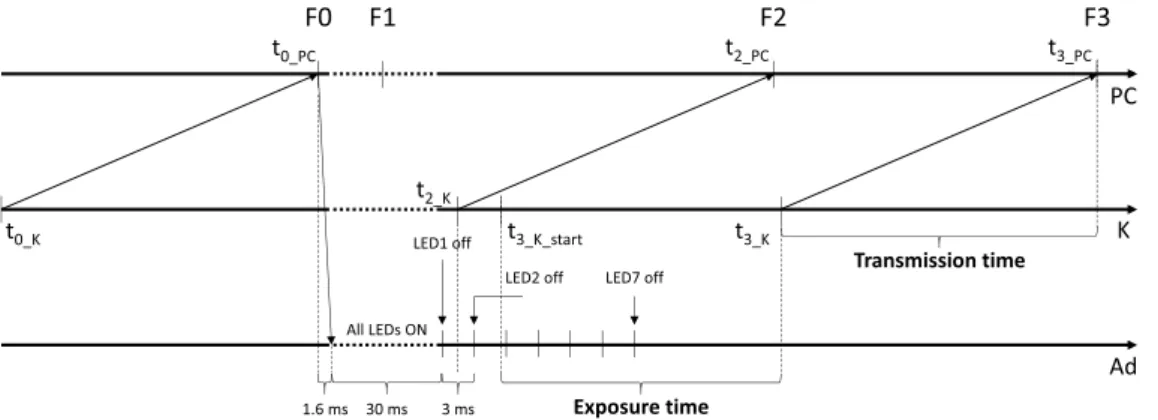
3.6. Scheme of the SHIMMER LEDs used to verify the synchronization with Kinect. . 48
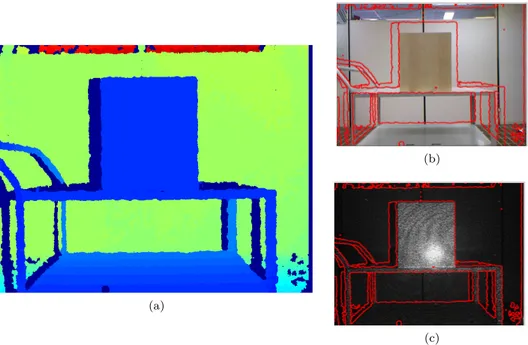
3.7. Depth frame (a). Depth frame’s edges superimposed to RGB (b) and IR (c) frames. 49 3.8. Reference systems for the depth and RGB cameras (a). Chessboard framed by the cameras (b). . . 50
3.9. A portion of the mapped depth frame of the target at 1 m from the cameras (a). Portion of the distortion-free RGB frame of the same scene (b). . . 54
4.1. Fundamental elements in a self-organizing network. . . 59
4.2. SOM algorithm steps. First input vector to the algorithm, identification of the BMU and neighbouring function (a), adaptive process (b). Second input vector to the algorithm, neighbouring function (c) and final network (d). . . 60
5.1. Pipeline of the fall detection algorithm. Original depth frame, floor pixels equaliza-tion and zero pixel filling, blob labelling and person recogniequaliza-tion, monitoring of the person distance from the floor. . . 73 5.2. The output of Sobel algorithm is used to separate blobs in the depth frame (a).
F F Sobel after the down-sampling (b). . . 74
5.3. Person identification in the CF (a) and side view of system set-up (b). . . 78 5.4. (k − 1)thFFs (a) and kth FFs (b) where a fusion situation affects the blobs of two
people. . . 79 5.5. Blob separation after fusion situation (a), final result for kth FFs (b). . . . 81
5.6. Height trend of cpP er during a simple fall situation where the person falls without
interaction with objects (a). Sequence of the most important CF s for a simple fall: the volunteer enters in the scene (b), falls (c), gets up (d) and leaves the monitored area (e). . . 82 5.7. Height trend of cpP er for a complex fall (a). Sequence of the most important CF s
for the second example of fall: the volunteer enters in the scene (b), sits near the table (c), falls (d), gets up and leaves the monitored area (e). . . 83 5.8. Description of the socket based architecture. The socket 1 is used for streaming
management whereas the other two are used to send and receive both depth and RGB streams. . . 85 5.9. Error frames for the same scene, with quality sets to 80 (a) and 20 (b). . . . 88 5.10. Results of the fall detection algorithm when decoded frames are used as input.
quality sets to 80 (a) and 20 (b). . . 88
5.11. System set-up. Position and orientation of the sensors (a), angle measured by the accelerometer (b) and skeleton joints exploited by the algorithms (c). . . 89 5.12. Trend for Jdif f (a) and distSP B (b). Person’s PC with highlighted in red the
estimated floor plane (c). . . 95 5.13. Macc (a) and the θx angle (b) calculated from the raw acceleration data provided
by the SHIMMER devices. . . 95 5.14. Sensors configuration in lateral view and torso’s tilt angle (a). Skeleton joints
ex-ploited by the algorithm (b). . . 97 5.15. y coordinate of the head during the TUG test (a). Orientation vectors of the person
in the turning phase (b). . . 98 5.16. PC of the person with superimposed the lower part of the skeleton and the feet
joints (a). Acceleration values, provided by the SHIMMER device, in the X-axis (b). 100 5.17. Processing of the depth frame. Raw data (a), zero-filling operation (b), foreground
pixels (c) and person’s PC (d). . . 103 5.18. Depth frame with the person’s direction (vrb) (a). Table’s border (Fcnt) and points
used to find the body direction (b). Table representation in the Hough domain (c), the four peaks represent the table’s borders. . . 104 5.19. Initial model in input to the SOM algorithm (a). General scheme of the algorithm
5.20. Displacement of nodes w1 w4 w10 w16 in the first three frames (a). Displacement
of node w4for the first epoch in frame no.1 (b). . . 109
5.21. Drift problem for the nodes w2-w4-w6. The triplet moves to the left shoulder’s PC (a). Result after the correction (b). . . 110
5.22. Adaptable box (a). The chair and the chest elements are selected (b). . . 111
5.23. Initial model (a) and adapted model (b) by the SOM_Ex algorithm. . . 112
5.24. PC in input to each test (a). QE in relation to N (b). . . 114
5.25. Example of inactive nodes. Network adapted to the last PC (a), current PC where the chair’s nodes become inactive (b). The black nodes model the last PC whereas the red squares represent the current network. . . 116
5.26. Trained network to the PC (a), corresponding blob in the depth frame (b). . . 118
5.27. Person’s PC (a). Head’s PC highlighted in green(b). Network provided by the GNG algorithm (c). . . 119
5.28. Algorithm used to find the hand nodes inside the network. Identification of the point wlim(a), the outlier nodes and the chest’s connections are deleted (b), identification of the hand joints (c). . . 121
5.29. Critical situations. Fusion between hand joints (a), closed loop for left arm (b). . . 122
5.30. Matlab tool used to find the ground truth. Plots for head (a), left hand (b) and right hand (c). . . 124
5.31. Error trends for the head (a), left (b) and right (c) joints for Dts_intake_1. . . . 125
5.32. Raw depth frame, where dishes on the table are not detectable (a). Depth frames with mapped RGB table, where a glass and a plate are visible (b). . . 128
5.33. Left and right hand-head joint distances during a test execution (a). A distance threshold is exploited to recognize the proximity of head and hand joints. At 490th frame, a drink intake action is reported. PC of 490th frame where the left hand is close to head (b). . . 130
5.34. Sequence of RGB frames, processed to recognize the presence of glasses. Glass detected in the initial RGB frame (a). The glass is then searched in frames where Distlf t or Distrgt are below the threshold: 350th frame (b) 490th frame (c) 600th frame (d). . . 130
5.35. Result scheme for tests from 1th to 20th (a). Result scheme for tests from 21th to 38th (b). The overlaps between “ground-truth” and “drinking event” labels denote the algorithm efficiency. . . 132
List of Tables
2.1. Most important differences between Kinect V1 and V2. . . 29
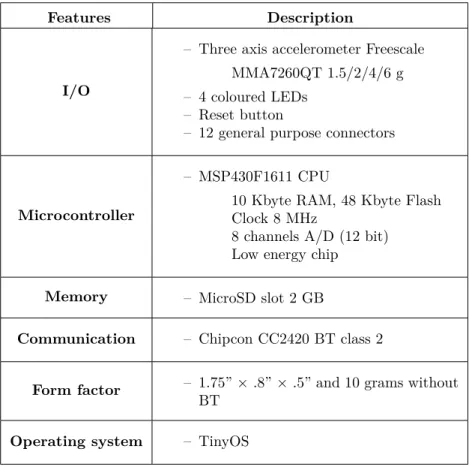
2.2. General properties of SHIMMER Rev. 1.3. . . 31
2.3. SHIMMER packet format. . . 37
3.1. Transmission/Exposure time for Kinect V1/V2 with 95% confidence level. . . 47
3.2. Mapping error [pixel] in top and right central configuration. . . 55
3.3. Mapping error [pixel] in top and right side configuration. . . 55
5.1. Object coordinates for each blob found by the clustering algorithm. . . 75
5.2. T rackingInfo data structure for kthF F s filled with the person/blob identifiers of (k − 1)th F F s. . . . 80
5.3. Rcmp and PSNR for the compression algorithm. . . 87
5.4. ADL and falls performed during the tests. . . 92
5.5. Algorithms performances evaluated in terms of sensitivity, specificity and accuracy. 94 5.6. Accuracy for each activity. . . 94
5.7. Parameters in output from the algorithm. . . 102
5.8. Selected parameter for SOM algorithm. . . 108
5.9. Parameters used for the SOM_Ex algorithm. . . 113
5.10. Selected parameters for GNG algorithm. . . 119
5.11. Mean and standard deviation for distance errors using Dts_intake_1. . . 126
5.12. ANOVA test results for (errpos,GN G, errpos,SOM) using Dts_intake_1. . . 127
List of Algorithms
4.1. GNG algorithm. . . 68
5.1. Blob labelling. . . 76
5.2. Description of algorithms 1-2. . . 91
5.3. Description of algorithm 3. . . 92
5.4. Code to find the TP. . . 105
5.5. Algorithm used to find the shoulder and hand joints. . . 121
List of Abbreviations
AAL Ambient Assisted Living
ADL Activities of Daily Living
AmI Ambient Intelligence
API Application Program Interface
BMU Best Matching Unit
BOF Beginning Of File
BT Bluetooth
CCD Charge-Coupled Device
CCS Camera Coordinate System
CMOS Complementary Metal Oxide Semiconductor
CRC Cyclic Redundancy Check
CWIM Continuous Wave Intensity Modulation
DCT Discrete Cosine Transform
EOF End Of File
EU European Union
FOV Field Of View
FRS Frame Reference System
GNG Growing Neural Gas
GUI Graphic User Interface
IDE Integrated Development Environment
NG Neural Gas
Pc Personal Computer
PC Point Cloud
SAR Socially Assistive Robot
SBI Suppression of Background Intensity
SDK Software Development Kit
SHIMMER Sensing Health with Intelligence, Modularity, Mobility and Experimental
Reusability
SOM Self-Organizing Map
SOM_Ex Extended Self-Organizing Map
TOF Time Of Flight
TUG Timed Up and Go
Chapter 1.
Introduction
1.1. Contest
The word “elderly” has generic meaning and the related age varies between the different countries. For example, in Europe a citizen is considered old if he is over 60, whereas in Japan the limit grows to 75. As defined by the World Health Organization (WHO) “there is no United Nations (UN) standard numerical criterion, but the UN agreed cut-off is 60+ years to refer to the older population” [1]. Laslett [2] introduced a specific classification for the elderly: from 65 to 80 years old they belong to the third age, while getting older than 80 they enter in the fourth age. In the first group people are usually enjoying their retirement in a healthy self-reliant and active health status. In the second group, the elderly have less independence and their physical condition starts to have biological and psychological complications. They reduce physical activities, have less appetite with a consequent weight loss and their mental capacity is day by day affected by chronic diseases.
The Department of Economic and Social Affairs (DESA) of UN states that in 2015 there are approximately 900 million people aged 60 or over, with a global share of 12 per cent of the popu-lation [3]. Most of the developed countries’ popupopu-lations are ageing and, although the demographic profile presents some differences from continent to continent, there are some significant similarities between these countries. According to this theory, in 2060 the number of people that belong to the third age will increase from 17.4% to 29.5% in Europe, from 13.2% to 21.9% in the USA, from 22.7% to 35.1% in Japan and from 8.2% to 29.5% in China [4]. This phenomenon will lead to impressive numbers: in 2060 there will be 2 billion people over 60 years old and only 440 million on China.
Even thought the European population is expected to increase about 5% from 507 million in 2013 to 523 million in 2060 [5], currently the old continent has the highest percentage of people aged 60 or over in its population [3] with a growing of approximately two million per year. In details, people over 50 will raise by 35%, whereas citizens aged from 65 to 80 years old will grow by nearly 40% between 2010 and 2030 [5] and finally the number of the elderly over 85 will triple by 2050.
On the other hand, in the old continent, there is also a low level of fertility issue. The replacement rate was 1.6 children per women in 2010-2015 and will grow to 1.8 by 2050 [3], but it is always below the natural value of 2.1 to achieve a total replacement of the population.
In the European Union (EU), the low fertility condition and the ageing of the population lead to an important change in terms of age dependency ratio. The most difficult condition is expected during the period 2015-35 when the so called “baby-boom” generation will retire. In particular, in the period 2015-2060, the share of young people (age 0-19) will remain close to 20% in the EU and the percentage of citizens aged from 20-64 will reduce from 61% to 51%. People in the third age will grow in share from 14% to 20%, whilst the fourth age group will rise from 5% to 10%. The old age dependency ratio, that is the ratio between the population aged 65 over the people aged 15-64, is estimated to increase from 27.8% to 50.1% [5]. Consequently, if today in the EU for a single person in retirement there are four “active” people belonging to the working-age population, by 2025 this ratio will start to drop to 3 and in 2060 it will be even 2 [5].
Due to the physical and mental disorders, people in third and fourth ages have a higher proba-bility to be affected by different types of age-related diseases than the younger population. Indeed, only 2.7% of the 25-34 population suffers of severely hampered compared to the 13.9% of people aged 55-64 and 39.1% of people over 85 [6]. These diseases are classified as physical, when related to motor disabilities that limit balance and mobility, or chronic such as heart disease, hypertension, chronic respiratory diseases, diabetes and heart failure. Perceptual diseases affect the senses such as sight and hearing. Finally, among the mental ones, the most important and spread are the Alzheimer and Parkinson’s diseases. For the first one, today people who suffer it are 26.6 million worldwide and they are expected to be 80 million in 2050 [7], whereas the Parkinson’s disease, according to WHO, affects about 3% of the population over 65 years old [8].
The aging population trend, the corresponding healthcare system costs and the pension system will increase in the future and the EU will spend almost 20% (4.1 percentage points of GDP) in the period 2010 - 2060 [5]. Therefore, there is a financial sustainability challenge facing the EU to maintain the current assistance level and in general the elderly quality life.
Nowadays, if possible, most of the elderly prefer to live in their own houses with their spouse or relatives. Care of them is usually the responsibility of the healthcare system, but due to the shortage of professionals of approximately close to 2 million workers by the year 2020 [5], the family members take the role of informal caregivers. It could be a very grateful and gratifying activity with the possibility of a personal grow. However, this also generates some negative consequences for the relatives of the recipient of care, such as emotional distress and frustration when they are not able to solve emergency situations, provoking a burnout as ultimate result. There are some drawbacks also in their job because of workplace disruptions, absenteeism and reduced work time to take care of the older adults, as well as a consequent salary reduction [9]. Sometimes a full-time job does not allow taking care of the parents and the elderly will not receive the adequate level of care. Therefore, the informal caregivers are often busy between their need and their responsibilities towards the elderly.
In the last years, there was an effort to solve these problems providing different services and devices to the elderly through dedicated technologies installed in the so-called “intelligent” home. This vision relies on the potentialities of pervasive information and communication technology (ICT) to make the house environment adaptable to the users’ needs. The Ambient Intelligence
(AmI) is used to denote this condition, where different technological and scientific contributions such as human-machine interactions (HMI), wearable/ambient sensors and behaviours analysis solutions are combined together to have a digital environment that changes along with the char-acteristics of the people who live inside it [10].
One of the most significant application of this paradigm is the Ambient Assisted living (AAL). Its aim is strongly related to the AmI, but it is finalized to improve the quality life of elderly people through a personal healthcare [11]. Considering their abilities, impairments and chronic conditions, the AAL allows the elderly to live independently in their home, for as long as possible in order to delay the hospitalization at the last part of their life. In this way, there are two advantages: the health care expenditure can be kept below the budget limits exploiting cost-effective solutions that use the ICT and, at the same time, the elderly can continue living in their preferred environment with their loved.
A complete definition of the AAL is given by Kung et al. [12]: “intelligent systems that will assist elderly individuals for a better, healthier and safer life in the preferred living environment and covers concepts, products and services that interlink and improve new technologies and the social environment”. Therefore, the system will address specific tasks such as:
– health and care: support elderly users during their Activities of Daily Living (ADL), such as dressing, grooming, bathing and eating [13]. At the same time, monitor chronic diseases that lead to different behaviours from the ADL or in general, use specific wearable sensors to control the health status of the patient (blood pressure, blood sugar and heart rate) [14]. It can also implement reminder functions to intake pills or rehabilitation session through serious game [15];
– privacy and security: promptly identify emergency situations directly related to the health status of the elderly, for example after a fall. The risks inside the living space are other examples of abnormal situations, i.e. stove-top left on or in general, appliances that are incorrectly used. In addition, the relatives or the caregivers will be alerted if the abnormal situation persists in order to solve the problem in the case that an automatic solution is not possible [16]. One of the most important characteristic that an AAL must comply is the “invisibility”. It means that the system will intervene only if it is really necessary, so that the user preserves his self-sufficiency;
– social environment and communication: monitor and establish interaction with other people inside/outside the home to prevent loneliness and improve social skills. Thanks to the ICT solution is possible to promote communication between the patient and the doctor, keep in touch the elderly and the family members who live away from them. The socially assistive robot (SAR) is another example of social interaction, in this case between the elderly and an interactive robot that reacts to human stimulus to address specific needs [17];
– mobility support: an AAL application can be used also to help the elderly outside their houses through orientation and navigation instructions to the final destination passing through the safest itinerary.
These are just some of the possible applications of the technology to the home environment that lead to more comfortable and suitable space for the independent life of the elderly.
To achieve this result the AAL paradigm cannot be seen as a single closed element, but it must realize a relationship network among heterogeneous partners. They belong to different areas such as medical, social, technological and business and they have high-level specifications which have never been combined in a single solution. These actors can be classified in four groups:
– primary: seniors or impaired citizens who are using the AAL applications;
– secondary: people close to the primary users (family members and relatives of the recipient of care, private or public caregivers and neighbours). They are the subjects who gain advantages from the direct use of AAL products [18];
– tertiary: stakeholders or in general the companies that provide services to the final user (medical professionals, small and medium-sized enterprises (SMEs), insurance companies, housing associations, service organizers, security companies);
– quaternary: private or public organisations and institutions that do not use directly the AAL solutions, but push the networking among the previous actors with grants and project funding (consortia, policy makers, non-governmental organizations, academia).
In order to promote the interaction between some of these subjects, the EU has been dedicated a considerable number of project calls in the sixth and seventh framework programmes, respectively in the periods 2002-2006 and 2007-2013. Today, their successor is Horizon 2020, the new framework programme on innovation and research with 80 billion budget from 2014 to 2020. It confirms the project vision of the EU in supporting the applications designed for the independent living of its citizens. In particular, the Work Programme 2016-2017 for Societal Challenge 1 related to Health Demographic Change and Wellbeing will try to work in this direction. The Active and Assisted Living Joint Programme (AAL JP) and its successor AAL JP2 are an applied research funding programmes focused on the AAL. Their aim is to design and develop innovative products that can be used to improve the wellbeing of the elderly. Especially, in the period 2008-2013 the AAL JP proposed six calls that produced around 130 projects funded with a total € 317.5 million by the public funding commitment [19]. An introduction of successful AAL projects is described in [20], of course this in not a complete review, but gives some information of the impact that this collaboration has in the elderly population of the EU.
These investments have the headline goal to promote a market growth of ICT technologies in the AAL area increasing job opportunities. This chance, called “silver economy” [21], refers to new industry sectors that provide specific products like smart home automation, remote health monitoring system and companion robots specifically tailored for the elderly. It is also pushed by the spending capacity of the Europeans over 65 that today is estimated over € 3K billion [22].
1.2. Background
When an AAL application must be implemented, among all context-aware systems (passive infrared (PIR) sensors, cameras, microphones, pressure sensors, floor sensors) the RGB camera is the sensor family that provides the richest semantic information to the algorithms designed to monitor the elderly during their daily life at home. However, one of the main limitation of these devices relies on the dependence of the raw data to the environment illumination where the sensor is placed. As a consequence, this often leads to a higher complexity in the algorithm that uses the RGB source. In addition, there is also a privacy issue if the raw data captured from specific rooms, like bathroom and bedroom, is not locally used, but streamed on internet from the private space to the remote processing centre. A possible solution is to encrypt the communication or partially modify the information through a protection method (obscuring or distorting) that directly works on the raw data [23]. In the recent years, the depth cameras have received interest as complementary alternative to the previous sensor. Instead of colour information, the depth frame stores in each pixel the distance between the camera and a specific point of the scene. This sensor can work well in dark rooms with poor light conditions and it is less intrusive than the RGB camera because, through the distance, the identity of the person is respected. Therefore, the acceptability and the privacy issues of this type of technology for AAL applications can be significantly increased [24]. However, as for the RGB sensors, some limits are still present. The information is limited by the field of view (FOV) of the camera, as well as if the monitored area is the entire house, in every room must be installed at least a camera. Another limitation of RGB/Depth technologies is the occlusion problem, for example a piece of furniture could partially cover the human shape.
An alternative to the video-based monitoring systems are the wearable devices which could be worn under or over the clothes. They host different sensors (accelerometer, gyroscope and barometer) in the same space and the measured data could also be directly elaborated inside the device system. When the computational costs of the algorithm affect too much the battery drain of the system, another choice is sending the data to an external unit using a dedicated wireless transceiver that is compliant with a specific wireless protocol (Bluetooth, ZigBee, Direct Wi-Fi, proprietary). The receiver is usually connected to the power line and this allows implementing more sophisticated analyses, not limited by a power constraint. In addition, in order to improve the performance, the receiver can collect samples from more than one wearable sensor worn by a person and process them using the same algorithm.
Compared with the camera-based system, the limited covered area is now overcome by the portability and therefore the sensor continues its work also outside the house, but at the same time, it is one of the main drawbacks of this technology. Taking into account that the device will be used for AAL applications, there could be an acceptability issue. Indeed, if the wearable device is cumbersome this can be discriminatory and the community could see the elderly as frail and vulnerable. Consequently, they could refuse to wear the system. Therefore, the device must be comfortable and as discreet as possible.
In the last years, the data-fusion approach has drawn the attention of the research community. The idea is to simultaneously use the data provided by heterogeneous sensors to improve the
al-gorithm performance. For example, when the application uses a vision-based sensor located on the wall together with an acceleration data provided by a wearable device, and in case that a piece of furniture occludes the person, the system can continue tracking the patient thanks to the information from the accelerometer. Of course, there could be synchronization issues that must be considered. They are due to the different sampling time on the devices and possible delays related to the wireless communication protocol used by the wearable solution.
A possible application of sensors previously described is for the automatic fall detection. As stated by the WHO, “A fall is an event which results in a person coming to rest inadvertently on the ground or other lower level”. Considering that one every three adults (28-35%) aged 65 or over falls each year and this percentage is higher (32-42%) for people over 70 [25, 26], fall is the most widespread and frequent domestic accident that the elderly undergo at their own houses. The causes of a fall are related to intrinsic (aging, Parkinson’s disease, neurodegenerative or balance disorders, vision, muscle impairments) and extrinsic factors (slippery floors, loose carpets, effects of medications, poor lighting, obstacles on stairways, clutter) [27]. Some precautions to reduce the probability of fall can be taken on the extrinsic factors while the intrinsic ones are more difficult to overcome.
Direct consequences of a fall are lacerations, tissue injuries, joint bone fractures, dislocations and head trauma [28]. Whereas long-term effects of a fall can lead to physical disability, mental shock like anxiety, depression and fear to fall again, reduction in quality of life, severe dependencies and, in some cases, the death. It has been proven that the severity of these consequences is also related to the response time of the first assistance. Indeed, when an elderly person remains on the floor for a long period of time (long-lie) due to his impossibility to get-up, the consequences could be hypothermia, dehydration, bronchopneumonia and pressure sores [29] and even a high probability to die within 6 months [30]. As confirmed by statistical offices of the EU28 and the European Economic Area (EEA), approximately 100 K people die per year due to serious consequences of a fall [31]. Therefore, it is strongly recommended a system to monitor elderly activities and trigger an alarm if a risk situation is recognized. At the same time, this type of service brings noticeable advantages not only to the final user, but also to health care system. For example, in terms of saving time, thanks to this support, nurses do not need to monitor the elderly for most of their time, but can assist them only during the emergencies.
The wearable devices were the first solution adopted to deal the problem. Different configurations are possible, for example Bourke et al. [30] placed tri-axial accelerometers in the thigh and the trunk of 10 volunteers. Whereas Kangas et al. [32] tested their algorithms with the data provided by the sensors set to the waist by an elastic belt, close to the body’s centre of gravity. However, as stated by Pannurat et al. [28], other configurations are possible (shoulder, head, wrist, armpit, foot, neck), but the most common position is the waist whereas a good trade-off between performance and comfort is the chest. Of course, more than one sensor in different position can be worn at a time [33], but if on one hand it will improve the performance of the system, on the other hand there is a reduction of the comfort.
classify the activities in two main groups: ADL and falls. The most important activities belonging to the first group are: walking, sitting, grasping an object from the floor and lying on the bed or sofa, whilst different falls are possible according to the fall direction: front, back, side (simple fall) and end up sitting (complex fall).
However, the automatic classification is not always possible and, when this happens, the system throws a “false alarm”. Indeed, this is not a trivial task because some ADL have similar features to falls. For example, in [32] most of the errors are due to the “lying down” movements because their acceleration peaks have similar trends in a fall. The features must account discriminative information such as velocity, body orientation and impact. Starting from the acceleration, the most used features are mean, standard deviation, acceleration magnitude and tilt angle between the sensor and the ground plane (or the gravity axis) [28]. The mean and the standard deviation are used to separate static and dynamic activities, whereas the magnitude highlights abnormal situations. Finally, the angle allows calculating the orientation of the body to understand if a person is lying on the floor, for instance after a fall.
In literature, the algorithms that exploit this information, to classify the activities between falls or ADL, are divided in two main groups: threshold-based (or rule-based) and machine learning approach. In the first one, a finite-state machine compares for each block a feature with the corresponding threshold and a fall is identified if all the conditions are true. For example, Kangas et al. [34] design three algorithms with different levels of complexity using three accelerometers placed at the wrist, the waist and the head. The checks implemented by the most complex algorithms use the information of pre-impact acceleration, velocity, impact peak and orientation of the body. A detailed review of the fall detection algorithms that use the acceleration information can be found in [28, 35].
The machine learning solutions use more sophisticated approaches. Different features (maximum, minimum, average, variance, FFT samples, autocorrelation sequences) are calculated starting from the raw data provided by the sensors and recorded during falls and ADL. The calculated values are respectively labelled as ADL or fall and equally distributed in two groups for testing and training operations. The training set will supply a machine learning algorithm and its performances are evaluated by the testing group. Özdemir et al. [33] use samples from six devices placed in different positions of the body to calculate, for each test, the previous features around the acceleration peaks only. Then, to reduce the high number of features, a Principal Component Analysis (PCA) is used to find the first thirty most useful components. Different machine learning solutions (Bayesian Decision Making, Least Squares method, Support Vector Machine (SVM), k-Nearest Neighbour classifier, Dynamic Time Warping and Artificial Neural Networks) are trained and the performances are evaluated by the test dataset. Similar approaches are described in specific section in [28].
Alternative fall detection solutions use single RGB camera [36, 37]. The person’s blob is extracted from the RGB frame and several features are then calculated studying the silhouette pose to detect a possible fall. For example, matching an ellipse on the blob and calculating the width/height ratio or, when the head is detected, monitoring its position and velocity.
To face the problem of a monitored area limited by the FOV of the camera, more than one sensors are installed in different rooms and can be used to independently track the person. For
example, Cucchiara et al. [38] installed a single camera per room to monitor human silhouette after a background suppression. In addition, to deal with occlusions, they use a sophisticated tracking algorithm based on probabilistic appearance models. On the other hand, rather than use a single camera per room, multiple sensors that frame the same scene are useful to reconstruct the 3D information of the monitored area. However, the calibration process is a time consuming operation that burdens on overall complexity of the algorithm. Compared to a single RGB camera approach, now the significant advantage is that 3D features can be exploited.
The depth sensor can directly provide the distance information and therefore different configu-rations are possible. Leone et al. [39] set the sensor on the wall and, after an automatic calibration procedure, find the ground plane. Foreground elements are detected with a Bayesian segmentation on the depth frame and only the blobs with specific ratios are classified as person. The tracking of the blob is implemented in the 3D space and the distance between the centroid of the per-son’s cluster and the floor plane is monitored. A fall is identified when the distance is below a specific threshold and the person stays in that position for at least 4 s. Stone et al. [40] deploy a similar configuration as well as the technique for foreground blob selection. The fall detection approach is different and based on a two-stage technique where 3D-object’s features are used to get a confidence parameter of the fall. It is worth noting the dimension of the dataset used by the authors. It is one-year records on 13 different apartments, but unfortunately it has not been published. Due to the specific sensor configuration, it is possible that the person is occluded by the furniture during the final part of the fall, this problem is dealt in [41, 42]. In the first work, after the blob identification, if suddenly the person disappears due to a fall behind an object, the algorithm evaluates the body velocity. This feature is calculated as the displacement of the body’s centroid over one second. The system will trigger an alarm if the velocity, calculated in the time interval before the occlusion, exceeds a threshold. Zhang et al. [42] propose specific datasets, with and without occlusions, to compare the different fall detection algorithms suggested in literature that work with depth data. In the occlusion situations, they state that the solution proposed in [41] achieves better performances.
Another strategy to reduce the occlusion problem is to set the depth camera on the ceiling. Kepski et al. [43] proposed this set-up with a depth camera mounted at the height of about 2.5 m from the floor. They assume that the biggest blob in foreground is the person to monitor and, to classify a lying pose situation, they use different features calculated from the binary image. In addition, when the fall event is recognised, the algorithm controls the ratio between the blob’s height and the same parameter calculated 1 s before. In this way, the system takes into account fast changes of the head-floor distance during a fall event. The same camera configuration is proposed in [44], but differently from the previous solution, now the system is able to track more than one person inside the monitored area. The foreground blobs are identified with a Gaussian Mixture Model background subtraction algorithm and, for each blob, three features (person’s height, head size, head-shoulder distance) are calculated and used to classify the person from the objects. The person’s centroid is tracked in all next frames and when two or more people are so close to merge in the same blob, specific segmentation algorithms are used to separate the silhouettes. The fall is detected when the depth value of the head is close to the floor level.
When a person is in front of the camera, specific devices like the Microsoft Kinect in pairs with dedicated software tools [45, 46] directly recognize the subject. Consequently, in this sensor configuration the pre-processing techniques previously described are not necessary and the tools provide useful information to be exploited for fall detection applications. Mastorakis et al. [47] use the 3D bounding box, which encloses the volume of the person, to devise a system that recognizes a risk situation evaluating the velocity whereby the box changes its width, height and depth during a fall. The skeleton, i.e. human structures modelled with the coordinates of the body’s joints, is another information in output from the tools. Planinc et al. [48] calculate the body’s axis from the 3D coordinates of the head, shoulder centre, spine, hip and knees. The system will trigger an alarm when the angle between the axis and the floor plane is close to 0◦ and the coordinate of
spine joint is near the floor.
The data fusion approach, if compared with each separate solution, is implemented to improve the performance of the final system and reduce the percentage of false alarm. As stated before, if the acceleration data is the only measurement provided by the wearable devices, it is difficult to separate real falls from fall-like activities because some ADL (lying on the bed or fast sitting down) have same acceleration trends. Diraco et al. [49] use a fuzzy rule-based logic to aggregate the information provided by a wearable accelerometer and a depth camera. In particular, exploiting the ZigBee communication, the inertial sensor informs the coordinator system if it is worn by the user and the probability of fall, through a confidence value between 0 and 1. Whereas, the camera provides information about the number of people in the monitored scene, body posture and falls detected. A similar set-up system is proposed in [50], the acceleration peak is used to indicate a potential fall, thus five features, four from the depth frame and one from the corresponding 3D space, are given in input to a k-NN classifier to recognize the lying pose.
To understand the risk factors related to a decrease of physical abilities that lead to falls in aged people, a proactive approach analyses the human gait and posture parameters. Indeed, instead of identifying the risk situation, the alternative could be prevent it. To this end, today different tests (early diagnosis), not only related to a fall experience [51], but also other adverse health-related events, can be exploited to assess these factors. When the risk of falling is identified, adequate treatments can be taken, for example promoting balance training or physical activities. The “Timed Up and Go” (TUG) test is one of the most used fall risk assessment tool and, in addition, it could also be exploited to evaluate the capability of Parkinsonian or stroke patients for rehabilitation purposes [52, 53]. The TUG test is a diagnostic tool used by the hospital staff to assess the functional mobility of a patient while he is performing specific motor exercises. The test starts with a senior sat on a chair and when the clinician gives a signal, he stands up, walks straight for three metres, turns around, walk back and sits again. During the test, the staff use a stopwatch to take note of the time interval required by the patient to complete these movements. The result is a score between 1 (low risk) to 5 (high risk) that is strongly related to the experience of the medical staff, therefore subjective. The technology can be used to measure further kinematic parameters and thus complete the assessment of the patient. To this end, Qi An et al. [54] place accelerometers and gyroscopes on back, middle of the lower leg and thigh to measure the angles of ankle, knee and hip. As well as the fall detection solutions, these sensors could be uncomfortable
and could limit the movements during the test. Furthermore, taking into consideration that it is impossible to infer all the kinematic information from the measurements of a single device, an array of sensors must be correctly worn by the subject. Therefore, the help of a trained medical staff is indispensable. Consequently, the test will not perform in a domestic environment but it has to be carried out in a specific gait analysis laboratory.
A first alternative solution to wearable sensors is an infrared (IR) marker-based system (Vicon, Qualisys, Optitrack) and it allows studying the spatial and temporal gait parameters during the TUG test. It tracks IR markers placed on specific points over patient’s clothes or skin using a set of calibrated IR cameras, opportunely positioned in the room. The system is able to find the markers in the IR frames and it calculates the corresponding 3D coordinates. The repetition of this process for all the available frames produces the trajectories of the movements performed by the monitored person. These optical systems have a high accuracy thanks to the remarkable sampling rate (from 100 to 400 Hz) and can precisely calculate the gait parameters [55]. Unfortunately, as for wearable sensors, the patient must wear foreign objects (IR markers) and a specific environment together with expensive equipment are required.
Another solution is suggested by Wang et al. [56]. They proposed a marker-less system based on two synchronized RGB web cameras. One camera is placed in front of the patient, while the second is in the orthogonal direction and both the devices frame the subject at 5 fps. The aim is to calculate the time to complete the turn phase and the number of steps performed during that interval. Although the system is less invasive than the two previous solutions and the authors claim results close to the clinical rating, the performances are not comparable with an IR marker-based system.
A trade-off between comfort and performance is achieved by depth cameras. As stated before, the skeleton engine provided by the Microsoft Kinect is a useful data to assess the gait parameters during a TUG test. In particular, Galna et al. [57] measured the tracking performance of the skeleton in comparison with a gold standard marker-based analysis system on specific movements like multi-directional reaching, standing and walking on the spot. They state that the accuracy of Kinect skeleton is adequate to track relevant movements from a clinical point of view, but the same assertion is not true for small movements such as hand clasping. Lohmann et al. [58] calibrate two Kinect sensors to cover the whole area requested by the TUG test. The analysis of the two synchronized skeleton streams allows identifying nine events in the test. A subset of these instants (start moving, start walking, start turning, end turning, end moving) is compared with the ground truth obtained from the manual analysis of the videos and the results show a difference lower than a second. Reducing the monitored area to 2 m, Kargar et al. [59] use a single Kinect device in front of a person to calculate both the gait parameters (number of steps, step duration, turning duration) and the anatomical parameters (knee angles, leg angle, distance between elbows) of 12 elderly patients. After a processing on the anatomical parameters, all the features are used in in-put to a linear SVM classifier to distinguish the patients in two groups: high and low risk of falling. The behaviour analysis related to food intake is another research field where the technology can lead to an important contribution. Indeed, in the last years, through the Seventh Framework
Programme, the EU has promoted this research [60]. Today it continues with new call proposals in the Horizon 2020 framework [61], tailored for elderly people (SFS-16-2015: “Tackling malnutrition in the elderly”).
In the light of this, different elements that contribute to the healthy status of the body can be monitored. One of the most important is the water assimilation. Indeed, different studies have found out the minimum amount of water that a person should drink during a day [62]. If not respected, the risk of stroke, kidney failure, fatal coronary heart disease or even colon and breast cancer may arise [63]. For the elderly this problem is particularly important due to the reduction of their thirst sensation [64].
Malnutrition is another problem that affects a correct diet. It is defined as a state in which a deficiency, excess or imbalance of energy, protein and other nutrients cause adverse effects on body form and clinical outcome [65]. Obesity is one of the most important consequence of malnutrition. In 2007 obese people in the world were 300 million [66] and after eight years the number of these people has almost doubled [67]. This problem leads to an increase of the risk factors associated to many health complications, such as digestive disorders, diabetes type 2, depression, cardiovascular diseases and some types of cancer [68]. The “anorexia of aging” [69] is another demonstration of malnutrition, opposite to overweight. The appetite declines with the age increase and, as a consequence, the food consumption declines of approximately 30% between 20 and 80 years old [70]. The age related decrease in food intake is a response to the decline in energy expenditure with age, which is in its turn related to reduced muscle function and decreased bone mass. However, in many older people, the decrease in energy intake is greater than the decrease in energy expenditure and the result is a loss of body weight. This physiological age-related reduction in appetite and energy intake has been termed the “anorexia of aging”.
When the technology was not fully mature, the classic solutions to assess the intake behaviours of the patient relied on self-report filled by the same person. The drawback of this approach is in the low quality of the gathered information which is mostly related to the record skills of the patient [71, 72]. Even in monitored structures such as hospital and nursing home, this problem is not completely overcome. The medical staff uses specific balance charts to manually note the patient’s feeding status. Unfortunately, also in this case, the result is not objective and, due to significant pressures on their work, some oversights are still possible [73].
Today, in literature, the diet annotation problem has been partially solved with different ap-proaches. The RFID technology is used in [74] to identify how the volunteer interacts with different objects placed on the table during a meal. The chewing sounds are other distinctive information that can be monitored. Especially, some microphones are placed ear canal of the patient during an intake action [75]. Electromyographic (EMG) signals are the possible alternative used by Woda et al. [76] to study mastication, whereas similar results are obtained using microphones applied to the outer ear canal of the subject to recognize chewing sounds [77].
The embedded sensors have been exploited also in this topic to classify the specific action se-quences performed by a person during intake activities. In details, Dong et al. [78] used accelerom-eter and gyroscope applied to the user’s wrist, as well as in [79] where, in addition, a notification is sent to the user’s smartphone if his intake rate is higher than a typical value. Thomaz et al.
[80] put an off-the-shelf smartwatch device in the dominant hand to record the intake activities exploiting the integrated 3-axis accelerometer. Five features are calculated for each axis using a sliding window of 6 s. Then, a Random Forest machine learning algorithm is trained to classify both eating and non-eating activities.
Another source of information to monitor the intake activities is provided by the vision-based devices. For example, starting from a photo of a meal, the system is able to classify the different foods in the image [81, 82] and provides the calorie consumption and nutrient composition of the dish [83]. Dehais et al. [84] exploited the stereoscopic principle to analyse two consecutive photos of the plate and calculate the food volume. Unfortunately, in these applications, the user must always use a device to take a photo of the meal and, for most of the elderly, this operation could be a problem. A system to automatically identify the best representative image of the meal is proposed in [85]. The RGB camera is placed on the ceiling and it is less invasive if compared with the previous work. Iosifidis et al. [86], during the lunch, use an RGB camera in front of four people to classify the intake activities. A skin colour segmentation algorithm is applied to the RGB stream in order to obtain both the head and hands’ blobs. A sequence of processed frames represents a feature to classify eating and drinking activities. In order to correctly select the person’s blob, the volunteers must wear long sleeves. As for the previous AAL applications the depth camera can overcome these limitations. For instance, placing the camera in front of the volunteer, the skeleton, calculated from the depth stream provided by the Kinect sensor, is used in [87, 88, 89, 90] to detect when the person is drinking or eating. For the tests described in [87], the person sits near the table and a Kinect sensor is placed in the opposite side. Three people participate to the tests eating a soup and a main course. The authors use skeleton joints of the head-hands to identify when the volunteer moves cutlery to the mouth. They manually labelled also the position of the dish and the glass to understand when one of these objects is used. A threshold-based algorithm classifies both the drinking and eating movements monitoring the distance between joints and objects. Tham et al. [88] focus their work in the drinking recognition. Starting from the skeleton, the depth area around the dominant hand is selected and normalized. The intervals of the depth stream that frame the drinking action are manually selected and the similarities with a reference sequence are calculated by the Dynamic Time Warping algorithm. The same Kinect configuration is used in [89], but now the volunteer also wears two accelerometers on the wrists during drinking/eating activities. The monitored parameters are displacements of skeleton joints, wrists/arms angles and accelerometer magnitude. Burgess et al. [90] use a Naive Bayes classifier to infer fluid intake actions. The performance of the system can decrease if Kinect is not in front of the person or when some movements are occluded. A more sophisticated solution is proposed by Lei et al. [91], the camera is installed on the ceiling and the algorithm uses a Gradient Kernel descriptor and a linear SVM classifier to find and track the hands.
1.3. Thesis Outlines
In this thesis, the three research topics previously described will be analysed through the study and design of AAL applications that use RGB-Depth cameras and wearable sensors. In particular,
the rest of the work is organized as follows:
Chapter 2 introduces the RGB-Depth cameras and the wearable devices. It starts with the description of the Pinhole camera model and moves to the analysis of the different technologies behind the distance measurement, highlighting their strengths and weaknesses. Then, two sections of the chapter are dedicated to Kinect V1 and V2, where their most important features are com-pared. Concerning the wearable devices, the SHIMMER sensor is introduced. Its characteristics are presented to explain how to handle the raw acceleration data from the embedded sensor to calculate the device orientation and the magnitude information. Finally, two software tools are presented. They are used to collect the streams from the previous devices and to make the datasets later used in Chapter 5.
Chapter 3 regards synchronization problems between the sensors. Indeed, due to the commu-nication solutions used to transfer the information from the devices to the Pc and the different frame/packet rates, two samples with close timestamps not always refer to the same event. The proposed synchronization algorithm takes into consideration these issues to sort the data in the Pc where will be run the data fusion applications. The second part of the chapter refers to the spatial mismatch between the RGB and depth frames in Kinect. It is caused by the different positions of the cameras in the device and can be solved with a calibration procedure.
Chapter 4 concerns the self-organizing algorithms i.e. unsupervised machine learning solutions that follow the fundamental principles of the self-organization to fit a neural network model to the input data. Three algorithms are introduced: Self-Organizing Map (SOM), Extended SOM (SOM_Ex) and Growing Neural Gas (GNG) networks. The most relevant steps behind each algorithm will be explained and the most important differences between the solutions will be high-lighted. The algorithms will be exploited in the last application proposed in Chapter 5, to provide in output an adapted skeleton model useful to monitor the person’s movements.
Chapter 5 describes three applications that solve different problems in the AAL framework. The first one is a fall detection algorithm that exploits the depth frame provided by Kinect V1 placed on the ceiling. An alternative solution uses the skeleton in output from Kinect V2 in frontal view and accelerations sampled by two SHIMMER devices set to the wrist and to the waist of a person. The synchronization algorithm allows to use both the data at the same time in a data fusion application able to recognize an eventual risk situation, like a fall.
The second application uses the skeleton from Kinect V2 and a single wearable device to measure kinematic parameters of the body during the TUG test.
The last application monitors the movement performed by a person during intake activities to classify particular actions, such as drinking. In this case, the algorithm uses both RGB and depth streams of Kinect V1 in the same configuration of the first application.
contributions of this thesis are published. Future research directions are discussed and finally possible technological trends of the sensors are outlined.
Chapter 2.
Camera Sensors and Wearable Devices:
Principles and Characteristics
This chapter introduces the devices that will be used for the applications proposed in Chapter 5. They can be separated in two principal groups: colour/range cameras and wearable sensors. Initially, the three most important techniques to calculate the distance information (Stereo Vision, Structured Light and Time Of Flight) will be described and then will be introduced Kinect V1 and V2. With regard to the group of wearable devices, the SHIMMER sensor has been selected for its properties of robustness and reliability which will be described to explain how to use the raw data provided by the embedded accelerometer.
Finally, two tools used to handle the raw streams in output from the three different devices will be presented.
2.1. Range Imaging Solutions
This section describes the principles behind the most important optical techniques to calculate the depth data as complement information to the most well-known colour stream. The distance perception is a useful information that can be exploited by a system to improve the knowledge of the 3D environment around it.
Figure 2.1 summarizes the family solutions to estimate the range information using non-contact methods. On the left side, the passive solutions use the radiation already present in the scene to calculate the depth without energy emitted for sensing purpose. The most widely known passive solution is the stereo vision, i.e. the same principle used by the human vision system to “perceive” the depth.
On the other hand, the active solutions are based on a self-generated illumination pattern to find the distance. Light coding and Time Of Flight (TOF) belong to this group and are the technologies respectively implemented in Kinect V1 and Kinect V2. Before the description of these techniques, the Pinhole model is introduced to mathematically represent an ideal camera.
Optical
Passive Active
Stereo from motionStructured ….. Shape fromshading Shape fromsilhouette Time of flight Active stereo
Light coding
Triangulation
Figure 2.1.: General scheme of the most important range imaging techniques used to calculate the depth data.
2.1.1. Pinhole Camera Model
The Pinhole model is used to represent an ideal camera, as a “dark room”, where all the rays of light cross a little hole and “project” an image into the image frame. The model relates a point
P = [x, y, z] in the 3D space with the corresponding point p = [u, v] in the frame (Figure 2.2a).
The first point is in the Camera Coordinate System (CCS) centred in O (centre of projection), while the second one is in the image plane or Frame Reference System (FRS). This plane is parallel to the x-y plane and placed on the negative z-axis. The distance between O and the image plane is called focal length and the intersection point, called principal point, has coordinates (cx, cy) in
the image plane. The z-axis is called principal ray or optical axis and connects O with the image plane.
The (u, v) coordinates can be calculated from (x, y), as follows:
u= x + cx
v= y + cy
(2.1) This is due to the origin of the frame system that starts from the top left corner instead of its centre. In Figure 2.2b are visible the side views of the model parallel to the x-z and y-z planes, with similar triangles depicted in blue. The properties of similar triangles let the following considerations (Figure 2.2b): u − cx f = − x z v − cy f = − y z (2.2)