1
A Bayesian Spatio-Temporal framework to improve
exposure measurements combining observed and
numerical model output
Monica Pirani, John Gulliver, Marta Blangiardo
MRC-HPA Centre for Environment and Health,Department of Epidemiology and Biostatistics, Imperial College London, UK
E-mail for correspondence: [email protected]; [email protected]
Abstract: The high resolution Air Dispersion Modelling System (ADSM)-Urban
represents an advanced model to simulate the local traffic and non traffic related contribution of PM10. The aim of our study is to provide a Bayesian framework to improve exposure estimates of PM10 combining observed data from monitoring sites with ADMS-Urban numerical model output. To illustrate our approach we use PM10 daily averaged values for 46 monitoring sites in London, over the period 2002-2003 and output from ADMS-Urban. Different spatio-temporal structures are investigated and compared in performance. We demonstrate that adding covariates on environmental characteristics of sites and meteorological changes over time improve the precision and accuracy of the concentration estimates.
Keywords: Bayesian inference, Particulate matter pollution, Space-Time model,
Kriging, Random Walk.
1. Introduction
In the last decade urban air pollution has become a relevant topic of epidemiological and environmental research. The concern over its adverse health effects has led to considerable efforts on the development of numerical model to estimate exposures for these complex mixtures. The high resolution Air Dispersion Modelling System (ADSM)-Urban represents an advanced semi-Gaussian model, widely used to assess and simulate the dispersion into the atmosphere of some important pollutants, such as particulate matter ≤ 10 µm in aerodynamic diameter (PM10), released from industrial, domestic and road traffic sources (Carruthers et al. 2000).
The aim of our study is to provide a Bayesian spatio-temporal framework to improve exposure estimates of PM10 combining particulate matter data from monitoring sites with ADMS-Urban model output. Several modelling strategies have been suggested in the Bayesian literature to combine observed data and model output (e.g. Fuentes and Raftery 2005; Sahu et al. 2009; Mc Millan et al. 2010; Berrocal et al. 2010). Our models are framed in a downscaler perspective (Berrocal et al. 2010), assuming that PM10 is characterised by a spatial and temporal component; we extend this approach incorporating additional relevant spatial or temporal covariates: long-range transport of
2
PM10, site type, day of the week and temperature. The performance of our modelling approach is assessed using: 1) indexes of model fit and 2) a cross-validation perspective.
2. Materials and Methods
Data description and study area
The dataset consists of PM10 daily averaged concentrations (µg/m3) that were observed at 46 monitoring sites in London, over the period 2002-2003. The monitoring stations present different environmental conditions, some are in suburban or urban locations (no. 22), and others are located near road (no. 20) or highly busy kerb site (no. 4). The mean distance between the sites is 17813.3 meters (range: 358.4-45297.3 meters). The proportion of missing data is 8.8%, varying across the monitoring sites from 0.7% to 28.4%. The missing values are assumed to be missing at random and being in a Bayesian perspective, they are imputed through the posterior predictive distribution. The second main source of information is the modelled output for local traffic and non traffic from ADMS-Urban, based on grid cells. It has a limit of 1500 on the number of source road links that can be modelled; monitoring sites were therefore buffered to a distance of 300 metres, and all road sources within that range selected for modelling. Emissions from other sources for each 1 km grid cell were also modelled.
To take into account the contribute of a long-range component of PM10, we included the monitoring station at the rural site of Harwell (~60 Km west of London). Harwell represents a good indicator for long-range transport of air masses: it is surrounded by predominantly agricultural land, and the nearest road is located at 140 metres from the station. In addition, we included in the analysis: the type of site (sub-urban or urban, road and kerb sites), the day of the week (Monday-Friday, Saturday and Sunday or Holiday) and the temperature at the Heathrow meteorological station, measured at 1.25 m above ground level (with linear and quadratic effect).
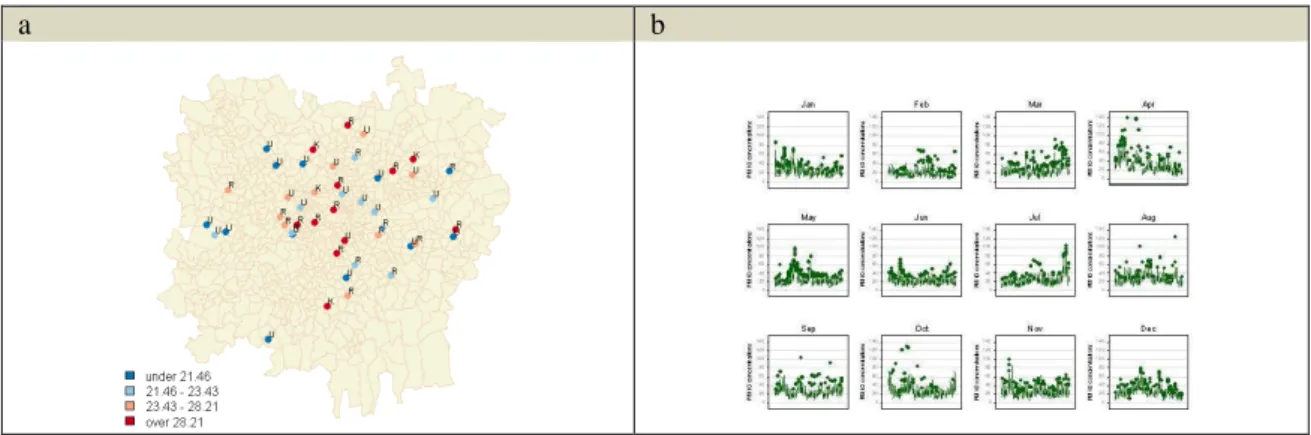
We performed a preliminary exploratory analysis which showed spatio-temporal variation in the concentration levels of PM10. Figure 1 shows the mean concentration levels: a) by site (quartiles of PM10 values distribution) and b) by day for each month (year 2002). The analysis of autocorrelation correlogram of time series (not shown) suggests serial dependencies.
a b
Figure 1: PM10 concentrations: a) Plot of mean values by site (U=Urban/Suburban; R=Road; K=Kerb); b) Box plot of daily mean values by month (year 2002)
3
Bayesian Hierarchical Models
Let denote the response variable (log-transformed PM10 data) at location and time The response is modelled as a space-time process defined by
We consider the following possible models for
Model 1 -
Basic model. Approximately half of the PM10 can be considered secondary or natural, being made up of PM formed from gaseous precursors or sea salt, thus this analysis includes only the long-range component (PM10 observed at rural site of Harwell) that is assumed to follow a second-order random walk non-stationary in time model.
Model 2 -
Multivariate model that includes, as well as the background component, the output from numerical ADMS-Urban model and its coefficients are assumed to vary spatially through a Bayesian Kriging. We specified a Uniform prior distribution for the correlation decay parameter with range chosen based on prior beliefs about the maximum and minimum correlation at the largest and smallest distances of the PM10 values. Prior range for correlation at minimum distance was between 0.10 and 0.99; prior range for correlation at maximum distance was between 0 and 0.30.
Model 3 -
Multivariate model that incorporates spatial and temporal dimension of the data, as well as the spatio-temporal covariates (site type, day of the week, temperature).
We assumed a separate variance for each site with a moderately informative inverted gamma prior. We adopted vague normal priors for the intercept coefficient α and the regression coefficients
To validate our models, we randomly partitioned the monitoring network in four subsets. For each subset, a single subsample is retained as the validation data for testing the model, and the remaining subsamples are used as training data.
The deviance information criterion (DIC; Spiegelhalter et al. 2002), is used to analyse the model fit. In order to compare the performance of the models, we adopted the empirical coverage of 95% credible intervals (95%CI), the average length of 95%CI, the mean square error (MSE), the adjusted R2 and the mean fractional bias (MFB). We present the results obtained from one subset; they are consistent for the other subsets.
3. Results
The model comparisons via DIC show large differences among the models: the third one, which considers the spatio-temporal structure as well as the additional covariates, had a smaller DIC (-3506.7) than the first two (DIC respectively equal to 19388.6 and 15574.1). Cross-validation summary statistics are showed in Table 1.
Model Coverage 95%CI
Average
length 95%CI MSE
Adjusted
R2 MFB
1 95.42 43.15 116.89 0.47 0.10
2 95.66 43.37 106.86 0.47 0.12
3 96.67 32.09 53.81 0.73 0.05
Table 1: Summary statistics for cross-validation prediction
st Y s ). , ( ~ st s2 st N Y µ σ . t st
µ
t t stα
β
1ruralµ
= + st s t t stα
β
1ruralβ
2 admsµ
= + + 2 6 5 4 3 2 1t t s st s t t tst
α
β
ruralβ
admsβ
typeβ
dowβ
tempβ
tempµ
= + + + + + + 2 s σ . , , , 4 5 6 3β
β
β
β
4
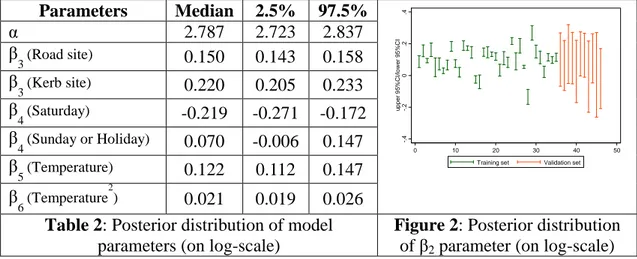
Table 2 presents the posterior distribution of model parameters for Model 3. The effect of the monitoring site type shows that PM10 level is significantly higher for road and kerb sites than for suburban/urban sites. Level of PM10 are lower on Saturdays (significant) while Sunday or Holidays are not significantly different from weekdays. High temperatures are associated with high concentration of PM10. Finally, the relationship between observed values and modelled output from ADMS-Urban shows spatial variation (Figure 2).
The posterior median of daily temporal effect (parameter β1t) associated with long-range
component (not shown) presents a range of values from -1.36 to 1.39 (95%CI).
Parameters Median 2.5% 97.5% -. 4 -. 2 0 .2 .4 u p p e r 9 5 % C I/ lo w e r 9 5 % C I 0 10 20 30 40 50 Training set Validation set
α 2.787 2.723 2.837 β 3 (Road site) 0.150 0.143 0.158 β 3 (Kerb site) 0.220 0.205 0.233 β 4 (Saturday) -0.219 -0.271 -0.172 β 4 (Sunday or Holiday) 0.070 -0.006 0.147 β 5 (Temperature) 0.122 0.112 0.147 β 6 (Temperature 2 ) 0.021 0.019 0.026
Table 2: Posterior distribution of model
parameters (on log-scale)
Figure 2: Posterior distribution
of β2 parameter (on log-scale)
4. Concluding remarks
Our Bayesian approach provides a natural way to combine data from different sources taking into account their uncertainties. We found that adding “spatial” covariates (e.g. site type) and “temporal” ones (day of the week, temperature) increases the precision and accuracy of the estimated values of PM10.
References
Berrocal V. J., Gelfand A. E., Holland D. M. (2009) A Spatio-Temporal Downscaler for Output from Numerical Models, Journal of Agricultural, Biological, and Environmental Statistics, 15, 176-197.
Carruthers D.J., Edmunds H.A., Lester A.E., McHugh C.A., Singles R.J. (2000) Use and validation of ADMS-Urban in contrasting urban and industrial locations, International Journal of Environment and Pollution, 14 (1–6), 364–374.
Fuentes M., Raftery, A. E. (2005) Model evaluation and spatial interpolation by Bayesian combination of observations with outputs from numerical models, Biometrics, 61 36–45. McMillan N., Holland D. M., Morara M., Feng J. (2010) Combining Numerical Model Output
and Particulate Data Using Bayesian Space-Time Modeling, Environmetrics, 21, 48-65. Sahu S. K., Yip S., Holland D. M. (2009) Improved space–time forecasting of next day ozone
concentrations in the eastern US, Atmospheric Environment, 43, 494-501.
Spiegelhalter D., Best N., Carlin B., van der Linde A. (2002) Bayesian measures of model complexity and fit, Journal of the Royal Statistical Society, Series B, 64, 583-639.