Organized Crime
Infiltration of Legitimate
Businesses in Europe:
A Pilot Project in Five
European Countries
Final report of
Project ARIEL
Co-funded by the Prevention of and Fight against Crime Programme of the European Union
Co-funded by the Prevention of and Fight against Crime Programme of the European Union
Final Report of Project ARIEL - Assessing the Risk of the Infiltration of Organized Crime in EU MSs Legitimate Economies: a Pilot Project in 5 EU Countries (HOME/2012/ISEC/FP/C1/4000003801)
Edited by Ernesto U. Savona and Giulia Berlusconi
Principal Investigators for the 5 EU MS:
Gerben Bruinsma, Netherlands Institute for the Study of Crime and Law Enforcement ([email protected]) Lars Korsell, Swedish National Council for Crime Prevention ([email protected])
Gorazd Meško, University of Maribor, Faculty of Criminal Justice and Security ([email protected]) Ernesto U. Savona, Università Cattolica del Sacro Cuore-Transcrime ([email protected])
David Wall, University of Durham (now University of Leeds, [email protected])
With the collaboration of (in alphabetical order): Sylvia Alberts; Branko Ažman; Stefano Bonino; Salvatore Cincimino; Jeltsje Cusveller; Adriaan Denkers; Lorena Di Bono; Fiammetta Di Stefano; Bojan Dobovšek; Katja Eman; Lorella Garofalo; Valentina Giampietri; Maurizio Lisciandra; Marina Marchiaro; Maja Modic; Michele Riccardi; Helena Rönnblom; Martina Rotondi; Federica Sarno; Giulia Schiavulli; Andrej Sotlar; Johanna Skinnari; Boštjan Slak; Cristina Soriani; Joanne van Hoek.
Suggested citation: Savona Ernesto U. & Berlusconi Giulia (Eds.). 2015. Organized Crime Infiltration of Legitimate Businesses in Europe: A Pilot Project in Five European Countries. Final Report of Project ARIEL – Assessing the Risk of the Infiltration of Organized Crime in EU MSs Legitimate Economies: a Pilot Project in 5 EU Countries (www.ariel-project.eu). Trento: Transcrime – Università degli Studi di Trento. © 2015
This project has been funded with support from the European Commission. This publication reflects the views only of the author, and the European Commission cannot be held responsible for any use which may be made of the information contained therein
4
Table of contents
List of tables List of figures List of acronyms Acknowledgements Executive summary 1. Introduction 1.1. Project ARIEL 1.2. An understudied phenomenon1.3. Definition of organised crime infiltration 1.4. Structure of the report
PART I. Mapping organised crime infiltration in legitimate businesses 2. Organised crime infiltration in 5 EU countries
2.1. Infiltrated territories 2.2. Infiltrated business sectors 3. Italy
3.1. Introduction 3.2. Drivers
3.3. Infiltrated territories 3.4. Infiltrated business sectors 3.5. Actors and modi operandi 3.6. Conclusions
4. The Netherlands 4.1. Introduction 4.2. Drivers
4.3. Infiltrated territories 4.4. Infiltrated business sectors 4.5. Actors and modi operandi 4.6. Conclusions
5. Slovenia 5.1. Introduction 5.2. Drivers
5.3. Infiltrated territories 5.4. Infiltrated business sectors 5.5. Actors and modi operandi 5.6. Conclusions 6 8 10 12 13 18 18 18 19 20 22 24 24 30 37 37 38 39 40 42 44 45 45 47 48 48 49 49 50 50 51 52 53 55 56
6. Sweden
6.1. Introduction 6.2. Drivers
6.3. Infiltrated territories 6.4. Infiltrated business sectors 6.5. Actors and modi operandi 6.6. Conclusions
7. United Kingdom 7.1. Introduction 7.2. Drivers
7.3. Infiltrated territories 7.4. Infiltrated business sectors 7.5. Actors and modi operandi 7.6. Conclusions
PART II. Assessing the risk of infiltration in legitimate businesses 8. Drivers of infiltration
9. The step-by-step process of infiltration 10. Control strategies of infiltrated businesses
10.1. Legal form
10.2. Shareholders and directors 10.3. Other forms of control
11. Management strategies of infiltrated businesses 11.1. Financing sources
11.2. Use of assets 11.3. Profitability
12. Key inputs for a common risk assessment model 12.1. Risk assessment in organised crime research 12.2. Infiltration risk factors
12.3. Towards a common risk-assessment model 13. Conclusions References 57 57 58 59 60 64 66 67 67 68 70 70 72 74 76 78 83 90 90 93 99 102 103 105 109 112 113 119 122 124 125
6
List of tables
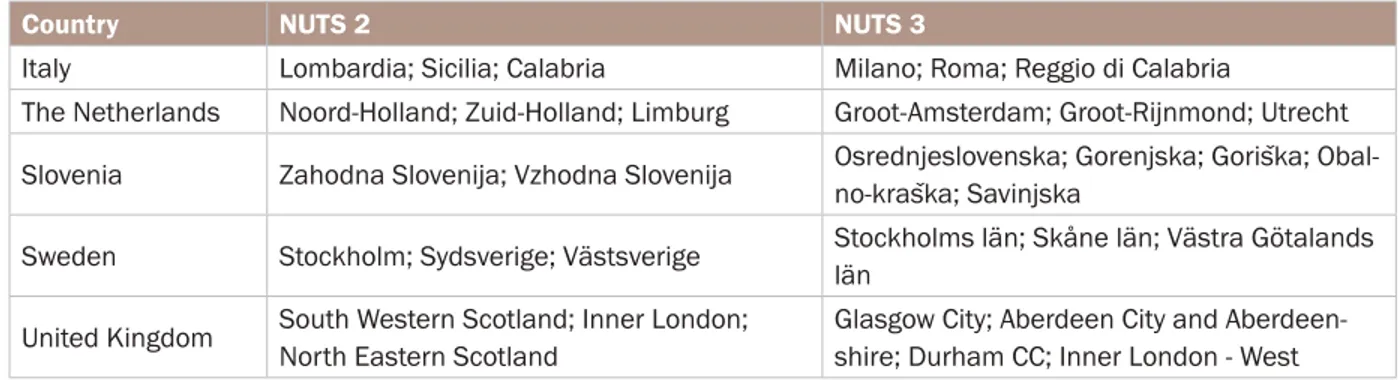
Table 1. Top 3 regions (NUTS 2 and NUTS 3) for references to OCG infiltration in open sources by country
Table 2. Hypotheses on the characteristics of infiltrated territories
Table 3. Relationship between the references of OCG infiltration in open sources and the characteristics of infiltrated territories
Table 4. Top 3 and bottom 3 regions (NUTS 2) for shadow economy by country. Comparison with the national average
Table 5. Top 3 and bottom 3 regions (NUTS 2) for corruption by country. Comparison with the national average
Table 6. Relationship between the references to OCG infiltration in open sources and the characteristics of infiltrated territories. Comparison with the EU and national average
Table 7. Business sectors by number of references to OCG infiltration in open sources
Table 8. Business sectors by country and number of references to OCG infiltration in open sources Table 9. Top 3 business sectors with references to OCG infiltration in open sources by country Table 10. Hypotheses on the characteristics of infiltrated business sectors
Table 11. Relationship between the references to OCG infiltration in open sources and the characteristics of infiltrated business sectors
Table 12. Top 10 business sectors for number of references to OCG infiltration in open sources by sector’s characteristics. Comparison with the European average
Table 13. Top 5 business sectors for number of references to OCG infiltration in open sources by sector’s characteristics in Italy. Comparison with the national average
Table 14. Top 5 business sectors for number of references to OCG infiltration in open sources by sector’s characteristics in the Netherlands. Comparison with the national average
Table 15. Top 5 business sectors for number of references to OCG infiltration in open sources by sector’s characteristics in Slovenia. Comparison with the national average
Table 16. Top 5 business sectors for number of references to OCG infiltration in open sources by sector’s characteristics in Sweden. Comparison with the national average
Table 17. Top 5 business sectors for number of references to OCG infiltration in open sources by sector’s characteristics in the United Kingdom. Comparison with the national average
Table 18. Top 5 sectors and top 5 regions (NUTS 2) for number of references to OCG infiltration in open sources by OCG
Table 19. Top 5 sectors and top 5 regions (NUTS 1) for number of references to OCG infiltration in open sources
Table 20. Hypotheses on the legal forms of infiltrated businesses
Table 21. Hypotheses on shareholders and directors of infiltrated businesses Table 22. Hypotheses on other forms of control of infiltrated businesses
Table 23. Financing sources of infiltrated businesses. Comparison with the peer group of non-infiltrated businesses 25 25 26 29 31 33 34 28 29 32 33 35 36 37 35 36 36 42 73 91 94 99 103
Table 24. Financing sources of infiltrated businesses by driver of OCG infiltration. Comparison with the peer group of non-infiltrated businesses
Table 25. Use of assets of infiltrated businesses. Comparison with the peer group of non-infiltrated businesses
Table 26. Use of assets of businesses infiltrated for fraud. Comparison with the peer group of non-infiltrated businesses
Table 27. Profitability of infiltrated businesses. Comparison with the peer group of non-infiltrated businesses
Table 28. Preliminary predictive model on organised crime infiltration into legitimate business Table 29. Me.Tri.C. model. Indicators and variables included in the Territory and Economic sector models
Table 30. Mo.Vu.S. model. Indicators and variables included in the territory and economic sector risk factors
Table 31. Operationalisation of risk factors
105 106 107 109 114 116 117 122
8
List of figures
Figure 1. Percentage of references to OCG infiltration in open sources by type of source Figure 2. Percentage of references to OCG infiltration in open sources by country Figure 3. Percentage of references to OCG infiltration in open sources by type of OCG
Figure 4. Number of references to OCG infiltration in open sources by region (NUTS 2). Percentage of the country total
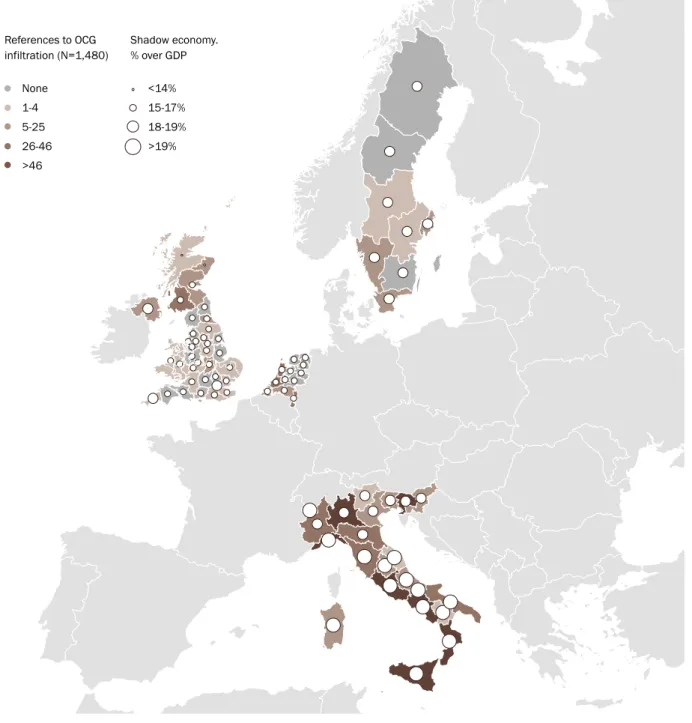
Figure 5. Number of references to OCG infiltration in open sources and shadow economy by region (NUTS 2). Comparison with the European average
Figure 6. Number of references to OCG infiltration in open sources and corruption by region (NUTS 2). Comparison with the European average
Figure 7. Number of references to OCG infiltration in open sources and income by region (NUTS 2). Comparison with European and national average
Figure 8. Number of references to OCG infiltration in open sources by country and business sector Figure 9. Percentage of references to OCG infiltration in open sources by type of source
Figure 10. Number of references to OCG infiltration in open sources by region (NUTS 2) Figure 11. Number of references to OCG infiltration in open sources by business sector
Figure 12. Regions (NUTS 2) with at least one reference to OCG infiltration in open sources in the top 3 infiltrated sectors
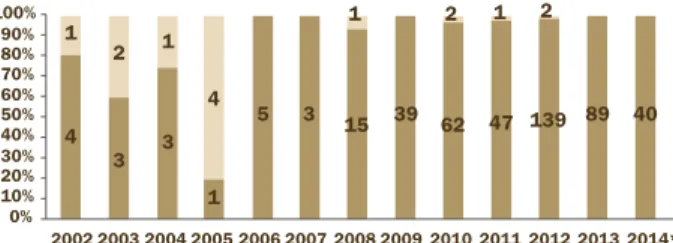
Figure 13. References to Italian mafias infiltration in open sources by location (NUTS 2) Figure 14. Percentage of references to OCG infiltration in open sources by type of source Figure 15. Number of references to OCG infiltration in open sources by region (NUTS 2) Figure 16. Number or references to OCG infiltration in open sources by business sector Figure 17. Criminal charges with references to organised crime groups, 2002-mid 2014 Figure 18. Percentage of references to OCG infiltration in open sources by type of source Figure 19. Filed criminal charges for money laundering offences, 2002-mid 2014 Figure 20. Number of references to OCG infiltration in open sources by region (NUTS 3) Figure 21. Number of references to OCG infiltration in open sources by business sector
Figure 22. Regions (NUTS 3) with at least one reference to OCG infiltration in open sources in the top 3 infiltrated sectors
Figure 23. Percentage of references to OCG infiltration in open sources by type of source Figure 24. Number of references to OCG infiltration in open sources by region (NUTS 2) Figure 25. Number of references to OCG infiltration in open sources by business sector Figure 26. Percentage of references to OCG infiltration in open sources by type of source Figure 27. Number of references to OCG infiltration in open sources by region (NUTS 2) Figure 28. Number of references to OCG infiltration in open sources by business sector
Figure 29. Regions (NUTS 1) with at least one reference to OCG infiltration in open sources in the top 3 infiltrated sectors 22 23 23 24 27 28 30 31 38 39 41 41 43 50 53 45 51 53 48 52 55 58 70 60 71 61 72 68 49
76 76 77 77 79 82 84 85 89 91 92 93 93 94 96 98 100 101 101 102 103 123 Figure 30. Number of case studies by country
Figure 31. Number of infiltrated businesses by country Figure 32. Case studies and infiltrated businesses
Figure 33. Distribution of infiltrated businesses in the case studies analysed Figure 34. Drivers of OCG infiltration
Figure 35. Drivers of OCG infiltration by country Figure 36. Type of infiltrated business by country
Figure 37. Crime script of OCG infiltration of legal businesses
Figure 38. Involvement of professionals in the infiltration process by country Figure 39. Legal forms of infiltrated businesses by country
Figure 40. Infiltrated businesses with a legal form different from the one most common in the same country and economic sector
Figure 41. Legal forms of infiltrated businesses in Italy by type of OCG Figure 42. Legal forms of infiltrated businesses by type of driver
Figure 43. Infiltrated businesses with OCG members involved as shareholders by country Figure 44. Other categories of shareholders. Percentages by country
Figure 45. Infiltrated businesses with women among shareholders and with women as majority shareholders by country
Figure 46. Case studies with evidence of cross-shareholding among different businesses by country Figure 47. Size of infiltrated businesses. Percentages by country and size category
Figure 48. Age of infiltrated businesses. Percentages by country and age category
Figure 49. Infiltrated businesses covered by the financial and accounting analysis by country
Figure 50. Number of businesses with evidence of accounting manipulation by driver of OCG infiltration Figure 51. Risk model of OCG infiltration of legitimate businesses
10
List of acronyms
AJPES Agency of the Republic of Slovenia for Public Legal Records and Related Services (Agencija Republike Slovenije za javnopravne evidence in storitve)
ARIEL Assessing the Risk of the Infiltration of Organised Crime in Legitimate Economies BIA Security Information Agency (Bezbednosno-informativna agencija)
Brå Swedish National Council for Crime Prevention (Brottsförebyggande rådet) CENSIS Center for Social Investment Studies (Centro Studi Investimenti Sociali) CEO Chief Executive Officer
CIFAS Fraud Prevention Service CIT Cash-In-Transit
CNEL National Council for Economics and Labour (Consiglio Nazionale dell’Economia e del
Lavoro)
COBISS Co-operative Online Bibliographic Systems and Services
CPA Anti-mafia Parliamentary Commission (Commissione Parlamentare Antimafia) CPC Commission for the Prevention of Corruption
CPU Computer Processing Unit CRO Companies Registration Office CSD Center for the Study of Democracy DEA Drug Enforcement Administration
DIA Anti-mafia Investigative Department (Direzione Investigativa Antimafia) DLIO National Police (Nationale Politie)
EBM Economic Crime Authority (Ekobrottsmyndigheten) EU European Union
FATF Financial Action Task Force
FCJS Faculty of Criminal Justice and Security
FIOD Fiscal Intelligence and Investigation Service (Fiscale Inlichtingen- en Opsporingsdienst) FIU Financial Intelligence Unit
GDP Gross Domestic Product
GRETA Group of Experts on Action against Trafficking in Human Beings HMRC Her Majesty’s Revenue and Customs
HP Hypothesis
IRAP Regional Tax on Production Activities (Imposta Regionale sulle Attività Produttive) IRCP International Research on Criminal Policy
ISF Social Insurance Inspectorate (Inspektionen för socialförsäkringen &
Brottsförebyggan-de råBrottsförebyggan-det)
KFM Enforcement Authority (Kronofogden) LEA Law Enforcement Agency
MEK Butanone MS Member State
MSB Money Service Business MTIC Missing Trader Intra-Community NA Not Available
NACE Statistical Classification of Economic Activities in the European Community NCA National Crime Agency
NSCR Netherlands Institute for the Study of Crime and Law Enforcement NUTS Nomenclature of Units for Territorial Statistics
OC Organised Crime OCG Organised Crime Group OCP Organised Crime Portfolio PEP Politically Exposed Persons POCA Proceeds of Crime Act 2002
PON National Operative Programme (Programma Operativo Nazionale) RKP National Bureau of Investigation (Rikskriminalpolisen)
SAMEB Collaboration Against Economic Crime
SD Standard Deviation SEK Swedish Krona
SKD Standard Classification of Activities (Standardna klasifikacija dejavnosti) SOCA Serious Organised Crime Agency
SOU Government Official Reports (Statens Offentliga Utredningar) THC Tetrahydrocannabinol
UAE United Arab Emirates UDUR University of Durham UK United Kingdom
UKTA United Kingdom Threat Assessment USA United States of America
VAT Value-Added Tax
WODC Research and Documentation Centre (Wetenschappelijk Onderzoek- en
Documen-tatiecentrum)
12
Acknowledgements
Project ARIEL has been carried out thanks to the contribution and support of a wide range of representatives of European institutions, LEAs, FIUs, AROs, academics and researchers. Special thanks go to Unit D2 Organised crime of the Directorate-General (DG) Home Affairs of the European Commission. The authors also thank (in alphabetical order):
Pasquale Aglieco (Ministero dell’Interno); Igor Angelini (Europol); Fernando Asaro (Procura di Caltanissetta); Stojan Belšak (Ministrstvo za notranje zadeve, Policija, Uprava kriminalistične policije, Sektor za organizirano kriminalitetno); H.W.J.G. Boer (Fiscale Inlichtingen- en Opsporingsdienst); Marco Bolognesi (Ministero dell’Interno); Maurizio Bonaccorso (Procura di Palermo); Iole Boscarino (Procura di Catania); Francesco Caleca (Procura di Bologna); Francesco Cardona Albini (Procura di Genova); Ignazio De Francisci (Procura di Palermo); Andrea De Gasperis (Procura di Latina); Marco Del Gaudio (Procura di Napoli); Vincenzo Delicato (Ministero dell’Interno); Maria Di Mauro (Procura di Napoli); Alfonso Di Vito (Direzione Investigativa Antimafia); Antonella Duchini (Procura di Perugia); Ekobrottsmyndigheten (Swedish Economic Crime Authority); Raffaello Falcone (Procura di Napoli); Marjan Fank (Ministrstvo za notranje zadeve, Policija); Giuseppe Fici (Procura di Agrigento); Zvonko Fišer (Ministrstvo za pravosodje, Vrhovno državno tožilstvo Republike Slovenije); Giuseppe Gatti (Procura di Bari); Andrea Ghinetti (Tribunale di Milano); Giuliano Giambartolomei (Procura di Firenze); Giuseppe Giura (Tribunale di Palermo); Stuart Hyde (Cumbria Police); Robert Lalič (Ministrstvo za notranje zadeve, Policija, Uprava kriminalistične policije, Nacionalni preiskovalni urad); Sergio Lari (Procura di Caltanissetta); Stefano Luciani (Procura di Caltanissetta); Malmö Police; Alfredo Musumeci (Direzione Investigativa Antimafia); Pierangelo Padova (Procura di Palermo); Paolo Pecori (Procura di Vicenza); Annamaria Picozzi (Procura di Palermo); Giuseppe Pignatone (Procura di Roma); Francesco Polino (Procura di Roma); Robert Pollard (Durham Police); Michele Prestipino (Procura di Roma);
Elisabetta Pugliese (Procura di Roma); Marcello Quercia (Procura di Bari); Maria Cristina Ribera (Procura di Napoli); Marzia Sabella (Procura di Palermo); Dijana Šprajc Turek (Agencija Republike Slovenije za javnopravne evidence in storitve); Swedish National Bureau of Investigation, Financial Intelligence Unit; Francesco Testa (Procura di Catania); Peter van der Laan (Netherlands Institute for the Study of Crime and Law Enforcement); Rob Wainwright (Europol).
Final thanks go to the staff of the Università Cattolica del Sacro Cuore and Transcrime who guaranteed support throughout the duration of the project, and in particular to Alessandra Amato, Maria Elena Cenci, Alessio Fontana, Ilaria Mastro, and Andrea Pesoli.
Executive summary
Project ARIEL – Assessing the Risk of the Infiltration of Organised Crime in EU MSs Legitimate Economies: a Pilot Project in 5 EU Countries (www.arielproject.eu) – was carried out with the financial support of the European Commission, DG Home Affairs, within the Prevention of and Fight against Crime (ISEC) Programme. It focused on five EU MS: Italy, the Netherlands, Slovenia, Sweden, and United Kingdom.
This research is an exploratory study on the infiltration of organised crime groups (OCGs) in legal businesses. Infiltration occurs in every case in which a natural person belonging to a criminal organisation or acting on its behalf, or an already infiltrated legal person, invests financial and/or human resources to participate in the decision-making process of a legitimate business. The main output of the research is a list of risk factors of OCG infiltration in legal businesses, i.e. factors that facilitate or promote infiltration. Risk factors are derived from an unprecedented cross-national comparative analysis of the vulnerabilities of territories and business sectors, criminal groups’ modi operandi, and the characteristics of infiltrated businesses.
Infiltration risk factors provide inputs for the development of a risk assessment model of OCG infiltration. Its development will assist Law Enforcement Agencies (LEAs) in identifying the factors facilitating and/or promoting infiltration and enhancing the prevention and enforcement of criminal infiltration. This will help protect EU MS legitimate economies from the misuse of legal businesses for illicit purposes.
PART I. Mapping organised crime
infiltration in legitimate businesses
This study analyses OCG infiltration in legitimate businesses through 2,380 references to OCG infiltration from a variety of open sources (i.e. academic studies, LEA operations and reports, newspaper articles). It examines the distribution of OCG infiltration and its correlation with socio-economic indicators to identify the main characteristics of the territories and business sectors targeted by OCGs.Infiltrated territories
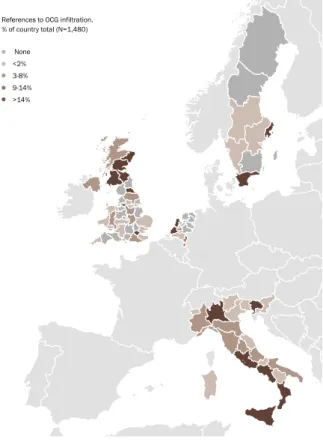
The results show that territories with references to OCG infiltration include (Figure 1):
• Regions with a stable, historical presence of criminal groups (e.g. Southern Italy);
• Border regions (e.g. Western Slovenia) and regions with important ports and airports (e.g. North and South Holland);
• Regions with large urban areas (e.g. Lazio and Lombardy in Italy, the Stockholm and Malmö regions in Sweden, the London area in the UK).
References to OCG infiltration seem to be associated with high levels of shadow economy and corruption, and high levels of infrastructural development. By contrast, low competition levels and low openness to foreign countries do not seem to be associated with references to OCG infiltration in legal businesses.
Figure 1. Number of references to OCG infiltration in open sources by region (NUTS 2). Percentage of the country total1 None <2% 3-8% 9-14% >14%
References to OCG infiltration. % of country total (N=1,480)
1. Details on the geographic location of the infiltration (NUTS 2) are available for 1,069 references in Italy, 125 references in the Netherlands, 69 references in Slovenia, 49 references in Sweden, and 168 references in the United Kingdom.
14
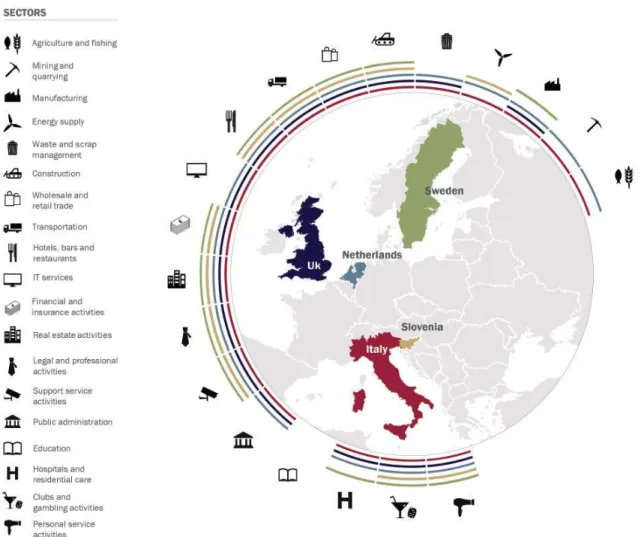
Infiltrated business sectors
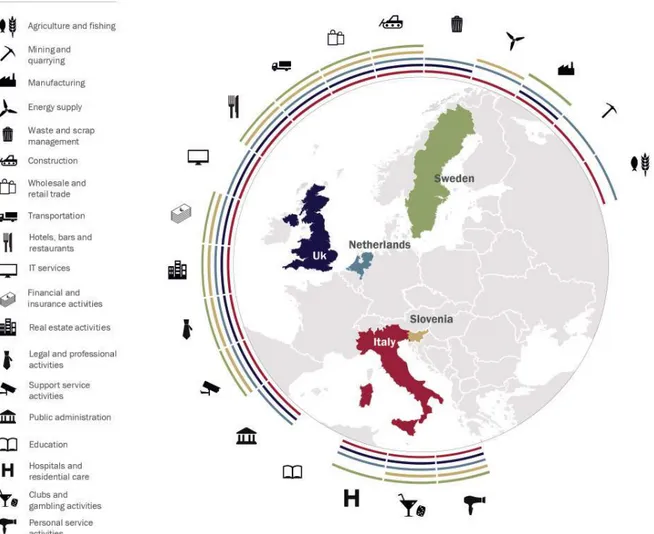
The results show that business sectors with references to OCG infiltration include (Figure 2):
• Cash-intensive sectors (e.g. bars and restaurants); • Sectors that are territorially specific (e.g. hotels); • Labour-intensive sectors characterised by low
technology (e.g. construction);
• Sectors functional to illicit activities (e.g. transportation; wholesale and retail trade; financial and insurance activities);
• Sectors characterised by weak or developing regulation (e.g. gambling activities; renewable energy), or inefficient control systems (e.g. construction).
Figure 2. Number of references to OCG infiltration in open sources by country and business sector2
References to OCG infiltration seem to be associated with low levels of openness to foreign investments; low levels of competition and technology; and small
average business entity size. The relationship between references to OCG infiltration and a sector’s profitability is weak and negative.
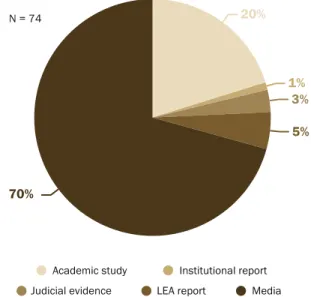
2. Details on the business sector of the infiltration (NACE 0-digit) are available for 1,286 references in Italy, 558 references in the Netherlands, 74 references in Slovenia, 114 references in Sweden, and 248 references in the United Kingdom.
PART II. Assessing the risk of
infiltration in legitimate businesses
This study analyses 70 case studies of OCG infiltration and 299 infiltrated businesses. It identifies the main drivers of OCG infiltration of legal businesses, the step-by-step process of infiltration, and the characteristics of infiltrated businesses.Drivers of OCG infiltration
OCGs infiltrate legitimate businesses to maximise economic and non-economic benefits. In particular, they aim to:
• Launder the profits from criminal activities;
• Obtain considerable earnings and benefit from their profitability;
• Perpetrate frauds (e.g. insurance fraud, VAT and tax fraud, benefit fraud);
• Conceal illicit activities such as drug trafficking and prostitution;
• Achieve other goals such as maximising social consensus and achieving control over a particular sector or territory.
OCGs active in the Netherlands, Sweden, and the United Kingdom mainly infiltrate businesses in order
to perpetrate frauds. Most Slovenian OCGs infiltrate legal businesses to conceal illegal activities, mainly prostitution. In Italy, some OCGs have invested in legal business entities to maximise their social consensus and to control a particular market of the local economy.
The step-by-step process of infiltration
Infiltrated legal businesses divide between two types: already-existing businesses and new ones. Dutch organised criminals are more prone to infiltrate the former; Slovenian organised criminals favour the start of new businesses. In Italy, Sweden, and the United Kingdom, there is a balance between the two types of infiltrated businesses.
The infiltration process is often straightforward. It involves one member of the criminal group regularly starting a new business or acquiring an already-existing one from a legal entrepreneur. This process can be facilitated by the scant requirements needed to set up a company or the lack of regulation on the process of acquiring a business.
In other cases, the infiltration process requires further steps, e.g. establishment of a partnership with the former shareholder and/or director of the targeted business (Figure 3). The infiltration process occasionally involves OCG members’ relatives, professionals, public officials, and politicians who help organised criminals to acquire and manage the legal business.
Figure 3. Crime script of OCG infiltration of legal businesses Legal entrepreneur starts business Identify business Start business Use of premises for criminal activity Deposit money in offshore bank accounts Use of business for criminal activity Use of business for legitimate activity Register business Legal entr. approaches OCG member OCG acquires business OCG approaches legal entr. OCG gets involved in business Register straw man as shareholder Company registration agent starts business
16
Control strategies of infiltrated businesses
Control strategies refer to the ownership structure of infiltrated businesses, i.e. how infiltrated businesses are owned and controlled.
Most infiltrated businesses are private limited liability companies (Figure 4). They allow for greater fragmentation of the share capital, thus making it more difficult for law enforcement agencies to identify the beneficial owners of the infiltrated businesses and reducing the potential impact of seizure and confiscation.
Figure 4. Legal forms of infiltrated businesses by country3
Shareholders are divided among the following types: • OCG members (in more than half of infiltrated
businesses);
• Figureheads, i.e. relatives and legal entrepreneurs (especially in Italy), legal (shell) companies (particularly in the Netherlands), and professionals (in a limited number of cases in Italy and Sweden). Other control strategies include cross-shareholding and large networks of companies; groups of interconnected companies; frequent transformations of registered address, name and shareholders; and the creation of multi-jurisdictional structures.
figure 1
figure 2
figure 3
figure 10
figure 15
figure 18
figure 19
figure 20
Figure 24
figure 27
figure 31
figure 32
figure 34
figure 35
figure 36
figure 37
figure 39
figure 40
figure 41
figure 42
figure 43
figure 45
figure 46
figure 47
figure 48
figure 49
figure 50
figure 51
9.2% 49.8% 1.3% 17.1% 22.5% 54.8% 25.4% 3.1% 5.9% 10.8% 27% 25% 1% 15% 32% 43% 33% 20% 3% 1% 20% 1% 3% 5% 70% 100% 90% 80% 70% 60% 50% 40% 30% 20% 10% 0% 2002 4 1 3 2 3 1 1 4 15 1 62 2 47 1 139 89 40 2 5 3 39 2003 2004 2005 2006 2007 2008 2009 2010 2011 2012 2013 2014* 21% 15% 1% 4% 59% 21 11 8 20 10 164 34 35 43 23 20 25 15 10 5 0 1 2 3 4 5 6 7 8 9 10 >10 21% 16% 22% 21% 19% 70% 80% 90% 100% 40% 50% 60% 20% 30% 10% 0% 70% 80% 90% 100% 40% 50% 60% 20% 30% 10% 0% Italy(N=164) NetherlandsThe Slovenia(N=35) Sweden(N=43) (N=23)UK (N=34)
Italy
(N=21) NetherlandsThe Slovenia(N=8) Sweden(N=20) (N=10)UK (N=11)
Italy The Slovenia Sweden UK Netherlands 70% 14 5 6 2 40% 50% 60% 20% 30% 10% 0% 600 500 400 300 200 100 0 0.20% 0.30% 0.10% 0.50% 0.60% 0.70% 0.80% 0.40% 0.00% 2002 0.72% 0.51% 0.26% 0.47% 0.56% 0.33% 0.44% 0.47% 0.39% 0.36% 0.58% 0.52% 0.24% 2003 2004 2005 2006 2007 2008 2009 2010 2011 2012 2013 2014* 38 6 10 5 7 70% 80% 90% 100% 94 25 19 35 2 40% 50% 60% 20% 30% 10% 0% Italy
(N=164) NetherlandsThe Slovenia(N=35) Sweden(N=43) (N=23)UK (N=34) Public limited companies Private limited companies Partnerships Sole traders Other legal forms NA 20% 40% 60% 80% 100% 0%
figure 44
70% 80% 90% 100% 40% 50% 60% 90 11 22 26 17 20% 30% 10% 0% Italy(N=164) NetherlandsThe Slovenia(N=35) Sweden(N=43) (N=23)UK (N=34) 10 12 6 8 4 2 14 16 0 Money
laundering Formally legal activities Fraud Concealment of illegal Other activities 4 4 3 5 15 Italy
(N=164) NetherlandsThe Slovenia(N=35) Sweden(N=43) (N=23)UK (N=34) 70% 80% 90% 100% 40% 50% 60% 20% 30% 10% 0% 40% 50% 20% 30% 10% 0% Italy (N=137) Slovenia(N=32) Sweden(N=34) (N=18)UK 70% 80% 90% 100% 40% 50% 60% 20% 30% 10% 0% Italy
(N=21) NetherlandsThe Slovenia(N=8) Sweden(N=20) (N=10)UK (N=11)
Italy
(N=164) NetherlandsThe Slovenia(N=35) Sweden(N=43) (N=23)UK (N=34)
Italy
(N=164) NetherlandsThe Slovenia(N=35) Sweden(N=43) (N=23)UK (N=34) 70% 80% 90% 100% 40% 50% 60% 20% 30% 10% 0% 70% 80% 90% 100% 40% 50% 60% 20% 30% 10% 0% 30% 24.9% 0.8%
Academic study Judicial evidence
LEA report Media Other N = 2,380 N = 2,380 N = 2,380 N = 1,305 N = 604 Institutional report 15% 29% 0.4%
Local OCGs Italian mafias Motorcycles gangs Other OCGs NA
Italy The Netherlands Slovenia
Sweden UK
Academic study
Judicial evidence LEA report Media Institutional report
Academic study
LEA report Media
No. criminal charges with references to OCGs % OCGs in relation to all criminal charges
% OCGs in re lation to a ll cr iminal char ges Other Institutional report
No. criminal charges with references to OCGs
Academic study
Judicial evidence LEA report Media Institutional report N = 74 23% 24% 20% 32% 1% N = 140 N = 257 N = 70 N = 299 Academic study
LEA report Media Other Institutional report
No. filed criminal complaints for money laudering offences with references to OCGs No. filed criminal complaints for money laudering offences without references to OCGs
Academic study
Judicial evidence LEA report Media Institutional report
Italy The Netherlands Slovenia
Sweden UK
Italy The Netherlands Slovenia
Sweden UK
Money laundering Formally legal activities Fraud Concealment of illegal activities Other
Money laundering Formally legal activities Fraud
New business Already existing business NA Concealment of illegal activities Other
90 53 19 24 9 14 4 30 1 5 29 21 20% 40% 60% 80% 100% 0% Public limited companies Private limited companies Partnerships Sole traders Other legal forms NA
Italy The Netherlands Slovenia UK Sweden Public limited companies Private limited companies Partnerships Sole traders Other legal forms NA 20% 40% 60% 80% 100% 0%
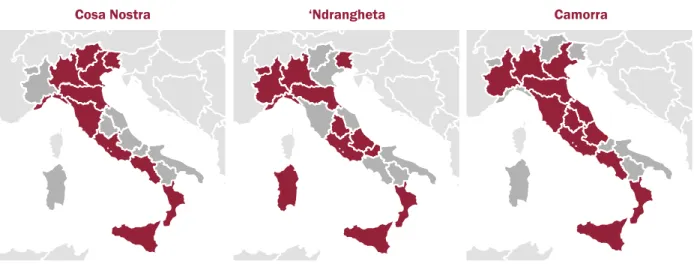
Cosa Nostra (N=14) ‘Ndrangheta (N=47) Camorra (N=74) Other Italian (N=13)
Chinese (N=16)
Money laundering Formally legal activities Fiscal fraud Corporate fraud Concealment of illegal activities Other
Relatives Professionals Legal entrepreneurs
Women among shareholders Women as majority shareholders Legal companies 53 7 6 14 9 8 3 1 8 4 1
Small Medium Large Very large NA
Italy The Netherlands Slovenia
Sweden UK
0 1-3 4-10 11-20 >20 NA
Management strategies of infiltrated businesses
Management strategies refer to the financial management of infiltrated businesses, i.e. how infiltrated businesses are financed and if they are able to produce profits.
The analysis of infiltrated businesses’ financing sources, use of assets and profitability shows:
• Low levels of financial net debt compared to legal, non-infiltrated companies. This indicates that legal businesses infiltrated by OCGs do not need to resort to banks and other financial institutions for loans to finance their activities;
• High levels of debts to suppliers and other debts. This may indicate the use of fictitious suppliers to conceal the injection of illicit proceeds as trade payables; • High levels of non-financial current credits (i.e.
inventory). High levels of current assets and cash could facilitate organised criminals in liquidating the business in the case of a law enforcement investigation and avoiding the risk of asset confiscation;
• Low profits compared to non-infiltrated businesses, regardless of the driver of infiltration. Infiltrated businesses often face economic difficulties, either because of their management by the members of the criminal group or because organised criminals target businesses with financial difficulties.
Key inputs for a common risk assessment model
The infiltration process is often difficult to detect. Risk assessment models help monitor the vulnerabilities of the legal economy that may be exploited by criminal organisations, thus anticipating the negative consequences and developing appropriate actions to recognise and prevent them.
Infiltration risk factors are those features of the territory, business sector and legal business that favour infiltration or highlight an already infiltrated business. Four dimensions are identified, each corresponding to specific risk factors: territory, business sector, ownership structure, and economic and financial management (Table 1).
3. The category ‘other legal forms’ includes: branches, non-profit organisations, and foreign companies.
Table 1. Dimensions and risk factors of OCG infiltration
Dimension Risk factor
Territory
Past evidence of OCG infiltration Presence of OCGs
Large urban areas
High level of infrastructural equipment
High level of shadow economy High level of corruption
Business sector
Past evidence of OCG infiltration Low level of competition
Low level of openness to foreign investments
Low level of technology Small average company size Low barriers to entry
Weak or developing regulation
Ownership structure of legal business
Limited company
Characteristics of shareholders (young/old, female shareholders) Corporate shareholders
Complex corporate ownership schemes and cross-shareholding Frequent change of company details
Small company size Financial
management of legal business
Low level of financial debt High level of current assets Low revenues and profitability
The risk of infiltration can be identified as a function of the features of the territory, business sector, and ownership structure and financial management of legal businesses. The list of risk factors identified in Project ARIEL – that could be further integrated and updated – is the first step towards the development of a risk assessment model to detect the infiltration of OCGs in European legitimate economies.
18
1. Introduction
1.1 Project ARIEL
This report presents the final results of project ARIEL – Assessing the Risk of the Infiltration of Organised Crime in EU MSs Legitimate Economies: a Pilot Project in 5 EU Countries (www.arielproject.eu). Project ARIEL was carried out with the financial support of the European Commission, DG Home Affairs, within the Prevention of and Fight against Crime (ISEC) Programme.
Project ARIEL was carried out by a consortium of five partners from European universities and research centres:
• Università Cattolica del Sacro Cuore-Transcrime, Italy (project coordinator)
• Netherlands Institute for the Study of Crime and Law Enforcement, the Netherlands
• University of Maribor-Faculty of Criminal Justice and Security, Slovenia
• Swedish National Council for Crime Prevention, Sweden
• University of Durham, United Kingdom
Europol was involved in the project as end user, together with national law enforcement agencies for each of the five EU member states: Ministero dell’Interno (Italy), Fiscal Information and Investigation Service (the Netherlands), Ministrstvo za Notranje Zadeve (Slovenia), Polisen-National Bureau of Investigation (Sweden),4 and Cumbria Police (United Kingdom).
Project ARIEL has aimed to identify the vulnerabilities of legitimate businesses to infiltration by organised crime groups. In particular, the project has pursued two objectives:
• To identify the methods used by different OCGs to infiltrate, control, and manage legitimate businesses in five selected EU member states (Italy, the Netherlands, Slovenia, Sweden, United Kingdom). These five EU MS were chosen in order to maximise the coverage of the EU territory.
• To identify the risk factors of OCG infiltration for the development of a common risk assessment model to detect the infiltration of legitimate businesses by criminal groups. The risk assessment model could be further updated and tested in other EU MS and international countries.
1.2 An understudied phenomenon
The complex relationship between organised crime groups and the legal economy has been debated by several authors (Arlacchi, 1983, 2007; Catanzaro, 1986, 1988; Cressey, 1969; Ianni & Reuss-Ianni, 1972; Smith, 1975; van Duyne, von Lampe, van Dijck, & Newell, 2005). Some authors argue that criminal organisations need to engage in legal activities because investment opportunities in the illegal markets are insufficient to reinvest the money accumulated with illicit activities (Barresi, 1999; Ruggiero, 1996). The proceeds of illegal activities are thus laundered through investments in the legal economy (Catanzaro, 1988; Centorrino & Signorino, 1997). Other authors suggest that infiltration of the legal economy is a constant feature of criminal organisations, which diversify their investments between legal and illegal markets (Fantò, 1999; Santino, 2006). Once the money has been invested in the legal economy, organised crime groups act like other entrepreneurs by responding to the normal market rules (Edelhertz & Overcast, 1994).
The boundaries between the legal and illegal economies are blurred. Economic activities are distributed along a continuum with criminal activities at one extreme and completely legal ones at the other (Ruggiero, 2008; Smith, 1975, 1980). Between these two extremes lie several other possible ways in which organised criminals engage in activities that are formally legal yet organised and managed illegally. The legal sectors in which criminal entrepreneurs operate, together with illegal activities, define the criminal economy as a whole (Becchi & Rey, 1994).
The organised crime and money laundering literature provides insights into the relationship between criminal organisations and the legal economy (e.g. Savona & Riccardi, 2015; van Duyne et al., 2005). However, there is little understanding of infiltration by organised crime groups in legal businesses, i.e. the drivers of infiltration, the locations and business sectors of the businesses targeted, the process of infiltration, and the strategies used to control and manage infiltrated businesses. Furthermore, scholars have mainly focused on specific sectors or countries, whereas cross-country comparative analyses are still lacking.
This study provides an unprecedented cross-national comparative analysis of organised crime infiltration of legitimate businesses in five EU MS. It focuses on the vulnerabilities of territories and business sectors, on criminal groups’ modi operandi, and on the characteristics of infiltrated businesses. It identifies the factors that facilitate or promote OCG infiltration of legal businesses and provides inputs for the development of a risk assessment model to detect infiltration.
4. The National Bureau of Investigation has recently changed its name into Nationell Operativ Avdelning (NOA).
1.3 Definition of organised crime
infiltration
The study of infiltration by organised crime groups of legal businesses faces several methodological challenges. The criminal infiltration of legal businesses is not criminalised in European countries. Therefore, neither legal definitions of the phenomenon nor police or judicial data are available at European and country level.
For the purpose of Project ARIEL, ‘infiltration of an organised crime group into a legitimate business’ means:
any case in which a natural person belonging to a criminal organisation or acting on its behalf, or an already infiltrated legal person, invests financial and/or human resources to participate in the decision-making process of a legitimate business.
Building on Europol’s definition of serious and organised crime (Europol, 2013a), ‘organised crime group’ refers to any criminal actor – from large organisations to loose networks of collaborating criminals – that falls under the definition provided by the EU Framework Decision on the Fight against Organised Crime (2008/841/JHA)5 and/or
is involved in serious crimes as identified by art. 83(1) of the Treaty on the Functioning of the European Union.6
Such broad definitions of organised crime have been criticised for their vagueness (Calderoni, 2008; Finckenauer, 2005; Hagan, 2006; Maltz, 1996). However, they make it possible to include a broad range of criminal organisations in the analysis, and to take account of the differences among European countries. Similarly, the broad definition of OCG infiltration of legal businesses makes it possible to include in the analysis a variety of legal businesses controlled and managed by organised criminals in the five countries covered by the project.
Operationalisation of organised crime infiltration
The definition of organised crime infiltration was operationalised to collect information and case studies. The following four elements need to be present to identify a reference or a case study of criminal infiltration:
• A criminal organisation;
• A natural person belonging to a criminal organisation or acting on its behalf, or an already infiltrated legal person;
• The investment of financial and/or human resources; • The participation in the decision-making process of a
legitimate business.
A criminal organisation. An ‘organised crime group’ refers to any criminal actor – from large organisations to loose networks of collaborating criminals – that falls under the definition provided by the EU Framework Decision on the Fight against Organised Crime (2008/841/JHA) and/or is involved in serious crimes as identified by art. 83(1) of the Treaty on the Functioning of the European Union.
A natural person belonging to a criminal organisation or acting on its behalf, or an already infiltrated legal person. The infiltration is carried out by a member of the criminal group or a person who is used as a cover by OCG members and acts as a straw man (e.g. relative, lawyer, notary). A legal person (e.g. cooperative, corporation, company) ultimately controlled by a criminal organisation through a member of the group or a straw man may also conduct the infiltration process. The investment of financial and/or human resources. The investment of money is not an essential requirement for the criminal infiltration of a legitimate business. Human resources may also be adopted to acquire control over the management (e.g. an OCG member becomes director of a legal company).
The participation in the decision-making process of a legitimate business. The OCG, through a member, a straw man, or an infiltrated legal business, influences the decision-making processes of a legitimate operating business, i.e. it is able to influence decisions about business strategies and future investments, as well as hiring, promotions and salary increases, subcontracting and supply contracts, security and controls.
5. Art. 1 of the 2008 EU Framework Decision on the Fight against Organised Crime defines a criminal organisation as: ‘a structured association, established over a period of time, of more than two persons acting in concert with a view to committing offences which are punishable by deprivation of liberty or a detention order of a maximum of at least four years or a more serious penalty, to obtain, directly or indirectly, a financial or other material benefit’ (Council of the European Union, 2008).
6. Art. 83(1) of the Treaty on the Functioning of the European Union identify serious crimes as: ‘terrorism, trafficking in human beings and sexual exploitation of women and children, illicit drug trafficking, illicit arms trafficking, money laundering, corruption, counterfeiting of means of payment, computer crime and organised crime’ (European Union, 2012).
20
1.4 Structure of the report
This report is organised into two parts. Part I maps OCG infiltration in the five countries covered by the project. In particular, Chapter 2 describes the territories and business sectors with references to criminal infiltration in legal businesses and their main features. For each country, in Chapters 3 to 7 a targeted profile identifies the regions and business sectors affected by the phenomenon and the criminal actors involved. Part II focuses on the drivers of infiltration (Chapter 8), the step-by-step infiltration process (Chapter 9), and the control and management strategies of infiltrated businesses (Chapters 10 and 11, respectively). Finally, Chapter 12 summarises the vulnerabilities of legitimate businesses to OCG infiltration as they emerged from the analyses presented in previous chapters. It then identifies risk factors to be included in a common risk assessment model to detect criminal infiltration of legal businesses in EU member states.
22
PART I. Mapping
organised crime
infiltration in legitimate
businesses
Previous studies on OCG investments in the legal economy have used data on confiscated assets as proxies for criminal investments (Kruisbergen, Kleemans, & Kouwenberg, 2015; Riccardi, 2014; Schneider, 2004; Transcrime, 2013b; van Duyne & Soudijn, 2009). Yet, the use of such data may lead to underestimation of certain types of assets because of the focus of law enforcement investigations on specific assets or the regulations on asset recovery (Savona & Riccardi, 2015). Furthermore, data on confiscated assets may provide an outdated analysis of criminal investments because of the time that elapses between the investment and the final confiscation (Transcrime, 2013b).
A recent study on organised crime investments in Europe has highlighted further issues in the case of cross-country analyses of criminal investments in the legal economy (Savona & Riccardi, 2015). First, regulations and practices on asset recovery vary across European countries. Second, only a few countries produce statistics on confiscated assets. Finally, data on confiscated assets tend to over represent movable assets (e.g. cash and bank accounts) and underestimate real estate properties and legal businesses (Savona & Riccardi, 2015).
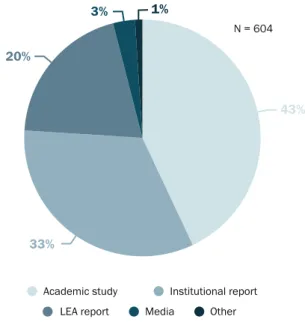
The study of criminal infiltration of legal businesses cannot rely on data on confiscated assets. The first part of this report builds on previous studies on organised crime investments in Europe (Savona & Riccardi, 2015) and analyses references of OCG infiltration in legitimate businesses from a variety of open sources, i.e. academic studies, judicial files, LEA reports and police operation files, institutional reports, newspaper articles (Figure 1).
Figure 1. Percentage of references to OCG infiltration in open sources by type of source
figure 1
figure 2
figure 3
figure 10
figure 15
figure 18
figure 19
figure 20
Figure 24
figure 27
figure 31
figure 32
figure 34
figure 35
figure 36
figure 37
figure 39
figure 40
figure 41
figure 42
figure 43
figure 45
figure 46
figure 47
figure 48
figure 49
figure 50
figure 51
9.2% 49.8% 1.3% 17.1% 22.5% 54.8% 25.4% 3.1% 5.9% 10.8% 27% 25% 1% 15% 32% 43% 33% 20% 3% 1% 20% 1% 3% 5% 70% 100% 90% 80% 70% 60% 50% 40% 30% 20% 10% 0% 2002 4 1 3 2 3 1 1 4 15 1 62 2 47 1 139 89 40 2 5 3 39 2003 2004 2005 2006 2007 2008 2009 2010 2011 2012 2013 2014* 21% 15% 1% 4% 59% 21 11 8 20 10 164 34 35 43 23 20 25 15 10 5 0 1 2 3 4 5 6 7 8 9 10 >10 21% 16% 22% 21% 19% 70% 80% 90% 100% 40% 50% 60% 20% 30% 10% 0% 70% 80% 90% 100% 40% 50% 60% 20% 30% 10% 0% Italy(N=164) NetherlandsThe Slovenia(N=35) Sweden(N=43) (N=23)UK (N=34)
Italy
(N=21) NetherlandsThe Slovenia(N=8) Sweden(N=20) (N=10)UK (N=11)
Italy The Slovenia Sweden UK Netherlands 70% 14 5 6 2 40% 50% 60% 20% 30% 10% 0% 600 500 400 300 200 100 0 0.20% 0.30% 0.10% 0.50% 0.60% 0.70% 0.80% 0.40% 0.00% 2002 0.72% 0.51% 0.26% 0.47% 0.56% 0.33% 0.44% 0.47% 0.39% 0.36% 0.58% 0.52% 0.24% 2003 2004 2005 2006 2007 2008 2009 2010 2011 2012 2013 2014* 38 6 10 5 7 70% 80% 90% 100% 94 25 19 35 2 40% 50% 60% 20% 30% 10% 0% Italy
(N=164) NetherlandsThe Slovenia(N=35) Sweden(N=43) (N=23)UK (N=34) Public limited companies Private limited companies Partnerships Sole traders Other legal forms NA 20% 40% 60% 80% 100% 0%
figure 44
70% 80% 90% 100% 40% 50% 60% 90 11 22 26 17 20% 30% 10% 0% Italy(N=164) NetherlandsThe Slovenia(N=35) Sweden(N=43) (N=23)UK (N=34) 10 12 6 8 4 2 14 16 0 Money
laundering Formally legal activities Fraud Concealment of illegal Other activities 4 4 3 5 15 Italy
(N=164) NetherlandsThe Slovenia(N=35) Sweden(N=43) (N=23)UK (N=34) 70% 80% 90% 100% 40% 50% 60% 20% 30% 10% 0% 40% 50% 20% 30% 10% 0% Italy (N=137) Slovenia(N=32) Sweden(N=34) (N=18)UK 70% 80% 90% 100% 40% 50% 60% 20% 30% 10% 0% Italy
(N=21) NetherlandsThe Slovenia(N=8) Sweden(N=20) (N=10)UK (N=11)
Italy
(N=164) NetherlandsThe Slovenia(N=35) Sweden(N=43) (N=23)UK (N=34)
Italy
(N=164) NetherlandsThe Slovenia(N=35) Sweden(N=43) (N=23)UK (N=34) 70% 80% 90% 100% 40% 50% 60% 20% 30% 10% 0% 70% 80% 90% 100% 40% 50% 60% 20% 30% 10% 0% 30% 24.9% 0.8%
Academic study Judicial evidence
LEA report Media Other N = 2,380 N = 2,380 N = 2,380 N = 1,305 N = 604 Institutional report 15% 29% 0.4%
Local OCGs Italian mafias Motorcycles gangs Other OCGs NA
Italy The Netherlands Slovenia
Sweden UK
Academic study
Judicial evidence LEA report Media Institutional report
Academic study
LEA report Media
No. criminal charges with references to OCGs % OCGs in relation to all criminal charges
% OCGs in re lation to a ll cr iminal char ges Other Institutional report
No. criminal charges with references to OCGs
Academic study
Judicial evidence LEA report Media Institutional report N = 74 23% 24% 20% 32% 1% N = 140 N = 257 N = 70 N = 299 Academic study
LEA report Media Other Institutional report
No. filed criminal complaints for money laudering offences with references to OCGs No. filed criminal complaints for money laudering offences without references to OCGs
Academic study
Judicial evidence LEA report Media Institutional report
Italy The Netherlands Slovenia
Sweden UK
Italy The Netherlands Slovenia
Sweden UK
Money laundering Formally legal activities Fraud Concealment of illegal activities Other
Money laundering Formally legal activities Fraud
New business Already existing business NA Concealment of illegal activities Other
90 53 19 24 9 14 4 30 1 5 29 21 20% 40% 60% 80% 100% 0% Public limited companies Private limited companies Partnerships Sole traders Other legal forms NA
Italy The Netherlands Slovenia UK Sweden Public limited companies Private limited companies Partnerships Sole traders Other legal forms NA 20% 40% 60% 80% 100% 0%
Cosa Nostra (N=14) ‘Ndrangheta (N=47) Camorra (N=74) Other Italian (N=13)
Chinese (N=16)
Money laundering Formally legal activities Fiscal fraud Corporate fraud Concealment of illegal activities Other
Relatives Professionals Legal entrepreneurs
Women among shareholders Women as majority shareholders Legal companies 53 7 6 14 9 8 3 1 8 4 1
Small Medium Large Very large NA
Italy The Netherlands Slovenia
Sweden UK
0 1-3 4-10 11-20 >20 NA
Source: Transcrime elaboration on DCI data
A systematic review of the literature collected information on OCG infiltration of legal businesses in Italy, the Netherlands, Slovenia, Sweden and United Kingdom between 2005 and 2013. When the date of infiltration was unclear, the date of the source was taken as a proxy (Savona & Riccardi, 2015).
Database on OCG infiltration
The Database on Criminal Infiltration (DCI) contains references to OCG infiltration in legal businesses in the five countries covered by the project. It stores the information collected during the review of the literature on OCG infiltration in legal businesses. It records details on the geographic location of the infiltration (NUTS 3 detail), the business sector of the infiltrated business (NACE 2-digit detail), and the criminal organisation involved.
Building on previous studies (Savona & Riccardi, 2015), each source may generate more than one reference, e.g. when a document reports a case of infiltration in various business sectors by the same criminal organisation (Box 1). In several cases, the documents lack information on the number of legal businesses infiltrated by OCGs. Therefore, the references do not necessarily correspond to a single business entity.
23
figure 1
figure 2
figure 3
figure 10
figure 15
figure 18
figure 19
figure 20
Figure 24
figure 27
figure 31
figure 32
figure 34
figure 35
figure 36
figure 37
figure 39
figure 40
figure 41
figure 42
figure 43
figure 45
figure 46
figure 47
figure 48
figure 49
figure 50
figure 51
9.2% 49.8% 1.3% 17.1% 22.5% 54.8% 25.4% 3.1% 5.9% 10.8% 27% 25% 1% 15% 32% 43% 33% 20% 3% 1% 20% 1% 3% 5% 70% 100% 90% 80% 70% 60% 50% 40% 30% 20% 10% 0% 2002 4 1 3 2 3 1 1 4 15 1 62 2 47 1 139 89 40 2 5 3 39 2003 2004 2005 2006 2007 2008 2009 2010 2011 2012 2013 2014* 21% 15% 1% 4% 59% 21 11 8 20 10 164 34 35 43 23 20 25 15 10 5 0 1 2 3 4 5 6 7 8 9 10 >10 21% 16% 22% 21% 19% 70% 80% 90% 100% 40% 50% 60% 20% 30% 10% 0% 70% 80% 90% 100% 40% 50% 60% 20% 30% 10% 0% Italy(N=164) NetherlandsThe Slovenia(N=35) Sweden(N=43) (N=23)UK (N=34)
Italy
(N=21) NetherlandsThe Slovenia(N=8) Sweden(N=20) (N=10)UK (N=11)
Italy The Slovenia Sweden UK Netherlands 70% 14 5 6 2 40% 50% 60% 20% 30% 10% 0% 600 500 400 300 200 100 0 0.20% 0.30% 0.10% 0.50% 0.60% 0.70% 0.80% 0.40% 0.00% 2002 0.72% 0.51% 0.26% 0.47% 0.56% 0.33% 0.44% 0.47% 0.39% 0.36% 0.58% 0.52% 0.24% 2003 2004 2005 2006 2007 2008 2009 2010 2011 2012 2013 2014* 38 6 10 5 7 70% 80% 90% 100% 94 25 19 35 2 40% 50% 60% 20% 30% 10% 0% Italy
(N=164) NetherlandsThe Slovenia(N=35) Sweden(N=43) (N=23)UK (N=34) Public limited companies Private limited companies Partnerships Sole traders Other legal forms NA 20% 40% 60% 80% 100% 0%
figure 44
70% 80% 90% 100% 40% 50% 60% 90 11 22 26 17 20% 30% 10% 0% Italy(N=164) NetherlandsThe Slovenia(N=35) Sweden(N=43) (N=23)UK (N=34) 10 12 6 8 4 2 14 16 0 4 4 3 5 15 Italy
(N=164) NetherlandsThe Slovenia(N=35) Sweden(N=43) (N=23)UK (N=34) 70% 80% 90% 100% 40% 50% 60% 20% 30% 10% 0% 40% 50% 20% 30% 10% 0% Italy (N=137) Slovenia(N=32) Sweden(N=34) (N=18)UK 70% 80% 90% 100% 40% 50% 60% 20% 30% 10% 0% Italy
(N=21) NetherlandsThe Slovenia(N=8) Sweden(N=20) (N=10)UK (N=11)
Italy
(N=164) NetherlandsThe Slovenia(N=35) Sweden(N=43) (N=23)UK (N=34)
Italy
(N=164) NetherlandsThe Slovenia(N=35) Sweden(N=43) (N=23)UK (N=34) 70% 80% 90% 100% 40% 50% 60% 20% 30% 10% 0% 70% 80% 90% 100% 40% 50% 60% 20% 30% 10% 0% 30% 24.9% 0.8%
Academic study Judicial evidence
LEA report Media Other N = 2,380 N = 2,380 N = 2,380 N = 1,305 N = 604 Institutional report 15% 29% 0.4%
Local OCGs Italian mafias Motorcycles gangs Other OCGs NA
Italy The Netherlands Slovenia
Sweden UK
Academic study
Judicial evidence LEA report Media Institutional report
Academic study
LEA report Media
No. criminal charges with references to OCGs % OCGs in relation to all criminal charges
% OCGs in re lation to a ll cr iminal char ges Other Institutional report
No. criminal charges with references to OCGs
Academic study
Judicial evidence LEA report Media Institutional report N = 74 23% 24% 20% 32% 1% N = 140 N = 257 N = 70 N = 299 Academic study
LEA report Media Other Institutional report
No. filed criminal complaints for money laudering offences with references to OCGs No. filed criminal complaints for money laudering offences without references to OCGs
Academic study
Judicial evidence LEA report Media Institutional report
Italy The Netherlands Slovenia
Sweden UK
Italy The Netherlands Slovenia
Sweden UK
Money laundering Formally legal activities Fraud Concealment of illegal activities Other
Money laundering Formally legal activities Fraud
New business Already existing business NA Concealment of illegal activities Other
90 53 19 24 9 14 4 30 1 5 29 21 20% 40% 60% 80% 100% 0% Public limited companies Private limited companies Partnerships Sole traders Other legal forms NA
Italy The Netherlands Slovenia UK Sweden Public limited companies Private limited companies Partnerships Sole traders Other legal forms NA 20% 40% 60% 80% 100% 0%
Cosa Nostra (N=14) ‘Ndrangheta (N=47) Camorra (N=74) Other Italian (N=13)
Chinese (N=16)
Money laundering Formally legal activities Fiscal fraud Corporate fraud Concealment of illegal activities Other
Relatives Professionals Legal entrepreneurs
Women among shareholders Women as majority shareholders Legal companies 53 7 6 14 9 8 3 1 8 4 1
Small Medium Large Very large NA
Italy The Netherlands Slovenia
Sweden UK 0 1-3 4-10 11-20 >20 NA
figure 1
figure 2
figure 3
figure 10
figure 15
figure 18
figure 19
figure 20
Figure 24
figure 27
figure 31
figure 32
figure 34
figure 35
figure 36
figure 37
figure 39
figure 40
figure 41
figure 42
figure 43
figure 45
figure 46
figure 47
figure 48
figure 49
figure 50
figure 51
9.2% 49.8% 1.3% 17.1% 22.5% 54.8% 25.4% 3.1% 5.9% 10.8% 27% 25% 1% 15% 32% 43% 33% 20% 3% 1% 20% 1% 3% 5% 70% 100% 90% 80% 70% 60% 50% 40% 30% 20% 10% 0% 2002 4 1 3 2 3 1 1 4 15 1 62 2 47 1 139 89 40 2 5 3 39 2003 2004 2005 2006 2007 2008 2009 2010 2011 2012 2013 2014* 21% 15% 1% 4% 59% 21 11 8 20 10 164 34 35 43 23 20 25 15 10 5 0 1 2 3 4 5 6 7 8 9 10 >10 21% 16% 22% 21% 19% 70% 80% 90% 100% 40% 50% 60% 20% 30% 10% 0% 70% 80% 90% 100% 40% 50% 60% 20% 30% 10% 0% Italy(N=164) NetherlandsThe Slovenia(N=35) Sweden(N=43) (N=23)UK (N=34)
Italy
(N=21) NetherlandsThe Slovenia(N=8) Sweden(N=20) (N=10)UK (N=11)
Italy The Slovenia Sweden UK Netherlands 70% 14 5 6 2 40% 50% 60% 20% 30% 10% 0% 600 500 400 300 200 100 0 0.20% 0.30% 0.10% 0.50% 0.60% 0.70% 0.80% 0.40% 0.00% 2002 0.72% 0.51% 0.26% 0.47% 0.56% 0.33% 0.44% 0.47% 0.39% 0.36% 0.58% 0.52% 0.24% 2003 2004 2005 2006 2007 2008 2009 2010 2011 2012 2013 2014* 38 6 10 5 7 70% 80% 90% 100% 94 25 19 35 2 40% 50% 60% 20% 30% 10% 0% Italy
(N=164) NetherlandsThe Slovenia(N=35) Sweden(N=43) (N=23)UK (N=34) Public limited companies Private limited companies Partnerships Sole traders Other legal forms NA 20% 40% 60% 80% 100% 0%
figure 44
70% 80% 90% 100% 40% 50% 60% 90 11 22 26 17 20% 30% 10% 0% Italy(N=164) NetherlandsThe Slovenia(N=35) Sweden(N=43) (N=23)UK (N=34) 10 12 6 8 4 2 14 16 0 Money
laundering Formally legal activities Fraud Concealment of illegal Other activities 4 4 3 5 15 Italy
(N=164) NetherlandsThe Slovenia(N=35) Sweden(N=43) (N=23)UK (N=34) 70% 80% 90% 100% 40% 50% 60% 20% 30% 10% 0% 40% 50% 20% 30% 10% 0% Italy (N=137) Slovenia(N=32) Sweden(N=34) (N=18)UK 70% 80% 90% 100% 40% 50% 60% 20% 30% 10% 0% Italy
(N=21) NetherlandsThe Slovenia(N=8) Sweden(N=20) (N=10)UK (N=11)
Italy
(N=164) NetherlandsThe Slovenia(N=35) Sweden(N=43) (N=23)UK (N=34)
Italy
(N=164) NetherlandsThe Slovenia(N=35) Sweden(N=43) (N=23)UK (N=34) 70% 80% 90% 100% 40% 50% 60% 20% 30% 10% 0% 70% 80% 90% 100% 40% 50% 60% 20% 30% 10% 0% 30% 24.9% 0.8%
Academic study Judicial evidence
LEA report Media Other N = 2,380 N = 2,380 N = 2,380 N = 1,305 N = 604 Institutional report 15% 29% 0.4%
Local OCGs Italian mafias Motorcycles gangs Other OCGs NA
Italy The Netherlands Slovenia
Sweden UK
Academic study
Judicial evidence LEA report Media Institutional report
Academic study
LEA report Media
No. criminal charges with references to OCGs % OCGs in relation to all criminal charges
% OCGs in re lation to a ll cr iminal char ges Other Institutional report
No. criminal charges with references to OCGs
Academic study
Judicial evidence LEA report Media Institutional report N = 74 23% 24% 20% 32% 1% N = 140 N = 257 N = 70 N = 299 Academic study
LEA report Media Other Institutional report
No. filed criminal complaints for money laudering offences with references to OCGs No. filed criminal complaints for money laudering offences without references to OCGs
Academic study
Judicial evidence LEA report Media Institutional report
Italy The Netherlands Slovenia
Sweden UK
Italy The Netherlands Slovenia
Sweden UK
Money laundering Formally legal activities Fraud Concealment of illegal activities Other
Money laundering Formally legal activities Fraud
New business Already existing business NA Concealment of illegal activities Other
90 53 19 24 9 14 4 30 1 5 29 21 20% 40% 60% 80% 100% 0% Public limited companies Private limited companies Partnerships Sole traders Other legal forms NA
Italy The Netherlands Slovenia UK Sweden Public limited companies Private limited companies Partnerships Sole traders Other legal forms NA 20% 40% 60% 80% 100% 0%
Cosa Nostra (N=14) ‘Ndrangheta (N=47) Camorra (N=74) Other Italian (N=13)
Chinese (N=16)
Money laundering Formally legal activities Fiscal fraud Corporate fraud Concealment of illegal activities Other
Relatives Professionals Legal entrepreneurs
Women among shareholders Women as majority shareholders Legal companies 53 7 6 14 9 8 3 1 8 4 1
Small Medium Large Very large NA
Italy The Netherlands Slovenia
Sweden UK
0 1-3 4-10 11-20 >20 NA
Box 1. Example of the coding process
‘During Operation Athena law enforcement agencies dismantled a Camorra clan involved in drug trafficking and seized a transportation company and a business involved in the wholesale of meat products, both registered in Naples’ (DIA, 2012, p. 82).
The DIA report produces two references to OCG infiltration: i) a legal business in the transportation sector in Naples, infiltrated by the Camorra; ii) a legal business involved in wholesale trade in Naples, also infiltrated by the Camorra.
The DCI contains 2,380 references to OCG infiltration in legal businesses in Italy, the Netherlands, Slovenia, Sweden and United Kingdom. Figure 2 shows the distribution of references to OCG infiltration across the five EU MS. More than half of the references concern evidence of criminal infiltration in Italy. Sweden and Slovenia are the two countries with the lowest number of references (140 and 74, respectively).
Figure 2. Percentage of references to OCG infiltration in open sources by country
Source: Transcrime elaboration on DCI data
The number of references also varies across organised crime groups (Figure 3). Italian mafias are involved in about half of the mentions of OCG infiltration. Local OCGs refer to British, Dutch, Slovenian and Swedish criminals in their own country. They also include Italian
criminal groups other than mafia organisations. Other OCGs refer to foreign criminal groups active in the five EU MS.
Figure 3. Percentage of references to OCG infiltration in open sources by type of OCG
Source: Transcrime elaboration on DCI data
Given the wide definition of OCG infiltration, the variety of sources, and the diverse nature of the information collected, the results of the analysis of the DCI should be interpreted carefully. First, references to OCG infiltra-tion of legal businesses do not correspond to single in-filtrated businesses. Therefore, they cannot be counted and analysed from a strict statistical standpoint. Four categories were created to analyse the referenc-es of OCG infiltration in legal businreferenc-essreferenc-es across regions and business sectors, i.e. ‘< Mean-0.5 SD’ (x ≤ mean - 0.5 ∙ standard deviation), ‘Mean-0.5 SD~Mean’ (mean - 0.5 ∙ standard deviation < x ≤ mean), ‘Mean~Mean+0.5 SD’ (mean < x ≤ mean + 0.5 ∙ standard deviation), and ‘> Mean+0.5 SD’ (x > mean + 0.5 ∙ standard deviation). The four categories are intended to provide a general understanding of the distribution of references across territories and business sectors, rather than identify those at low and high risk of criminal infiltration. Second, the information recorded in the DCI may partly reflect differences in priorities and levels of awareness and interest by local and national institutions, LEAs, scholars, and the media. Therefore, in some cases a relatively high number of references may be indicative of greater attention to organised and economic crime by national agencies and the media.
The lack of centralised data on OCG investments in legal economies presents methodological limitations.
24
Nonetheless, the broad variety of open sources has provided a useful, albeit preliminary, understanding of OCG infiltration in legitimate businesses in the five EU MS. The references are used as proxies for OCG infiltration and provide a very preliminary mapping of the activities of different organised crime groups across different sectors and different territories. In particular, they provide insights into various aspects of criminal infiltration of legal businesses, both at aggregate (Chapter 2) and country level (Chapters 3 to 7):
• The territories with evidence of infiltration; • The infiltrated business sectors;
• The actors involved in the infiltration.
2. Organised crime
infiltration in 5 EU
countries
7
2.1. Infiltrated territories
The DCI collects 2,380 references to OCG infiltration of legal businesses in the five countries covered by the project. Since such references cannot be counted and analysed from a strict statistical standpoint, four categories were created to identify regional and sectoral differences in OCG infiltration in Italy, the Netherlands, Slovenia, Sweden, and the United Kingdom.
Figure 2 above shows the distribution of references across the five EU MS. Some differences emerge in terms of references to OCG infiltration recorded by the literature. Italy gathers most of the references collected (55% of the whole DCI). Sweden and Slovenia are the two countries where lower numbers of references were found (6% and 3% of the whole DCI, respectively). These results may reflect differences in the incidence of the phenomenon in the five countries. At the same time, they may be biased by variations in the amount of data and information available and in the attention devoted to the phenomenon by scholars, LEAs, and the media. Figure 4 shows the references to OCG infiltration in legal businesses across regions. Each region is compared with its country’s total. Some territories emerge as characterised by several references to criminal infiltration: • Southern Italian regions with a traditional mafia
presence (i.e. Sicily, Calabria, and Campania), Lazio and Lombardy, two of the most populated and richest regions and those where police operations against OCGs have concentrated in recent years;
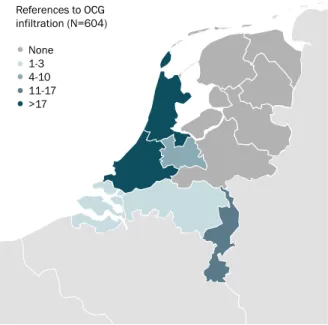
• North and South Holland, where the two largest cities of the country (i.e. Amsterdam and Rotterdam), as well as the main transport facilities (i.e. harbours and airports), are located;
• Western Slovenia, due to the high number of references to the Slovenian capital, Ljubljana; • The Stockholm and Malmö regions in Sweden, which
represent the first and third largest metropolitan areas respectively and the regions where the vast majority of economic activities are conducted; • South-Western Scotland (particularly Glasgow) and
the London area in the UK, i.e. thriving business areas. Figure 4. Number of references to OCG infiltration in open sources by region (NUTS 2). Percentage of the country total8 None <2% 3-8% 9-14% >14%
References to OCG infiltration. % of country total (N=1,480)
Source: Transcrime elaboration on DCI data
7. With the collaboration of Lorella Garofalo and Giulia Berlusconi (Università Cattolica del Sacro Cuore-Transcrime, Italy)
8. The number of references to OCG infiltration with information on the regions (NUTS 2) does not correspond with the total number of references. Details on the geographic location of the infiltration (NUTS 2) are available for 1,069 references in Italy, 125 references in the Netherlands, 69 references in Slovenia, 49 references in Sweden, and 168 references in the United Kingdom.