Alma Mater Studiorum – Università di Bologna
DOTTORATO DI RICERCA IN
SCIENZE AGROAMBIENTALI
Ciclo XXV
Settore Concorsuale di afferenza: 07/B1
Settore Scientifico disciplinare: AGR02/ AGRONOMIA E COLTIVAZIONI ERBACEE
SOIL ORGANIC CARBON DYNAMICS
UNDER PERENNIAL ENERGY CROPS
Presentata da:
ALESSANDRO ZATTA
Coordinatore
Dottorato
Relatore
PROF. GIOVANNI DINELLI
PROF.
ANDREA
MONTI
Questa tesi è dedicata a tre donne Lilia, Maria ed Agata.
Sommario
Introduction ... 5 Soil C sequestration ... 6 Effects of perennial crops on SOC ... 8 Belowground biomass ... 9 Soil respiration ... 11 Carbon budget – Net Ecosystem Exchange (NEE) ... 14 Effect of Nitrogen fertilization on NEE ... 15 Effect of ashes recycling on NEE ... 16 FIGURE INTRODUCTION ... 18 EXPERIMENT 1: ... 22 Effect of biomass‐ash amendments and nitrogen fertilization on above‐ and belowground biomass production of switchgrass (Panicum virgatum L.) ... 22 Abstract ... 22 Introduction ... 23 Materials and Methods ... 26 Field setting ... 26 Fertilization rate ... 26 Aboveground and belowground biomass collection and determination ... 27 Soil moisture measurements ... 28 Soil respiration measurements ... 28 Soil collection and determination of soil organic carbon (SOC) ... 29 Carbon budget – Net Ecosystem Echange (NEE) ... 30 Statistical analysis ... 30 Results ... 31 Climatic conditions ... 31 Above and belowground biomass ... 31 Soil C and N content ... 32 Soil CO2 flux ... 33 Carbon budget – Net Ecosystem Exchange (NEE) ... 33 Discussion ... 34 Above and belowground production ... 34Soil C and N content ... 36 Soil CO2 flux ... 37 Carbon budget – Net Ecosystem Exchange (NEE) ... 38 Conclusion ... 39 TABLES ... 40 FIGURE EXPERIMENT 1 ... 42 EXPERIMENT 2: ... 49 Land use change from grassland to Miscanthus: effects on soil carbon content and estimated mitigation benefit over six years ... 49 Abstract ... 49 Introduction ... 50 Materials and Methods ... 53 Experimental field site and trial set up ... 53 Determining stock changes in soil organic carbon ... 54 Data analysis ... 57 Results ... 57 Belowground biomass ... 57 Estimating the soil organic carbon content ... 58 Discussion. ... 59 SOC quantification by coring ... 59 Evidence for microbial ‘priming’ effects ... 60 Soil carbon stocks and the saturation point ... 61 Impacts of land use change from grassland to Miscanthus on SOC ... 62 TABLES ... 65 FIGURE EXPERIMENT 2 ... 66 FINAL CONSIDERATIONS ... 73 Acknowledgement ... 78 References ... 80
Introduction
Global warming is a term used to describe the gradual temperature rise in the earth probably due to the increase of CO2 concentration in the atmosphere (Metz et al., 2007) as a consequence of
increased use of fossil fuels (Fig. 1.1), land use changes, and soil erosion (Searchinger et al., 2008; Smith, 2008). The main target of Kyoto protocol (1992) and subsequent Doha conference (2012) was to reach an agreement to reduce global greenhouse gas (GHG) emissions. In this context, the European renewable energy directive 2009/28/EC (E.C., 2009) provides a legislative framework for reducing GHG emissions by 20%, while achieving a 20% share of energy from renewable sources by 2020. However, the growing prices of energy and continuous increment in the of demand alternative energy sources to reduce GHG emission (Hillier et al., 2009; Frische et al., 2010) has caused the utilization of food crops such as corn, sugar cane, soybeans, canola and oil palm for bio-fuels production (Pimentel and Patzek, 2005; Fargione et al., 2008) leading to food security issues (Krasuska et al., 2010; Tilman et al., 2011) and land competition problems (Searchinger et al., 2008; Frische et al., 2010). Land competition may cause direct and indirect land use change (LUC and i-LUC), i.e. conversion of undisturbed ecosystems as savannah, grassland, peatlands into agricultural land for food production and / or biofuels, with consequent carbon debts due to high CO2 emissions from soil as a result of SOM mineralization (Fargione et al., 2008). This
mineralization may cause carbon losses up to 60% in temperate areas and 75% in tropical soils (Lal, 2004a). The global historic C loss from soil, because of LUC and soil degradation, was estimated to be circa 50 Pg (Smith, 2008). It should be noted, however, that soil can be transformed from carbon source to carbon sink using correct land management and agronomic practices (Lal and Kimble, 1997; Lal, 2009), as well as converting arable lands into perennial crop lands (Fargione et al., 2008; Powlson et al., 2011) or by restoring forest (Righelato and Spracklen, 2007). In fact, soil contains two times organic C more than the atmosphere and 2.3 times more than the biota (Lal and Kimble,
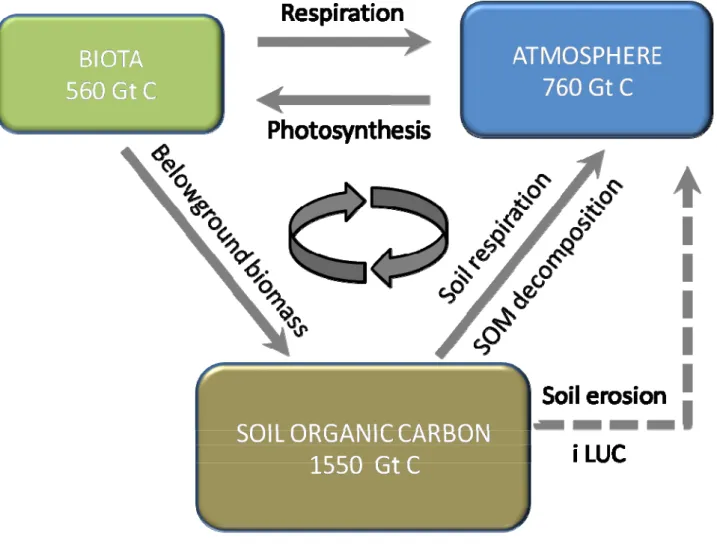
1997; Schlesinger, 1997), so it can represent a large container of organic carbon (Fig.1.2). It was estimated that by increasing 1 Mg C ha-1 in cropland soils, it could compensate between 5 and 15% of global emissions of fossil fuels (Lal, 2004a). The positive aspects of increasing soil organic carbon (SOC) are numerous, such as soil stabilization (Six et al., 2000c; Conant et al., 2004), soil aggregates formation (Bronick and Lal, 2005b; Jastrow et al., 2007), increase of fertility (Lal, 2004a) and soil water capacity (Lal and Kimble, 1997). Ecosystems that can have high potential for carbon sequestration are croplands (Zan et al., 2001; Powlson et al., 2011), grazing / range land (Lal, 2004b) and degraded / desertified soils (Lemus and Lal, 2005; Hillier et al., 2009). On the other hand the conversion of complex ecosystems such as forests, grassland, peatlands into arable lands can cause biodiversity losses (Frische et al., 2010).
Soil C sequestration
The “Soil C sequestration” describe the increases of soil organic carbon (SOC) subtracting C from atmosphere through land management. SOC is the dynamic part of the carbon cycle that includes the carbon contained in the atmosphere, in soil, in water, and in large part of the biosphere, that is both above and belowground biomass (Lal, 2004a). SOC stabilization occurs via biochemical processes that can be both biotic and abiotic. These series of mechanisms are known as humification that transforms organic matter into more stable and resistant forms to decomposition processes (Jastrow et al., 2007). The SOC residence time (τ) in the soil is determined by the ability of the soil to accumulate C (Luo et al., 2003) and the parameters that are involved in C accumulation are water content (Young and Ritz, 2000), pH (Jastrow et al., 2007), nutrient availability (Six et al., 2002), clay content (Six et al., 2000a; Bronick and Lal, 2005b), geological factors (Baldock and Skjemstad, 2000; Six et al., 2000b) and vegetation type (Lal and Kimble, 1997; Anderson-Teixeira et al., 2009). SOC sequestration favors soil stabilization true formation of
soil aggregates (Six et al., 2000a) that reduce soil leaching, increases water retention (Lal, 2008b) and fertility (Lal and Kimble, 1997; Lal, 2004a). There are several agronomic techniques to stabilize or increase SOM. For example, in soybean soil amendment application favors SOM accumulation and root proliferation (Hati et al., 2006), while organic fertilization and manure application are the most common practices for maintaining high SOM level (Smith, 2004). Even techniques such as minimum-tillage or no-tillage limit soil disturbance and thus SOM mineralization, favoring crop residues humification (Six et al., 2000a; Mrabet et al., 2001) and soil biodiversity increment (Lupwayi et al., 2001; Bronick and Lal, 2005a). Furthermore, in undisturbed cultivation systems, such as no-tillage practice, fungal hyphae growth is favored that leads to the formation of bridges between soils and litter (Beare et al., 1992) and favor fungal and bacteria proliferation (Haynes and Beare, 1997). Fungi, thanks to their cell wall characteristics, which consist of melanin and chitin, are relatively resistant to degradation (Guggenberger et al., 1999) and their residues contribute to SOM formation (West et al., 1987). On the contrary, the contribution to SOM formation by bacterial components is limited because of more vulnerable membranes (West et al., 1987; Suberkropp and Weyers, 1996). Biochemical and physicochemical process are involved in SOM decomposition, polymerization and turnover (Jastrow et al., 2007). Decomposition involves mainly the cellulose and lignin components of the biomass. Cellulose is easily degradable by bacteria and fungi, while lignin is more complex and is degraded predominantely by fungi (Conesa et al., 2002). Polymerization is generally spontaneous and takes place between soil particles and remaining molecules after degradation processes and is influenced by water content, pH and by catalysts, such as enzymes produced by fungi (Jastrow et al., 2007). Moreover, soil is a complex system where the biological community interacts with soil physical and chemical properties and many times determines its characteristics (Jastrow et al., 2007). The potential for soil to sequester C is linked with regional climate, soil properties and land management (West and Six, 2007) and it is limited (Powlson et al., 2011)
Effects of perennial crops on SOC
Perennial grasses used for energy end use are characterized by high yield potential, deep root systems, low fertilization input and conservative agricultural practices (Lewandowski et al., 2003). SOC accumulation can be favored by the cultivation of perennial crops (Paustian et al., 1997; Lemus and Lal, 2005; Anderson-Teixeira et al., 2009; Powlson et al., 2011), including dedicated energy crops such as switchgrass and Miscanthus (Lemus and Lal, 2005; Clifton-Brown et al., 2007; Liebig et al., 2008). The large belowground biomass production of perennial energy crops and the reduced agricultural practices needed to cultivate them result in low SOM mineralization (Bronick and Lal, 2005b; Lemus and Lal, 2005). Therefore perennial energy crops have potential to store C in the soil and reduce GHG emissions (Zan et al., 2001; Clifton-Brown et al., 2004; Lee et al., 2007). For example, it was demonstrated that by converting cropland to perennial energy crops, the SOC stock can increases from 1 to 1.2 Mg ha-1 y-1 in switchgrass (Frank et al., 2004; Monti et al., 2012) and from 0.6 to 1.2 Mg ha-1 y-1 in Miscanthus (Kahle et al., 2001; Clifton-Brown et al., 2007). On the other hand, by converting a grassland to a perennial energy crop, the SOC tends to remain constant (Anderson-Teixeira et al., 2009) because the initial SOC content of grassland is high (Conant et al., 2001). Moreover, converting degraded agricultural soils into perennial energy croplands can result in better soil conditions and quality since the accumulated SOC improve the soil structure (Six et al., 2000a), fertility (Lal, 2004a), reduce soil leaching (Lal and Kimble, 1997). In general, when converting a cropland into a perennial grass, the accumulation of SOC is faster in the first years of introduced new culture, then this process becomes slower over time up to zero change (West and Six, 2007), when a new equilibrium in the system is reached (West and Six, 2007; Smith et al., 2008b). In temperate areas, for example it was indicated that the new
equilibrium can be reached after 100 years of land use change (Paustian et al., 1997; Smith et al., 2008b), but in tropical soils equilibrium could be reached faster (Smith et al., 2008a).
Cultivating perennial energy crops can favor SOC due to large and deep root system (Ma et al., 2000a; Monti and Zatta, 2009) that is the main C vehicle into the soil (Kuzyakov, 2002; Nguyen, 2003). However, the large part of C returns to atmosphere through soil respiration, which is the second largest source of CO2 emission of the eco-system (Raich and Schlesinger, 1992; Kuzyakov,
2006). These two factors, belowground biomass and soil respiration, are closely connected and their appropriate determination and quantification is important to understand the carbon cycle and the real potential of perennial energy crops to input large quantities of C into the soils.
Belowground biomass
The root system is the main water and nutrient absorption organ of a plant (Passioura, 2002). It has been studied mainly to understand complex mechanisms involved in its functioning (Passioura, 1996; King et al., 2003; Dardanelli et al., 2004), like plant adaptability to different environmental conditions (Jackson et al., 1996) or water stress (Robertson and Fukai, 1994; Chaves et al., 2002; Zegada-Lizarazu et al., 2012). Belowground biomass is the main vehicle for storing organic carbon into the soils (Kuzyakov, 2002; Nguyen, 2003). Its development in depth affect the SOC distribution and accumulation within the soil profile (Frank et al., 2004; Lemus and Lal, 2005; Monti and Zatta, 2009). In fact, the belowground biomass developed in deep layers is less subjected to mineralization (Lemus and Lal, 2005), therefore has a greater permanence in the subsoil (Ma et al., 2000c, a).
Through the photosynthetic process atmospheric CO2 is transformed into carbohydrates (Paul
processes (Paul and Pellny, 2003). It was estimated that 50% of the photosynthetic C-derived was exported from shoots to belowground biomass (Vanderwerf et al., 1987; Nguyen, 2003). In a review Nguyen (2003) reported that part of this C is lost by the roots (17%), part by the rhizosphere respiration (12%), and part is lost as soil residues (5%). Plant age plays a primary role in this complex mechanism, since older roots release less C than younger roots (Swinnen et al., 1994). Besides that, a portion of the C fixed by photosynthesis (approximately 30%) can be allocated to mycorrhizae in symbiosis with plant roots (Nehls and Hampp, 2000).
More C is released into the soil through rhizodeposition, i.e. the process by which living roots release organic carbon into their surroundings. The release process occurs through different mechanisms such as i) Sloughing-off of root border cells produced during the growth of the root cap (Sievers and Hensel, 1991). In this process, the root apical meristems, that are arranged in layers, sloughs off cells in order to reduce soil resistance to root growth (Bengough and McKenzie, 1997), regulate rhizosphere microbial populations, promote gene expression in symbiotic microorganisms (Hawes et al., 2000), and protect the meristemic apex against heavy metals (Morel et al., 1986; Kozhevnikova et al., 2007). ii) production of root exudates (Bretharte and Silk, 1994; Jones, 1999) that are constituted by starch, complex sugars, organic acids, alcohols, proteins, hormones and enzymes (Hodge et al., 1996; Grayston, 2000). In general the microbial component of the soil (Nguyen and Henry, 2002) and root system (Vinolas et al., 2001) assimilate these exudates in order to favor nutrient mobility and up take. Exudates serve also to balance the pH around root and to facilitate root exploration (Bretharte and Silk, 1994; Jones, 1999). Besides that, it is indicated that the production of exudates is enhanced under stress conditions (i.e., nutritional deficiency or toxicity and proliferation of pathogens (Nguyen, 2003). iii) mucilage secretions (Abeysekera and Mccully, 1993), that are produced within the Golgi apparatus and are mainly constituted of polymerized sugars (fucose, galactose, glucose, arabinose, etc.) and proteins (Bacic et al., 1987).
Mucilages favour soil aggregates formation (Habib et al., 1990; Morel et al., 1991) and protection against heavy metals (Morel et al., 1986). Its permanence into the soil is limited because of its low molecular weight (Kuzyakov, 2006), for example in corn, 45% of mucilage are degraded by microorganisms in about 2 weeks (Mary et al., 1993; Nicolardot et al., 2001). Moreover, a mucilage film around the roots play an important role in drought resistance (Watt et al., 1993). So, each of these mechanisms play a fundamental role in the root exploration of the soil profile, root cap protection, nutrients availability (N, P, K), and reduced ion toxicity (Morel et al., 1986). In addition, all of these mechanisms are sources of C, essential for the metabolic processes of soil microorganisms (Kuzyakov, 2006).
Soil respiration
Soil respiration is one of the largest flux in most ecosystems (Raich and Schlesinger, 1992) and can account for 60-90% of the total ecosystem respiration (Longdoz et al., 2000). Soil CO2 flux
negatively influence SOC deposition (Paustian et al., 2000) and small changes in soil CO2 flux
could have large impacts on global CO2 emissions (Schlesinger and Andrews, 2000). Soil
temperature is the main factor that influence soil CO2 flux (Lou et al., 2004; Lee et al., 2007). Soil
moisture is another factor that has a significant effect on soil respiration (Hollinger et al., 2004) but independent from that of soil temperature (Frank et al., 2002; Lee et al., 2007).
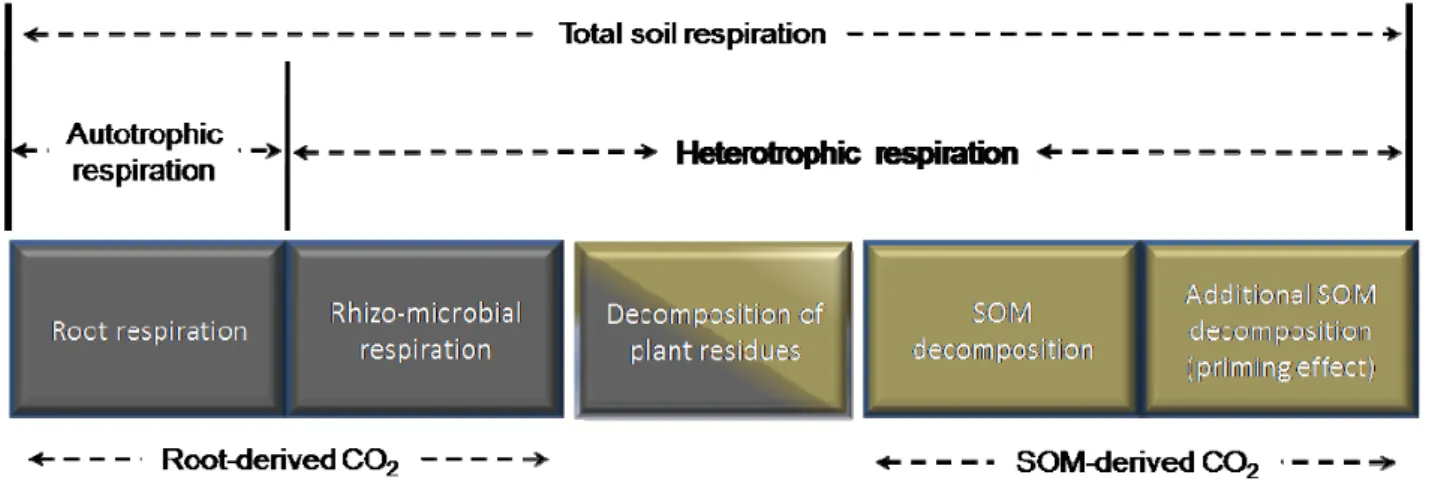
Kuzyakov (2006) suggest five sources of soil CO2 efflux (Fig. 1.3), i.e. i) root respiration, ii)
rhizo-microbial respiration of rhizodeposits from living roots (root exudates, mucilages, etc.), iii) microbial decomposition of dead plant residues, iv) SOM microbial decomposition and v) priming effect, i.e. faster SOM decomposition and carbon turnover because of the accumulation of large amounts of fresh organic matter into the soil (Kuzyakov, 2002). These five categories can, however, be grouped into two main soil respiration (Rs) sources:
• Autotrophic respiration (Ra) is the soil CO2 flux derived from the root system, i.e. derives
from the photo-assimilates used in the synthesis of new plant tissues and maintenance of living tissues (Luyssaert et al., 2007).
• Heterotrophic respiration (Rh) is the soil CO2 flux derived from the microorganisms activity
such as decomposition of rhizodeposits from living roots, plant residues and SOM.
The boundaries among these two CO2 sources are, however, not clear. Indeed a clear separation
between root respiration and rhizodeposits degradation (root exudates, mucilages, etc.) may not be possible, or even realistic because of impossibility to divide it with conventional techniques described in the paragraph below (Bond-Lamberty et al., 2004). Also it is difficult to distinguish between CO2 flux from degradation of fresh plant residues and degradation of SOM (Kuzyakov,
2006). Adding to that, CO2 flux from roots can derive from the symbiosis between roots and ecto
and endomycorrhiza fungi, among others (Jones et al., 2004).
In order to have correct net ecosystem exchange values accurate measurements of Rs and Ra are
needed (Bond-Lamberty et al., 2004; Smith et al., 2010). Among the different methods developed for determining Rs partitioning, the “root exclusion technique” consists on soil CO2 flux
measurements in unplanted (Rh) and planted soils (Rs). This technique can give crude estimations of
Rs since soil conditions (i.e. soil water regime and temperature) with and without plants differ
considerably (Ross et al., 2001). "Shading or clipping" of aboveground biomass is considered a less invasive method. The method is based on inhibiting photosynthesis and thus no new photo-assimilates are made available to the roots system. The advantage of this method is that in the short term water content and nutrient turnover are the same in treated and untreated plots. The disadvantages of this method are that residues of organic compounds previously fixed can be used by the root system (Kuzyakov, 2006), and that root exudation is increased after defoliation/shading (Fu and Cheng, 2004). The “regression technique” (Kucera and Kirkham, 1971) is another method
to estimate Rs. This method assumes a linear relationship between root biomass and the amount of
CO2 respired by the roots and the rhizosphere microorganisms; the amount of CO2 derived from
SOM decomposition corresponds to the intercept of the regression line between root biomass (independent variable) and total CO2 emitted from the soil (dependent variable). This technique is
simple and has been used by several authors (Brook et al., 1983; Hanson et al., 2000) with similar results, i.e. Rh varies between 40 to 60% of the total Sr. “Continuous and pulse labeling of plant in 14CO
2 or 13CO2 atmosphere”. The isotopic technique consists of subjecting the plants for a
prolonged period of time to an enriched atmosphere with heavy C isotopes (13C and 14C). The enrichment period usually lasts form early stages of development (first leaves) until the end of the experiment. This technique allows the identification of the proportion of CO2 derived from plant
roots, as indicated by the abundance of 13C or 14C atoms, and the proportion of CO2 derived from
SOM respiration, which is indicated by the abundance of light C atoms (Whipps, 1987). The “13C natural abundance” technique is based on the natural abundance of heavy C atoms (13C) and its discrimination during CO2 assimilation by the photosynthetic apparatus of C3 plants compared to C4
plants. Briefly, Rubisco Enzyme (C3 plants) leads to 13C depletion compared with air CO2 (around
-19 ‰), as a consequence δ13C concentration in C3 plant tissues is about -27 ‰. While,
phosophoenol pyruvate carboxylase (PEP) (C4 plants) discriminates less 13C therefore the typical
δ13C value in C4 plant tissues is around -13 ‰. So in the case of fields are cultivated with C3 or C4
plants only, the δ13C values of the SOM will be close to those of C3 or C4 plants (-27 and -13%o,
respectively; (Cheng, 1996). This methodology can be easily used in the field because atmospheric isolation is not necessary and new technologies such as NIRS (Horner et al., 2004) or FT-IR spectroscopy (Griffis et al., 2005) can be used, and they permit a continuous and long term measurements of isotopic flux in ecosystem.
Carbon budget – Net Ecosystem Exchange (NEE)
Biomass crops play a fundamental role in reducing CO2 emissions (Lal and Kimble, 1997; Fargione
et al., 2008; Anderson-Teixeira et al., 2009). Moreover, soils, where plant biomass finds its foundation, are the second largest sink of organic carbon (Fig. 1.2) therefore the magnitude of their contribution to reduce GHG emission is of fundamental importance. As shown in Figure 1.4, through the photosynthetic processes atmospheric C is transformed into carbohydrates and amino acids for tissue formation and the maintenance of biochemical processes (Amthor, 2000; Paul and Foyer, 2001). The fixed C is again released into the atmosphere through plant and soil respiration (Raich and Schlesinger, 1992; King et al., 2006). Comparing different biomes (from desert to tropical forest) the global balance between net primary productivity (50-60 Pg C/yr), i.e. the sum of above- belowground and autotrophic respiration, and ecosystem respiration (50-75 Pg C/yr) was considered virtually nil (Houghton and Woodwell, 1989). On the contrary, the close relationship between these two components (Raich and Schlesinger, 1992) showed that an increase of organic matter in the soil corresponds to an increase in soil respiration (Hogberg and Ekblad, 1996).
In order to understand if soil can be considered a C container greater understanding of the C cycle has become important for mitigation GHG emissions, food and energy security and biodiversity (Smith et al., 2012). There are a number of papers in the last decades that give carbon balance budgets at local to continental levels. Monitoring C cycle is important for net ecosystem exchange (NEE), or net ecosystem production (NEP), computation, that is the difference between CO2 entering an ecosystem and all the CO2 leaving the ecosystem during growing period (Smith et
al., 2010). In order to calculate the carbon balance of an eco-system it is necessary to quantify the gross primary production (GPP) and heterotrophic respiration (Rh). GPP represents the gross uptake
of CO2 that is used in photosynthesis (Ciais et al., 2010) and it is the sum of net primary production
GPP= NPP + Ra
However part of the assimilated carbon was used by living roots to produce organic compounds like exudates, secretions, and sloughed-off root cells and part was used for the roots turnover, that are used by soil microorganisms activities which contributes to Rh. Thus in eco-systems net ecosystem
Exchange (NEE) is given by:
NEE= GPP – Rh
Effect of Nitrogen fertilization on NEE
Crop response to fertilization depends on species, climatic conditions, rainfall, harvest time and soil mineralization (Vogel et al., 2002). Nitrogen fertilization plays an important role in production cost, energy consumption, and environment management (McLaughlin and Kszos, 2005; Nelson et al., 2006). In agriculture 50% of energy inputs derive from nitrogen fertilization (Barbanti et al., 2006) so it’s accurate management result in optimized production systems. On the other hand, excessive N fertilization create problems of leaching (Dinnes et al., 2002), NH3 (Bouwman et al., 2002a), N2O
(Mosier et al., 1996; Bouwman et al., 2002b) and NOx (Lee et al., 1997; Olivier et al., 1998)
emissions.
Nitrogen fertilization stimulates root development (Lemus and Lal, 2005) which in turn results in SOC accumulation (Schuman et al., 2002). For example such relationships were noted in semiarid soils (Rasmussen and Rohde, 1988), annual crops (Grant et al., 2001) and rangeland (Schuman et al., 2002). In any case, the positive environmental effects of increasing SOC through larger root systems is counterbalanced by CO2 costs associated with the N fertilizer production
(Gregorich et al., 1996). The low agricultural inputs like N fertilization of perennial energy crops such as switchgrass and Miscanthus are considered a source of short-term CO2 emissions mitigation
(Dohleman et al., 2012). Indeed, it is reported that perennial energy crops do not respond significantly to elevated N fertilization levels at both above- and belowground biomass levels (Ma et al., 2001; Clifton-Brown et al., 2007; Lee et al., 2007). The range of optimal N fertilization in these species varies from 70 to 100 kg ha-1 (McLaughlin and Walsh, 1998; Cadeaux and Ng, 2012), 2012) with acceptable production using 50 kg N ha-1 (McLaughlin and Kszos, 2005; Cadeaux and
Ng, 2012). Another aspect to take in consideration in a well managed fertilization program is the harvest time. In general, harvests carried out at the end of the growing season or after first cold allow most of nutrient to move back to the rhizomes (Dohleman et al., 2012). Such nutrient reserves allow the crops a rapid re-growth in the next spring (Vogel et al., 2002; Heaton et al., 2009). Therefore, the need of supplemental fertilization is reduced (Lewandowski et al., 2003). In addition, the harvest frequency has a significant effect on nutrient reserves. For example a double harvest system in switchgrass (the first during full flowering and second one in autumn) remove twice N than a single cut system at the end of growing season (McLaughlin and Kszos, 2005). Besides that, optimizing N application allows at the same time good productivity and environmental and economic benefits (Lemus et al., 2008), such as reduced of N2O emission (up to 40%; Monti et al.
(2012)).
Effect of ashes recycling on NEE
The resulting ashes from the combustion processes of biomass can be a source of plant nutrients such as Ca, K, and P (Weber et al., 1985; Perucci et al., 2006; Moilanen et al., 2012). But at the same time the addition of ash to the soil can influence soil pH (Silfverberg and Huikari, 1989; Perucci et al., 2008), microbial activity (Perkiomaki and Fritze, 2002), field capacity (Chang et al., 1977), soil structure and soil salinity (Clapham and Zibilske, 1992). Studies concerning the influence of ash in the soil properties were mainly carried out in North Europe (Moilanen et al.,
2002; Saarsalmi et al., 2012). For example ash addition in peatlands reduce soil acidity and increase soil CO2 flux, probably because of enhanced soil microbiological activity (Weber et al., 1985;
Moilanen et al., 2002). Some studies were also conducted in alkaline soils, which are typical of Mediterranean areas, and in contrast with the results obtained in acid soils, ash addition caused the reduction of microbial biomass and enzymatic activity (Perucci et al., 2006; Perucci et al., 2008).
Cultivating perennial energy crops on cropland and / or marginal lands can contribute to the reduction of GHG emission through C storage into the soil (Anderson Teixeira et al., 2009; Fargione et al., 2008; Powlson et al., 2011). In this thesis two cases of land use change were studied:
1) from cropland to switchgrass in high productive area (IT) where (i) evaluating evaluated the interactive effects of ash amendments and nitrogen fertilization on the above and belowground biomass production of switchgrass in Po valley (Italy), (ii) soil C content after land use change from cropland to switchgrass and (iii) estimation of Net Ecosystem Exchange (NEE).
2) from marginal grassland to Miscanthus in Wales evaluating the (i) soil organic carbon (SOC) stock variation by converting grasslands to different Miscanthus genotypes; ii) the relationship between carbon accumulation rate and root biomass; iii) estimation of the fate of soil carbon over the life cycle of a Miscanthus crop.
FIGURE INTRODUCTION
Figure 1.3. Source of CO2 efflux from soil (adapted from Kuzyakov, 2006).
EXPERIMENT 1:
Effect of biomass-ash amendments and nitrogen fertilization on
above- and belowground biomass production of switchgrass (Panicum
virgatum L.)
Abstract
Switchgrass is one of the most promising perennial energy crops. It could significantly contribute to limiting GHG emissions through replacing fossil fuels whilst also sequestering a considerable amount of carbon into the soil. Nonetheless, the production of CHP from biomass generates a large amounts of ash which has to be opportunely allocated or profitably recycled, e.g. as nutrient amendments (Perucci et al., 2006). Therefore, the objective of this study was to (i) evaluate the interactive effects of ash amendments and nitrogen fertilization on the above and belowground biomass production of switchgrass in Po valley (Italy), (ii) determine the soil C content after land use change from cropland to switchgrass and (iii) estimation of Net Ecosystem Exchange (NEE). Nitrogen fertilization did not influence crop productivity in the first two years while after second year a rate of 100 kg ha-1 y-1 of N seems to be the more adequate fertilization. Ash addition did not
have an effect on above and belowground biomass, instead it reduced soil CO2 flux, but the effect
gradually decreased with the age of plantation. Belowground biomass productivity increased from 8.5 (T0) to 22.5 (T5) Mg ha-1. Higher increments were noticed in upper soil layers. SOC increased in
the whole soil profile analysed (0-60 cm) but significant increments were found only in deep layers (30-60 cm) probably because the "priming effect" increased microbial activity and consequently reduced SOC in shallow layers (0-30 cm). The Net Ecosystem Exchange (NEE) increased with the application of ash to the soil but its effect gradually decreased with the time. On average NEE was
9.5 Mg ha-1 y-1. High switchgrass yield could be obtained with “low input”, instead large amount of belowground biomass did not promote SOC accumulation but stimulated a “priming effect”. Switchgrass was confirmed to be environmental friendly thanks to positive NEE.
Keywords: switchgrass, bioenergy, SOC, land use change, ash, soil CO2 flux, priming effect
Introduction
The increasing emissions of greenhouse gases (GHG's) into atmosphere has encouraged interest in the role of soil and plant biomass on reducing atmospheric GHG concentrations (Cole et al., 1997; Paustian et al., 1997; Watson et al., 2000). Soils contain about 2.7 times the carbon present in the atmosphere (Schlesinger, 1997) and biomass cultivation may favour soil carbon storage which varies between 1 and 2 x 10⁶ Mg C yr-1 (Cannell, 2003). For example, it was estimated that one-meter soil depth may contain from 30 to 800 Mg ha-1 of soil organic carbon (SOC) (Lal, 2004b). Carbon sequestration is an important component of the life cycle for the production of bioenergy crops (Adler et al., 2007) and may be a key aspect in determining GHG reduction potential compared to fossil fuels (Anderson-Teixeira et al., 2009). Land use change from cropland to grassland leads to substantial storage of SOC (Lemus and Lal, 2005; Fargione et al., 2008; Anderson-Teixeira et al., 2009; Powlson et al., 2011), but also raises ethical issues if bioenergy crops are cultivated on conventional land used for food or feed production (Field et al., 2007). In addition to that, by using croplands for bioenergy end use may cause displacement of food production in peatlands, grassland and forest causing a carbon debt because of SOM mineralization due to disturbance of ecosystem (Fargione et al., 2008). So cultivation of perennial grasses in marginal or degraded lands would be advisable because of their adaptability to poor soil conditions and environmental benefits (Campbell et al., 2008). Moreover, the SOC increase entails a number of agronomic advantages such as aggregation of clay particles (Six et al., 2002), water drainage (Lal
and Kimble, 1997) and increasing the residual fertility (Lal, 2004a). For example, the increase of one ton of SOC can increase wheat (27-40 kg ha-1) and maize (3-10 kg ha-1) production (Lal, 2004a). Perennial crops such as switchgrass are considered one of the most promising crops for SOC storage and reduction of GHG emissions (McLaughlin and Kszos, 2005; Sanderson, 2008; Anderson-Teixeira et al., 2009). Due to its well-developed root system, that can reach 3 m in depth and 30 Mg ha-1 of belowground biomass (Ma et al., 2000b), switchgrass can stock large quantities of SOC in deep soil layers (Ma et al., 2000a; Sommer et al., 2000; Frank et al., 2004; Lemus and Lal, 2005). Despite the fact that high belowground biomass input into the soil is not necessarily linked to increment of soil C concentration because of the so-called "priming effect" (i.e. increment of soil microbiological activity due to higher fresh organic matter supply (Kuzyakov, 2002). Monti et al. (2012) reported that converting cropland to switchgrass generally increase soil C stocks at a rate of 1 to 1.2 Mg ha-1 y-1. Usually the “priming effect” occurs in the vicinity of living roots because of the presence of exuded organic substances like mucilage and sloughing-off the root cap cells (Kuzyakov, 2002) that are easily degraded by soil microorganisms (Nguyen, 2003). This increase of microbiological activity may change the intensity of soil organic matter (SOM) decomposition (Paterson et al., 2003) that causes increment of soil CO2 flux (Kuzyakov, 2006) and
fast substitution of SOC (Kuzyakov, 2002). Soil respiration is one of the larger C flux in most ecosystems (Kuzyakov, 2006) and can account for 60-90% of total ecosystem respiration (Longdoz et al., 2000). Soil respiration negatively influences SOC deposition (Paustian et al., 2000) and small changes on soil CO2 flux using crop management (such as no- minimum tillage) or perennial crops
could have large impacts on global CO2 emissions (Paustian et al., 2000; Schlesinger and Andrews,
2000). In fact, belowground biomass and soil respiration are the two main factors that are involved in the SOC dynamics and that can influence the real potential to stock SOC (Schlesinger and Andrews, 2000).
Nitrogen fertilization can stimulate root development (Ma et al., 2001; Lemus and Lal, 2005) and plays an important role on cost, energy consumption, and environment management (McLaughlin and Kszos, 2005; Stehfest and Bouwman, 2006) and can cause leaching (Cambardella et al., 1999; Dinnes et al., 2002), NOx and N2O emissions (Lee et al., 1997; Bouwman et al., 2002a). Several
studies have been carried out to determine the appropriate nitrogen fertilization requirement of switchgrass (Ma et al., 2000b; Muir et al., 2001; Vogel et al., 2002; Lee et al., 2007; Sanderson, 2008). The annual nitrogen requirement of switchgrass was estimated between 70 to 100 kg ha-1 (McLaughlin and Walsh, 1998) but 50 kg ha-1 could be considered adequate (McLaughlin and Kszos, 2005). In this studies many different environmental conditions were taken in to account from southern to northern U.S.A. but information on Mediterranean areas are limited. Ashes that are generated by production of CHP by biomass can be considered as a way to recycle nutrients from elements such as Ca, K, and P (Demeyer et al., 2001; Perucci et al., 2006; Moilanen et al., 2012). Ashes can influence soil pH (Saarsalmi et al., 2012), microbial activity (Perkiomaki and Fritze, 2002; Perucci et al., 2008), field moisture capacity (Adriano and Weber, 2001) and soil salinity (Clapham and Zibilske, 1992). Studies concerning the influence of residues from combustion were mainly carried out in Northern Europe in forests (Moilanen et al., 2012), where the addition of ashes to peatlands reduces soil acidity and favours soil microbiological activity, which in turn increases of soil CO2 flux (Weber et al., 1985; Moilanen et al., 2002), while in alkaline soils, such
as Poggio Renatico, enzymatic activity and microbiological C-mass was reduced (Perucci et al., 2006).
The objective of this study (i) was to evaluate the interactive effects of ash amendments and nitrogen fertilization on the biomass production of above and belowground switchgrass in the Po valley (Italy), (ii) to determine the soil C content after land use change from cropland to switchgrass and (iii) estimation of Net Ecosystem Exchange (NEE).
Materials and Methods
Field setting
The experiment was carried out at Poggio Renatico, Ferrara, Italy (5 m a.s.l, 44°37’ N, 11°45’ E). According to the USDA classification the soil was loam (30% sand, 51% silt, 19% clay), pH (in H2O) was 8.0 and organic matter content of 1.57% (Walkley and Black, 1934). Typically, the area
is characterized by cold winters and hot summers, while the annual rainfall is about 646 mm (average of 30 years). The maximum daily temperature is 30.4 °C in July and in average daily temperature during the growing season (April-October) is 18.8°C.
Before switchgrass establishment the site was under annual crop rotation (wheat-maize-wheat-sugar beet). Seedbed preparation was: ploughing at 0.3 m soil depth, mechanical weeding, rotating-harrowing and vibrocultivating. Switchgrass (cv. Alamo) was sowed on May 8th, 2007 with an experimental sowing machine (Vignoli) at a rate of 6 kg ha-1 using pure live seeds (PLS). The row distance was set at 20 cm and seeds were sown 2-3 cm depth in the soil. Plots size were 151 m2 (16.0 x 9.5 m) replicated four times.
Fertilization rate
Nitrogen fertilization was applied at rates of 0, 50 and 100 kg of N ha-1 (N0, N1 and N2 respectively)
and were tested in combination with two ash levels (0 and 500 kg ha-1). The ash level was obtained by multiplying switchgrass ash content (5%) by the potential harvested biomass (10 Mg ha-1). Nitrogen fertilization was done by hand with Carbamide (CO(NH2)2) at the same time as ash
Aboveground and belowground biomass collection and determination
The aboveground biomass production was measured by weighing 7.5 m2 of biomass per plot cut at the end of the growing season. Sub samples (~200 g) were taken and dried at 105°C in order to calculate the dry matter content. Another sub-sample (~100 g) from each plot was taken and dried at 60°C for laboratory analysis.
Root biomass was determined by collecting one soil core per plot at the end of each growing season from 2008 until 2011. Root samples were taken within the row and midway between two adjacent plants at 0.2 m intervals to a depth of 1.2 m with an auger (74 mm Ø, 1.2 m height). Samples were temporarily stored at -18 °C before root separation. In order to separate roots from soil, samples were first kept in a solution of oxalic acid (2%) for 2 h, and then washed in a hydraulic sieving-centrifugation device. Once cleaned, roots were hand-recovered from the water using a 0.5 mm mesh sieve (Vamerali et al., 2003). Root dry matter (RDM; Mg ha-1) was determined by drying the root samples at 105°C for 24 h.
RDM was used to determine the shape of root apparatus through the asymptotic function proposed by Gerwitz and Page (1974) then modified by Gale and Grigal (1987) and corroborated by a number of studies (Stone and Kalisz, 1991; Jackson et al., 1996; Monti and Zatta, 2009):
d Y = 1−β
Where Y is the cumulative root fraction from the soil surface to depth d in centimetres (120 cm in this study); β is a dimensionless parameter describing the shape of the vertical root distribution within the considered soil layer. Briefly, higher β values correspond to a greater proportion of roots at depth, while lower β values imply a greater proportion of roots near the soil surface.
Soil moisture measurements
In the period March - September 2011 the soil moisture content over multiple depth intervals (0.1 m until 1.6 m depth) was monitored every month using a portable soil moisture probe (Diviner 2000; Sentek Sensor Tech., Stepney, Australia). Diviner 2000 utilises the frequency domain reflectometry (FDR) as sensor technology. To convert scaled frequency readings (SF) into volumetric water content (θv), the following equation was used which was specifically calibrated for this instrument
in a soil with 1.39 dry bulk density (Groves and Rose, 2004):
2621 0
3531
0
. vθ
.
SF
=
Access tubes for the diviner probe were installed in the centre of each plot. Tubes were placed into soil holes having 5 mm greater diameters than the PVC tubes. Along with the tubes a soil water mixture was inserted into the hole thus to improve the contact between pipe and soil.
Soil respiration measurements
Following full rhizome emergence one PVC collar (100 mm Ø, 50 mm height) per plot was placed in the interrow at about 5 cm deep in the soil. CO2 soil fluxes (Rs), i.e., the combined autotrophic
(Ra) and heterotrophic (Rh) ecosystem respiration, were measured at approximately monthly
intervals by an infrared gas analyzer (EGM-4; SRC1/EGM4, PP-System) equipped with a soil chamber and soil temperature probes. Flux data were collected between 10:00 and 13:00 h in each measuring day. Ra is CO2 flux derived by roots respiration, while Rh is CO2 flux derived by soil
microorganisms and soil microfauna (Kuzyakov, 2006).
The regression technique (Kucera and Kirkham, 1971) was used in order to separate Ra and Rh.
Briefly, it is assumed the linear relationship between root biomass and the amount of CO2 respired
corresponds to the intercept of the regression line between root biomass (independent variable) and total CO2 evolved from the soil (dependent variable).
Soil collection and determination of soil organic carbon (SOC)
To determine soil organic carbon (SOC) before switchgrass establishment (T0) soil cores were taken
randomly across the field at two depths (0-30 and 30-60 cm) in April 2007. Two and four years after crop establishment another set of soil cores were taken at the same depths as T0, but the first
layer was subdivided into three soil layers (0-5, 5-15, 15-30 cm). In both cases samples were taken at the end of March before rhizomes started re-growing. Soil and roots were separated by hand and then air dried until constant weight before milling. Soil organic carbon concentration (%) and stable carbon isotope ratio (13C/12C) was determined by an isotope ratio mass spectrometer (ANCA-MS system, ltd) in 120/150 mg soil samples. Before analysis the inorganic soil C was removed by acidification (Bundy and Bremen, 1972).
The soil bulk density was calculated on the sieved dried samples (Ellert et al., 2001) taken at two depths (0-20 and 20-40 cm) because it was assumed that bulk density does not change below 20 cm (Gifford and Roderick, 2003).
The spatial coordinates method (Zan et al., 2001) was used for carbon mass (Mc, Mg ha-1) per unit volume calculation that was obtained by multiplying soil bulk density (BD, Mg m-3), horizon thickness (T, m) and C concentration (Ccont, kg Mg-1) as given by Ellert et al. (2001):
Mc = BD * Ccont * T * 10000 m2 ha-1
The switchgrass contribution to soil carbon sequestration (F) was calculated using the following equation (Balesdent, 1987):
(
)
(
0)
0 δ δ δ δ − − = r n Fwhere δ0 and δn are soil organic C isotope abundance before planting of switchgrass and after n
years of cultivation, respectively; δr is the carbon isotope abundance of switchgrass roots.
Carbon budget – Net Ecosystem Echange (NEE)
There are number of papers in the last decades that give carbon balance budgets at the site to continental scales. Usually the net ecosystem exchange (NEE), or net ecosystem production (NEP), of CO2 is the difference between CO2 entering an ecosystem and all the CO2 leaving the ecosystem
during growing period (Smith et al., 2010). In order to obtain the carbon balance it is necessary to quantify the gross primary production (GPP). GPP represents the gross uptake of CO2 that is used in
photosynthesis (Ciais et al., 2010) and is the sum of net primary production (NPP), i.e. sum of above and below ground biomass, and autotrophic respiration (Ra):
GPP= NPP + Ra
However part of carbon was used by living roots to organic compounds like exudates, secretions and sloughed-off root cells and part for the roots turnover, that were used by soil microorganisms that contributes to Rh. As well as crop residues any old roots are subjected to decomposition by
microorganisms during growing seasons. Thus in cropland Net Ecosystem Exchange (NEE) is given by:
NEE= GPP - Rs
Statistical analysis
A completely randomized block design with four replicates was adopted with plots of 151 m2 (16.0 x 9.5 m). Root data from the four replicates were analyzed by repeated measures analyses of variance, using depth as the repeated factor. Statistical analyses were performed using CoStat
v6.204 (Monteray, USA). Following significant ANOVA results, means were separated using Tukey’s LSD test at (P ≤ 0.05). The statistical significance of the regression coefficients was tested by analyzing the variance of the regression (ANOVA) through splitting the sum of square into regression and residual components (F-statistic for P ≤ 0.05).
Results
Climatic conditions
The average precipitation changed significantly during the five experimental growing seasons (from March to September). Compared to the long-term average (376 mm), precipitation was 37% and 42 % lower in 2007 and 2011, respectively. In 2008 and 2010 precipitation was 23% and 49% higher than the long-term average. Even though the 2008 and 2010 growing seasons were rainy, there was no significant decrease in ambient temperatures compared to long-term average, but were lower compared to 2009 and 2011 (Table 2.2). Average soil temperatures increased from 2008 to 2011, reaching a maximum of 23.8°C in the last experimental year.
Above and belowground biomass
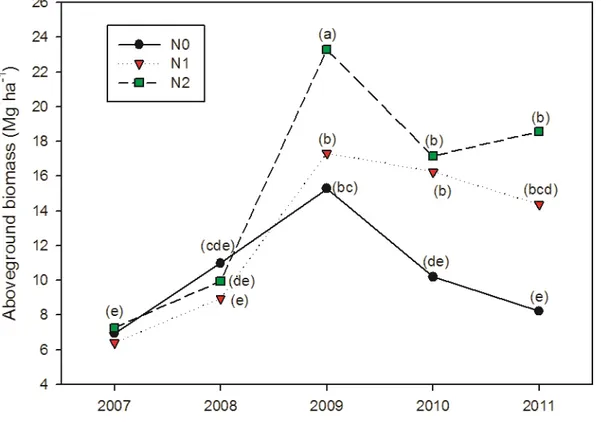
Addition of ash did not influenced aboveground biomass and no interaction was found between ash and nitrogen fertilization. Figure 2.1 shows the effects of different nitrogen fertilization levels on the aboveground dry biomass (ADB) production of switchgrass in a five-year-old stand. In all treatments ADB increased continuously from 2007 until 2009. Significant differences between N2
(23.3 Mg ha-1) and N1 and N0 (17.3 and 15.3 Mg ha-1, respectively) were found only in 2009. It is
also important to note that maximum productivity was reached in 2009 (Fig. 2.1). Afterwards, ADB decreased significantly; in 2010 ADB was 46.2% and 20.2% lower in N0 and N2 than in 2009. In N0
and N1 small decrements in yield were detected in 2011 as compared to 2010, while yields in N2
remained stable.
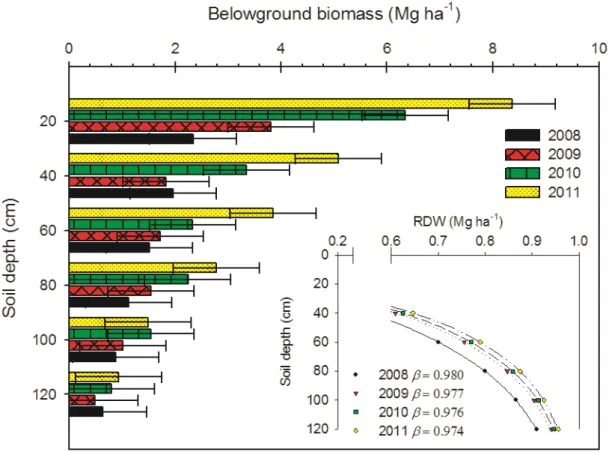
Root dry matter (RDM) increased from 8.5 Mg ha-1 in 2008 up to 22.5 Mg ha-1 in 2011. No significant differences, however, were found both among nitrogen fertilization and ash treatments. Instead interaction was found between depths and years (Fig. 2.2) since RDM increase significantly from 2008 till 2011 in the top layers (0-60 cm), while no significant differences were found in deeper layers.
The model proposed by Gale and Grigal (1987) was used to describe the vertical root distribution. Higher β value, i.e. indicating that more roots are concentrated in deeper layers, was obtained in 2008 (β= 0.980) when 50% of RDW was concentrated in the upper 40 cm soil depth (Fig. 2.2). In the following years the proportion of RDW in upper layer slowly increase, reaching a maximum of 60% in 2011 (β= 0.974). Anyway belowground biomass increased from 2.1 to 4.5 Mg ha-1 in 40-120 cm soil profile.
Soil C and N content
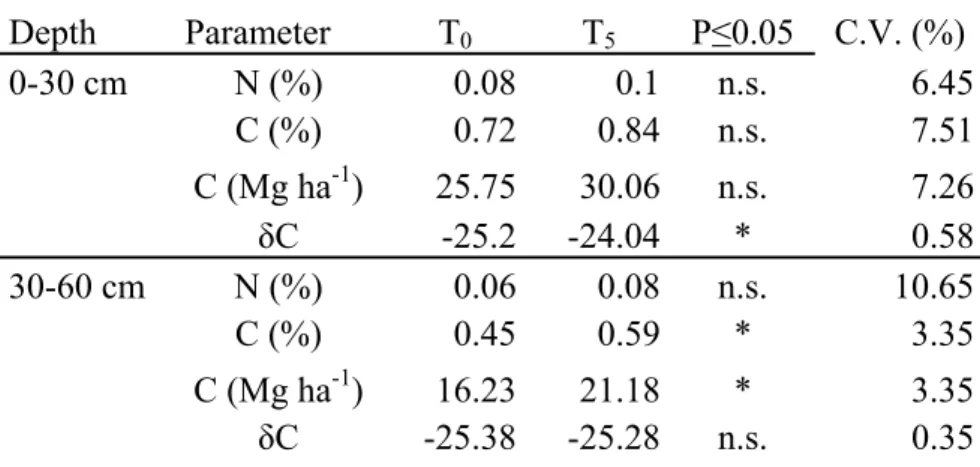
Table 2.3 shows that after 5 years of switchgrass cultivation (T5) the soil C content (%) increased
significantly (+23.4%) in deep layers (30-60 cm deep), while in the upper layers only a small increase was detected (+14.3%). Soil organic carbon (SOC) increased with time from 25.7 in T0 to
30.0 Mg ha-1 in upper layers (0-30 cm deep); but the differences were not significant. On the other hand in deeper layers SOC increased significantly from 16.2 in T0 to 21.2 Mg ha-1 in T5. As for the
C isotope ratio, it changed significantly only in the upper layers; 9.8% of such change was derived from the switchgrass implantation. Small increments of N content (%) were detected in both layers, but the differences between T0 and T5 were not significant.
Because there was no significant differences between nitrogen fertilization and ash addition, as well as no interactions among them were found, only the differences between soil depths were analyzed.
Table 2.4 shows the soil carbon and nitrogen concentration, and switchgrass carbon derived at a three depths (0-5; 5-15 and 15-30 cm deep) after 5 growing seasons (T5). It was found that at 0-5
cm deep the C (+18.9% in average) and N (+12.0% in average) concentrations were higher than in the other two depths. The switchgrass C derived was also higher in the upper layer (23.9%) than in the other two deeper layers (2.8% in average).
Soil CO2 flux
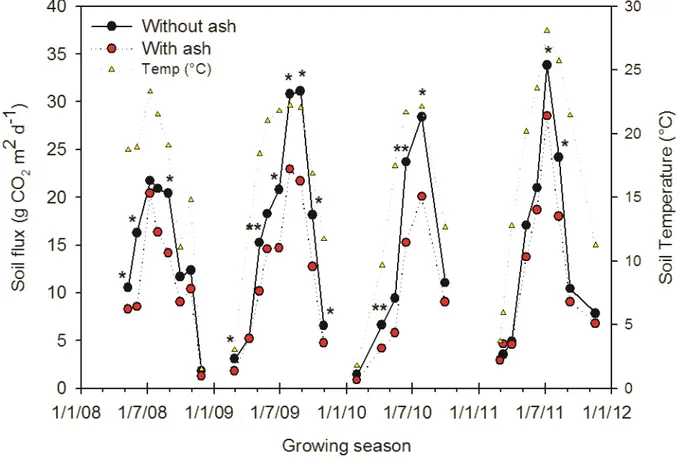
The seasonal pattern of soil CO2 flux was similar in all years and it followed that of soil temperature
(Fig. 2.3). Fluxes increased rapidly from April to the end of July/August where a peak reached, this was coincident with the highest soil temperatures. The highest peak was reached in 2011 at the end of July (31.2 g m2 d-1) when soil temperature was 28.1°C, while in July 2008 was detected the lowest value (20.9 g m2 d-1) when soil temperature was 21.5°C. After the summer peaks, the soil CO2 fluxes decreased rapidly up to October. From November to March, when usually the
temperatures were below zero and there is snow, the fluxes were not detectable. The addition of ash to the soil significantly reduced soil CO2 fluxes during the different summer periods examined. The
reductions were 30%, 29%, and 16% in 2009, 2010, and 2011, respectively.
The relationship between soil CO2 fluxes and root biomass is presented in Figure 2.4. It was found
that the soil CO2 fluxes were positively and significantly correlated with belowground biomass in
2008, 2009 and 2010 only. Applying regression analysis technique to plots fertilized with and without ash it was found that the heterotrophic respiration (Rh) was 61 and 63% respectively (Fig.
2.4). The best fit was obtained without ash (r = 0.72) compared to that with ash (r = 0.63).
Carbon budget – Net Ecosystem Exchange (NEE)
From 2008 to 2010 the gross primary production (GPP) increased faster in plots without ash addition (from 13.2 to 22.0 Mg C ha-1) than in plots treated with ash (from 12.0 to 21.3 Mg C ha-1).
The Net Ecosystem Exchange (NEE) also increased with time (Fig. 2.5), but it was significantly higher in the ash treated plots than in the plots without ash. The difference between ash and without ash treatments was higher during the first three years of growth (on average +13.5%), while this difference disappeared during the last experimental season (on average 12.8 Mg ha-1 y-1). After five years of switchgrass cultivation the NEE was 40 and 36 Mg C ha-1 for plot treated with and without
ashes.
Discussion
Above and belowground production
Switchgrass is considered one of the main biomass crops that maintain high production levels at different environmental conditions (Lemus et al., 2002; Sanderson, 2008; Follett et al., 2012; Monti et al., 2012). Numerous studies have been carried out on its response to nitrogen fertilization (Ma et al., 2000b; Muir et al., 2001; Lee et al., 2007) and on its ability to import C to the soil (Ma et al., 2000a; Zan et al., 2001; Liebig et al., 2008). As well, switchgrass is considered a “low input” perennial grass (McLaughlin and Kszos, 2005). This is especially true after establishment, as the crop does not need high fertilization inputs and tillage practices (Monti et al., 2012). At the second year of the experiment switchgrass reached a biomass production of 10 Mg ha-1 without significant differences among nitrogen treatments and ash addition, indicating that no fertilization or low fertilization rates (such as N1) could be enough for the successful stand establishment. These results
confirm the findings of previous studies where it was assumed that the nitrogen has been added via atmospheric deposition and soil N-mineralization (Dohleman et al., 2012). The peak of productivity was achieved in the fourth year using 100 kg ha-1 of N (N2 = 23.3 Mg ha-1; Fig. 2.1). This
exceptional production is probably due to the combination of nitrogen fertilization, optimal temperatures, and well distributed rainfall that permitted the nitrogen uptake (NO -N) during the
more important growing stages (Vogel et al., 2002; Guretzky et al., 2010). As well, in 2011 switchgrass confirmed its resistance to water stress conditions (Barney et al., 2009; Monti et al., 2012) because it showed excellent yields with modest rainfall (- 40% less than average of last 30 years) if supported by good nitrogen fertilizers (8.2, 14.4 and 18.6 Mg ha-1 for N0, N1 and N2
respectively). Its capacity to resist water stress is related to its rapid belowground biomass development allowing switchgrass to exploit deep water reserves (Ma et al., 2000b; Monti and Zatta, 2009). As a shown in figure 2.6 the crop was able to take up water down to 1.6 m depth throughout the growing season in a critical year like 2011.
In contrast to the aboveground biomass, the nitrogen fertilization treatments did not affect the root system development (Fig. 2.2). These results are in agreement with those of Ma et al. (2000b) but in contrast with those of Heggenstaller et al. (2009). The reason for the different results could be explained by interaction among soil nutrients availability (Ma et al., 2000b), genotypes (Sanderson, 2008) and crop management (Ma et al., 2001). The analysis of the root system by β value parameter (Fig. 2.2), obtained from the model proposed by Gale and Grigal (1987) that describes the development in depth of the root system, it was found that the increment of belowground biomass (from 2008 to 2011) was concentrated mainly in shallow layers (in the first 40 cm). In fact, it was detected a relative and progressive decreases of the β value, indicating that the bulk of the roots was concentrated in surface layers. Anyway, belowground biomass increased from 2.1 (T0) to 4.5 (T5)
Mg ha-1 in 40-120 cm soil profile (+71%), confirming the crop’s potential to stock carbon in deep soil layers (Ma et al., 2000a; Liebig et al., 2005; Liebig et al., 2008; Monti and Zatta, 2009). However, ashes, which can be considered a way to recycle nutrients from elements such as Ca, K, and P (Perucci et al., 2006; Moilanen et al., 2012), can influence soil chemical components such as pH (Silfverberg and Huikari, 1989), field capacity (Chang et al., 1977) and soil salinity (Clapham
and Zibilske, 1992) but did not have an effect on productivity both in above and belowground biomass.
Soil C and N content
Switchgrass potential to input carbon to the soil has been demonstrated by several authors (Zan et al., 2001; Frank et al., 2004; Sanderson, 2008). In the present study we also found that after five years of switchgrass cultivation SOC increased. The soil carbon concentration increased along the whole profile analyzed but this was only significant in the deep soil layers. In a recent review of switchgrass it was reported that SOC can increase between 1 and 1.2 Mg ha-1 y-1 when converting a cropland into a switchgrass plantation (Monti et al., 2012). In the present study somewhat higher values were found. After five years of growth the SOC stored was 9.3 Mg ha-1 meaning an average of 1.9 Mg ha-1 y-1. The low initial SOC, as a consequence of intensive crop cultivation in the preceding decades (Lal and Kimble, 1997), may be the reason for relatively high and fast accumulation of stored SOC under switchgrass (Powlson et al., 2011). After 5 years of switchgrass the SOC increment was 14.3% and 23.4% in the 0-30 cm and 30-60 cm layers, respectively. The lower increment in SOC in the top layers could be related to several factors. For example, the upper layers are more susceptible to mineralization processes because of exposure to seasonal fluctuations in precipitation, soil temperature, and microbial activity (Gupta and Rao, 1994; Lemus and Lal, 2005). The "priming effect", which indicates that a large root biomass can trigger faster metabolic processes by soil microorganisms thus accelerating soil organic matter decomposition and C turnover (Kuzyakov, 2002, 2006), probably played an important role in the carbon dynamics in upper layers. In fact, despite the general increase on SOC, there was a strong relation (R2=0.93) between root biomass and C concentration (Fig. 2.7), suggesting an increase of microbial activity in the presence of a greater amount of root biomass (Kuzyakov, 2002; Kuzyakov and Larionova,
2005). In the vicinity of roots there are large quantities of exuded organic substances that are utilized in short time by microorganisms that forced intensive C turnover (Kuzyakov, 2002; Nguyen, 2003; Kuzyakov, 2006).This hypothesis, was also demonstrated in Miscanthus (Zatta et al., 2013), and further corroborated by the 'high C-derived from the top 5 cm of soil (table 2.4) where quantity of more active fine-roots is high (Gregory, 2006). The C-derived in the deep layers did not change significantly, because this carbon is more strongly stabilized than in top-layers (Grigal and Berguson, 1998; Powlson et al., 2011). Even though some authors indicated that nitrogen fertilization can increase SOC in the soil because of the enhanced root biomass production (Powlson et al., 2011), we did not find any correlation of such type, as well as no increments on soil N concentration were found, probably because of the capacity of switchgrass to use soil nutrient resources after SOM mineralization.
Soil CO2 flux
Soil temperature is the main factor influencing soil CO2 flux (Lou et al., 2004), and in switchgrass
the correlation between the two factors was observed by some authors (Frank, 2002; Lee et al., 2007). Our results also show the close relationship throughout the growing seasons between CO2
flux and soil temperature, in fact peaks of CO2 fluxes were recorded during the summer (end of
July; Fig. 2.3), when plants were on full flowering stage and soil temperature is higher. In the present study the addition of ash to the soil caused a soil CO2 flux decrease during the warmer
months in all of the growing seasons evaluated. This result is in contrast with studies carried out on peatlands in northern Europe in which it was found an increase in soil respiration after the ash addition (Moilanen et al., 2012). This phenomenon has been justified as the addition of ashes reduce soil acidity and in turn increase soil microbiological activity (Weber et al., 1985; Moilanen et al., 2012). On the other hand in alkaline soils, which are typical of Mediterranean areas, the
addition of ashes caused the reduction in microbial biomass-C and enzyme activity (Perucci et al., 2006; Perucci et al., 2008). In the present study, soil are sub-alkaline (pH = 8) and consequently the reduction in soil CO2 flux could be attributed to a reduction in microbiological activity. This
hypothesis could be partly confirmed by Figure 2.7, where the correlation between soil C concentration and root biomass disappear in presence of ash (R2 = 0.13) while in plots without ash
amendments the correlation is highly significant (R2 = 0.93). So it could be argued that the priming effect in alkaline is reduced through the inhibitory effect that ashes have on microbial activity.
The contribution of autotrophic respiration (Ra) to soil fluxes (Rs), has been reported to vary from
10% to as much as 90% for both forest and non-forest ecosystems (Hanson et al., 2000; Xu et al., 2001). Part of this variability may be due to differences in ecosystems, species, or developmental stages (Hanson et al., 2000; Bond-Lamberty et al., 2004). In the present study the regression technique was used, among the several available, in order to separate autotrophic (Ra) and
heterotrophic (Rh) ecosystem respiration (Kucera and Kirkham, 1971) and it was found that
heterotrophic respiration (Rh) was 61 and 63% for plots with and without ash respectively (Fig. 2.4).
Our results, that are in agreement with those reported on grassland by other authors (Kucera and Kirkham, 1971; Brook et al., 1983; Hanson et al., 2000), indicate that Rh are the main components
of soil respiration and that ashes reduced both components of soil respiration. The absence of correlation between soil CO2 flux and belowground biomass in the last year is probably due by
large, older roots, which respire and exude much less C than fine, young roots (Kuzyakov, 2006).
Carbon budget – Net Ecosystem Exchange (NEE)
Factors to be taken into account for NEE calculation are aboveground, belowground biomass, and soil respiration which must be divided into autotrophic (Ra) and heterotrophic respiration (Rh)
uncertain (Lauenroth et al., 2006). Despite that some studies indicated that switchgrass C savings can vary from 7.6 to 15 Mg ha-1 y-1 (Frank et al., 2004; Lee et al., 2007; Liebig et al., 2008). In the present study it was estimated that during the first three years switchgrass NEE was 7.8 and 9.0 Mg ha-1 y-1 in plots with and without ash, respectively, while in 2011 these differences disappeared. The different results could be related to the different soil CO2 fluxes caused by the addition of ash as
indicated before. Moreover, soil respiration negatively affects soil C sequestration (Paustian et al., 2000) and is responsible for 10% of CO2 emissions into the atmosphere (Lee et al., 2007) so its
reduction can have considerable impacts on global emissions (Schlesinger and Andrews, 2000). Therefore, the addition of ashes to alkaline soils, as in the present case could have significant effects on reduction of CO2 emissions. It was calculated that the addition of ashes could allow 3.6 Mg C
ha-1 saving after 5 years of switchgrass cultivation. Then the total NEE in plots with ash, adding the computed increment in SOC, was 49.3 Mg ha-1 in contrast to the 45.3 Mg ha-1 produced in plots without ashes.
Conclusion
No N fertilization is needed during the first two years after sowing because of utilization of residual soil fertility by switchgrass. Belowground biomass increased from 8.5 to 22.5 Mg ha-1 and developed in depth allowing large quantities of carbon to be stocked in the soil after 5 years (9.3 Mg ha-1), especially in the deep layers, while in upper layer carbon stock was limited because of the priming effect. Ashes, the residues after combustion of biomass, can be used as soil nutrient amendments because it was found that ashes did not have any impact either on above and belowground biomass. Instead, ashes had inhibitory effect on soil respiration, which permit to save 4 Mg ha-1 of C after 5 years of growing switchgrass.
TABLES
Table 2.1. Chemical characteristics of ash used for fertilization
Element concentration unit Phosphorus (P) 7,00 mg/kg Potassium (K) 1120,00 mg/kg Arsenic <0,10 mg/kg Cadmium (Cd) <0,10 mg/kg Chromium (Cr) <0,10 mg/kg Copper (Cu) <0,10 mg/kg Mercury (Hg) <0,10 mg/kg Manganese (Mn) <0,10 mg/kg Nickel (Ni) <0,10 mg/kg Lead (Pb) <0,10 mg/kg Sodium (Na) 97,72 mg/kg Aluminum (Al) 0,00 mg/kg Calcium (Ca) 10,00 mg/kg Iron (Fe) 0,00 mg/kg Magnesium (Mg) 1,00 mg/kg Silicon (Si) 158,00 mg/kg Titanium (Ti) 0,00 mg/kg Carbon (C) 14,01 % Sulfur (S) 0,02 % Chlorine (Cl) 0,30 %
Table 2.2. Total precipitation, mean air temperature and soil temperature during growing season (March-September) and in long-term average (1961-1990)
Year Precipitation (mm) Air Temp (°C) Soil Temp (°C)
2007 238 18.8
2008 461 18.2 18.8
2009 335 19.3 20.8
2010 560 18.0 20.4
2011 216 19.4 23.8
Table 2.3. Soil carbon (C) and nitrogen (N) content (%) on two depths before switchgrass cultivation (T0) after 5 years (T5). (n.s. = not significant , *and **, statistically significant
differences for P≤0.05 and P≤0.01 respectively, with Tukey’s test).
Depth Parameter T0 T5 P≤0.05 C.V. (%) 0-30 cm N (%) 0.08 0.1 n.s. 6.45 C (%) 0.72 0.84 n.s. 7.51 C (Mg ha-1) 25.75 30.06 n.s. 7.26 δC -25.2 -24.04 * 0.58 30-60 cm N (%) 0.06 0.08 n.s. 10.65 C (%) 0.45 0.59 * 3.35 C (Mg ha-1) 16.23 21.18 * 3.35 δC -25.38 -25.28 n.s. 0.35
Table 2.4. Soil carbon (C%) and nitrogen (N%) concentration, and switchgrass carbon derived at a three depths after 5 years. Different letters show statistically different means (Tukey’s LSD test, P≤0.05).
Soil depth C (%) N (%) Switchgrass C-derived (%) 0-5 0.963 a 0.108 a 23.9 a 5-15 0.784 b 0.098 b 3.4 b 15-30 0.779 b 0.093 b 2.1 b
FIGURE EXPERIMENT 1
Fig. 2.1. Aboveground biomass (Mg ha-1) of switchgrass at three nitrogen fertilization levels (0, 50 and 100 kg ha-1 of N, namely N0, N1 and N2 respectively) from 2008 to 2011. Different letters
Fig. 2.2. Belowground biomass (Mg ha-1) of switchgrass at six soil depths (0-20; 20-40; 40-60; 60-80; 80-100; 100-120 cm), at the end of growing season at four years (from 2008 to 2011). Bars indicate the least significant difference (Tukey’s LSDP≤0.05=0.81). The inset graph shows
belowground biomass over soil depth following the β model proposed by (Gale and Grigal, 1987) that describe the shape of the cumulative root distribution over depth.
Fig. 2.3. Soil flux (g CO2 m2 d-1) and temperature (°C) over growing season from 2008 to 2011 (*
Fig. 2.4. Relationship between Soil flux (g CO2 m2 d-1) and belowground biomass (mg cm-3).
Symbols "+" indicate if ash was applied to the soil, while symbol "-" indicate that ash was not applied. (** and ***, statistically significant differences for P≤0.01 and P≤0.001 respectively with Pearson’s test).
Fig. 2.5. Gross Primary Production (GPP) and Net Ecosystem Exchange (NEE) in term of net carbon saved (Mg ha-1) from 2008 to 2011. Symbols "+" indicate if ash was applied to the soil, while symbol "-" indicate that ash was not applied.
Fig. 2.7. Soil carbon concentration (%) in relation to belowground biomass (Mg ha-1). Symbols "+" indicate if ash was applied to the soil, while symbol "-" indicate that ash was not applied. (n.s. = not significant, *** statistically significant differences for P≤0.001, with Pearson’s test).