Large-scale mitogenomic analysis
of the phylogeography of the Late
pleistocene cave bear
Joscha Gretzinger
1,2, Martyna Molak
3, Ella Reiter
1, Saskia pfrengle
1, Christian Urban
1,4,
Judith Neukamm
1,4, Michel Blant
5, Nicholas J. Conard
6,7, Christophe Cupillard
8,
Vesna Dimitrijević
9, Dorothée G. Drucker
8, Emilia Hofman-Kamińska
10, Rafał Kowalczyk
10,
Maciej T. Krajcarz
11, Magdalena Krajcarz
12, Susanne C. Münzel
1, Marco peresani
13,
Matteo Romandini
13,14, Isaac Rufí
15, Joaquim soler
15, Gabriele terlato
13, Johannes Krause
1,2,7,
Hervé Bocherens
7,16& Verena J. schuenemann
1,4,7the cave bear (Ursus spelaeus) is one of the Late pleistocene megafauna species that faced extinction at the end of the last ice age. Although it is represented by one of the largest fossil records in Europe and has been subject to several interdisciplinary studies including palaeogenetic research, its fate remains highly controversial. Here, we used a combination of hybridisation capture and next generation sequencing to reconstruct 59 new complete cave bear mitochondrial genomes (mtDNA) from 14 sites in Western, Central and Eastern Europe. In a Bayesian phylogenetic analysis, we compared them to 64 published cave bear mtDNA sequences to reconstruct the population dynamics and phylogeography during the Late Pleistocene. We found five major mitochondrial DNA lineages resulting in a noticeably more complex biogeography of the European lineages during the last 50,000 years than previously assumed. Furthermore, our calculated effective female population sizes suggest a drastic cave bear population decline starting around 40,000 years ago at the onset of the Aurignacian, coinciding with the spread of anatomically modern humans in Europe. Thus, our study supports a potential significant human role in the general extinction and local extirpation of the european cave bear and illuminates the fate of this megafauna species.
Today in the Holocene epoch, the northern hemisphere is zoologically impoverished in large terrestrial spe-cies1,2. Astonishingly, this is a relatively recent phenomenon. During the Late Pleistocene, until around 50,000 years ago, the continents were still populated with spectacular fauna consisting of some of the largest mammals that ever roamed the earth2. More than 150 genera of megafauna such as mammoths, woolly rhinoceros, and sabre-toothed cats inhabited the steppes of Eurasia and North America1,2. However, by 11,000 years ago, these ecosystems had lost between around 36% and 72% of their large-bodied (>45 kg) mammalian genera, respec-tively3, and at least 97 genera in total1. This extinction wave affecting the largest members of the herbivorous guild
1institute for Archaeological Sciences, University of tübingen, tübingen, Germany. 2Max Planck institute for the Science of Human History, Jena, Germany. 3Museum and institute of Zoology, Polish Academy of Sciences, Warsaw, Poland. 4Institute of Evolutionary Medicine, University of Zurich, Zurich, Switzerland. 5Swiss institute for speleology and karst studies (SISKA), La Chaux-de-Fonds, Switzerland. 6Ancient prehistory and quaternary ecology, University of tübingen, tübingen, Germany. 7Senckenberg Centre for Human Evolution and Palaeoenvironment (S-HEP), University of tübingen, tübingen, Germany. 8Service Régional de l’Archéologie de Bourgogne-Franche-Comté and Laboratoire Chronoenvironemment, CNRS, UMR, 6249, Besançon, France. 9Laboratory for Bioarchaeology, Department of Archaeology, University of Belgrade, Belgrade, Serbia. 10Mammal Research institute, Polish Academy of Sciences, Białowieża, Poland. 11institute of Geological Sciences, Polish Academy of Sciences, Warsaw, Poland. 12Institute of Archaeology, Nicolaus Copernicus University in Toruń, Toruń, Poland. 13Department of humanities, Section of Prehistoric and Anthropological Sciences, University of ferrara, ferrara, italy. 14Department of cultural Heritage, University of Bologna, Ravenna, italy. 15institute of historical research, University of Girona, Girona, Spain. 16Department of Geosciences, University of tübingen, tübingen, Germany. correspondence and requests for materials should be addressed to H.B. (email: [email protected]) or V.J.S. (email: verena. [email protected])
Received: 11 January 2019 Accepted: 10 July 2019 Published: xx xx xxxx
had cascading consequences on terrestrial ecosystems with consequences still to be seen in modern ecosystems4–6. Understandably, the potential causes of these incisive extinctions have remained subject to highly controversial debates. The discussed explanations include an anthropogenic contribution, climate and environmental changes or a combination of both2,3. However, with a growing body of data, the patterns and processes of these extinctions appear more complex. According to Lorenzen and colleagues3, for example, while the proportion of dwindling megafauna species was greatest on continents that underwent the most dramatic climatic and environmental changes, the extinction events in North America and Australia rather coincided with the arrival of anatomically modern humans1,3. The circumstances are apparently in contradiction with cross-taxa response to global cli-matic or anthropogenic factors, indicating a species-specific response to one or both factors. Nevertheless, recent publications promote rapid climatic shifts and oscillations, especially the Dansgaard-Oeschger warming events, as the main cause of megafauna extinctions, suggesting only a synergistic role of humans in these processes7,8; although this hypothesis does not receive unanimous approbation9. Furthermore, it was previously argued by Lorenzen and colleagues3 that the population development of different taxa is contingent on the geographic as well as temporal scale and the methodological approaches applied3. For instance, while the woolly mammoth and cave lion experienced sudden losses of genetic diversity and subsequent population stability long before their final extinction3,10, it was shown that genetic diversity in bison and musk ox declined gradually through the course of the Late Pleistocene3. The latter pattern of withering away was also assumed for the Pleistocene cave bear Ursus
spelaeus sensu lato11. As this Late Quaternary mammal is represented by a largest fossil record in Europe12, the cave bear is a useful model to study the causes of the extinction of a species, especially in the context of popula-tion dynamics, climate instability and changing human impact. Descending from the Middle Pleistocene Ursus
deningeri13, as indicated by morphological and molecular studies14, the Late Pleistocene cave bear established a vast distribution extending eastwards from Northwest Spain across Central Europe and the Urals to Arctic North-Eastern Siberia and the Altai Mountains15,16. Due to their high intra-specific morphological variability observed across the Eurasian cave sites, several taxonomic groups have been previously proposed mostly on the basis of morphological and metrical studies of the teeth, metapodials and the cranium17–19. These primarily differ-entiate Eurasian large-bodied cave bears from small-bodied cave bears endemic to high-altitude areas of the Alps, the Caucasus and the Altai mountains17–19. If these suggested morphological groupings indeed represent valid and distinct phylogenetical groups on species or subspecies level remains controversial20, especially since recent analyses indicate a more complex evolutionary relationship21. However, despite its substantial diversity and dis-tribution, the cave bear became extinct at the beginning of the Last Glacial Maximum (LGM)12,22–24. The timing of its final extinction as well as the cause of the extinction, with climate change in the context of its herbivorous diet25–28 or human hunting impact29 commonly regarded as potential factors12, remain the subject of controversial debates. While comprehensive radiocarbon dating indicates that the extinction took place at the onset of the LGM around 28–26 ka years before present12,22–24, a small number of fossils younger than 26,000 calibrated years BP23,24 documents the survival of fragmented populations during the maximum extent of the ice sheets30,31. In fact, Stiller and colleagues11 demonstrated based on population size reconstruction that 25,000 years of genetic decline preceded not only the cave bear extinction, but also the onset of the LGM. Since this circumstance eliminates a correlation between cave bear population decline and substantial climate change, human impact, either due to direct hunting or resource competition32–38 emerges as the major extinction cause, albeit, archaeological evidence remains sparse for now24,36–38. In this context, molecular analysis of ancient DNA (aDNA) from cave bear fossils has provided substantial insights into cave bear evolution and extinction, since it allows us to identify even subtle demographic developments invisible in the palaeontological record39. However, previous ancient DNA studies were based on relatively small sample sizes40 or focused on geographically limited areas41. The majority of these studies was restricted to the mitochondrial D-loop sequence42, a 285 base pair short fragment comprising only ~1.7% of the whole bear mitogenome. As demonstrated by previous studies43,44, inferred genealogical recon-structions based on the D-loop region tend to contradict inferences based on the entire mitogenome. Thus, the current knowledge regarding cave bear population dynamics and phylogeography during the Late Pleistocene is substantially constrained. To overcome these limitations, here we analysed 59 new complete mitochondrial DNA sequences, representing populations from a Europe-wide time transect. Moreover, we present the first mitochon-drial genome of a specimen morphologically classified as Ursus spelaeus ladinicus as well as the youngest cave bear mtDNA sequences thus far, which dates to 19,656 14C years before present (23,907–23,461 cal. yr. BP). Our data
can help to illuminate the fate of the European cave bear before its final extinction.
Results
Sample collection and processing.
For ancient mtDNA extraction, 81 bone specimens morphologically identified as cave bears were selected from Bärenloch (Switzerland), Perspektywiczna cave (Poland), Casamène and Prélétang (France), l’Arbreda (Spain), Hohle Fels (Germany), Broion, Paina and Trene (Italy) as well as Vrelska, Kovačevića, Vasiljska, Smolućka, and Mirilovska cave (Serbia), covering temporally spaced sites from the Iberian Peninsula to the Balkans in a time range from >49 to 23 cal. ka before present (Fig. 1, Table 1). A short description of each site can be found in Supplementary Section 1. We then used double-stranded Illumina sequencing libraries in combination with in-solution bait-capture and high-throughput sequencing to generate mitochondrial sequences for 59 of the 81 specimens. For 19 samples, it was not possible to recover sufficient amounts of aDNA to reliably infer the taxonomic position, while three individuals were subsequently identified as Ursus arctos during the phylogenetic analysis. The obtained mitochondrial genomes feature a coverage between 4.5 and 752.46-fold with 72%–100% of the mitochondrial genome covered (Table 1). All mitochondrial genomes exhibited C to T damage patterns indicative of authentic aDNA. The number of samples for each site produc-ing mitochondrial genomes is as follows: Bärenloch (n = 7), Perspektywiczna Cave (n = 7); Casamène (n = 8), Prélétang (n = 5), l’Arbreda (n = 2), Hohle Fels (n = 1), Broion (n = 3), Paina (n = 5), Trene (n = 4), Vrelska cave (n = 7), Kovačevića cave (n = 7), Vasiljska cave (n = 1), Smolućka cave (n = 1), and Mirilovska cave (n = 1).Subsequently, we compared these sequences with 64 previously published complete mitochondrial genomes, resulting in an alignment of in total 123 specimens. On this final alignment, we performed Bayesian phylogenetic analysis as well as calculation of the effective female population size through time.
Phylogenetic analysis.
Our Bayesian phylogenetic analyses detected five major European lineages, sharing a most recent common ancestor (MRCA) ~451 ka BP (~314–623 ka BP 95% CI) (Fig. 2). These lineages are con-sistent with the major mtDNA control region haplogroups previously taxonomically designated as Ursus ingressus and Ursus spelaeus (including U. s. eremus, U. s. ladinicus and U. s. spelaeus). U. s. eremus appears to be distinct from both U. s. spelaeus and U. s. ladinicus. Samples from Prélétang, Casamène, and Grotte d’Ours assigned to the U. s. ladinicus control region haplogroup (Figure S1, Figure S2) form a paraphyly excluding U. s. spelaeus. Furthermore, we detected a noticeable subdivision of the U. ingressus clade that does not correspond to any previous classification based on morphological features. For the purpose of describing these novel groups, since there is no association with certain morphological or genetical designations, we divided the three lineages by their approximate distribution into a Western, Central and South-Eastern European group. These three groups shared a most recent common ancestor (MRCA) ~211 ka BP (~154–273 ka BP 95% CI), preceding the initial divergence of the U. spelaeus complex by roughly 73 ka (138 ka BP; 115–167 ka BP 95% CI). The most basal of these groups contains only five samples from two Western European sites, namely Casamène in France and Zoolithen cave in Germany, while the Central European and South-Eastern European group are well represented, comprising 33 samples from thirteen sites assigned to the Central European group and 23 samples from eight sites assigned to the South-Eastern European group. However, the position of the most divergent clade within the Central European Group, comprising five samples (TU860, TU865, TU868, PA1 and SP1844), is not clearly dissolved. Alternatively, it may be located ancestral to both the Central as well as the South-Eastern European group.Population size analysis.
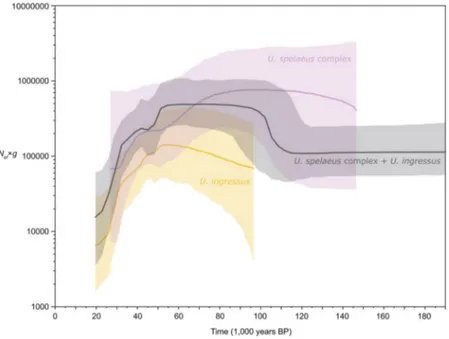
We calculated the changes in the effective female population sizes (Nef) of European cave bears during the Middle and Late Pleistocene and visualized them in Bayesian skyline plots (Fig. 3). In general, our population size reconstruction resembles previously published calculations, featuring a stable population size through the last 200 to 50 ka. This is intriguing, since this period of time encompasses two cold periods (MIS 6 and MIS 4), as well as two warmer periods (MIS 5 and the onset of MIS 3). However, our extended plot illustrates that the known initial reduction in population size starting about 50 ka BP is followed by a more drastic decline beginning 10 ka later and persisting until the ultimate extinction of the cave bear in Europe approximately 19 14C ka BP (23 cal. ka BP) (Fig. 3).Discussion
Phylogeography and population dynamics.
Until now, the population dynamics of the European cave bear was mainly described by the westward migration of U. ingressus from South-Eastern Europe to the Eastern Alps starting 60 ka BP45. This event may be associated with a gradual increase in U. ingressus Nef, starting at the same time as the initial population decline of the U. spelaeus complex (Fig. 3). Subsequently, U. ingressus Figure 1. Geographical distribution of analysed samples. Circle size and number of wedges correspond to sample size, respective colours correspond to samples of a specific haplogroup: violet, Ursus spelaeus spelaeus; blue, Ursus spelaeus eremus; yellow, Ursus ingressus West European; light orange, Ursus ingressus Central European; dark orange, Ursus ingressus South-Eastern European.
ID Site Mean Cov. 3X Cov. in % Classification 14C Cal. 14C (1-sigma)
TU1 Bärenloch, CH 142.4 98.98 eremus 28,415 ± 60576,77 33,033–31,602
TU2 Bärenloch, CH 275.6 99.3 eremus NA
TU3 Bärenloch, CH 245.7 99.27 eremus >40,00076,77
TU5 Bärenloch, CH 19.7 92.21 eremus 26,745 ± 49076,77 31,239–30,477
TU6 Bärenloch, CH 32.4 95.59 eremus NA
TU7 Bärenloch, CH 130.2 98.61 eremus NA
TU8 Bärenloch, CH 260.3 99.08 eremus NA
TU76 Casamène, FR 19.2 97.59 spelaeus NA
TU77 Casamène, FR 79.8 100 ingressus W 47,406 ± 1309* …−48,913
TU78 Casamène, FR 10.7 89.23 spelaeus NA
JK3204 Casamène, FR 100.2 99.33 spelaeus 39,456 ± 494* 43,573–42,772
JK3206 Casamène, FR 38.1 99.35 spelaeus 43,890 ± 999* 48,188–46,071
JK3212 Casamène, FR 51.2 99.82 ingressus W 38,153 ± 430* 42,608–42,039
JK3215 Casamène, FR 49.5 99.26 ingressus W 30,518 ± 170* 34,662–34,298
JK3216 Casamène, FR 80.7 99.86 ingressus W 41,366 ± 518* 45,289–44,370
JK1726 Hohle Fels, GER 16.9 97.19 spelaeus NA
TU151 Vrelska Cave, SRB 97.9 99.36 ingressus SE 40,470 ± 567* 44,532–43,488
TU152 Kovačevića Cave, SRB 75.4 97.8 ingressus SE 48,116 ± 1,432* …−49,044
TU153 Vrelska Cave, SRB 16.9 90.49 ingressus C 40,595 ± 574* 44,656–43,588
TU154 Vrelska Cave, SRB 22.4 92.6 ingressus SE 45,918 ± 1,093* …−48,390
TU155 Kovačevića Cave, SRB 125.2 98.44 ingressus SE 45,673 ± 1,067* …−48,240
TU156 Vrelska Cave, SRB 16.2 94.37 ingressus SE 42,687 ± 740* 46,606–45,240
TU157 Vrelska Cave, SRB 363.5 99.68 ingressus SE 38,330 ± 440* 42,720–42,140
TU158 Kovačevića Cave, SRB 5.1 72.19 ingressus SE NA
TU163 Vrelska Cave, SRB 44.7 97.76 ingressus SE 44,748 ± 947* 49,101–47,018
TU166 Kovačevića Cave, SRB 80.2 97.65 ingressus SE 46,429 ± 1,167* …−48,623
TU167 Vrelska Cave, SRB 9.1 87.84 ingressus SE 43,641 ± 826* 47,729–45,978
TU168 Kovačevića Cave, SRB 79.1 98.58 ingressus SE 46,376 ± 1,167* …−48,594
TU169 Kovačevića Cave, SRB 7.3 83.21 ingressus SE 40,848 ± 590* 44,914–43,814
TU170 Kovačevića Cave, SRB 278.9 98.85 ingressus SE 45,449 ± 1,035* 49,837–47,947
TU172 Vasiljska, SRB 10.2 89.19 ingressus SE 43,027 ± 445* 46,638–45,740
TU173 Smolućka, SRB 6.7 72.59 ingressus SE 30,649 ± 113* 34,747–34,465
TU174 Mirilovska, SRB 32.7 98.68 ingressus SE 28,807 ± 149* 33,252–32,755
TU511 l’Arbreda, ES 5 73.18 spelaeus NA
TU512 l’Arbreda, ES 15.7 96 spelaeus NA
TU779 Prélétang, FR 240.7 99.58 spelaeus NA
TU781 Prélétang, FR 59 99.33 spelaeus 42,400 ± 409*,77 46,031–45,284
TU782 Prélétang, FR 133.7 99.45 spelaeus 40,423 ± 330*,77 44,340–43,635
TU783 Prélétang, FR 184.8 99.46 spelaeus 38,742 ± 277*,77 42,888–42,481
TU784 Prélétang, FR 324.5 99.59 spelaeus 49,788 ± 1,006*,77, >45,000
TU841 Paina, IT 4.5 73.2 ingressus C 20,015 ± 4624 24,275–23,880
TU842 Paina, IT 17 97.34 ingressus C NA
TU843 Paina, IT 25.8 98.77 ingressus C 19,914 ± 4524 24.167–23.764
TU844 Paina, IT 6.5 87.18 ingressus C 19,975 ± 4624 24,234–23,839
TU847 Paina, IT 17.7 98.22 ingressus C NA
TU848 Broion, IT 121.5 99.67 ingressus C 29,001 ± 12324 33,597–32,844
TU851 Broion, IT 9.2 93.68 ingressus C NA
TU852 Broion, IT 6.2 84.06 ingressus C 25,978 ± 7024 30.630–29,855
TU853 Trene, IT 4.9 75.44 ingressus C 25,290 ± 6624 29,599–29,079
TU854 Trene, IT 27 98.64 ingressus C 24,755 ± 6324 28,977–28,566
TU855 Trene, IT 27.7 98.81 ingressus C 19,656 ± 4424 23,907–23,461
TU857 Trene, IT 73 99.14 ingressus C NA
TU860 Perspektywiczna Cave, PL 39.2 99.44 ingressus C 41,446 ± 638*,28 45,448–44,335
TU861 Perspektywiczna Cave, PL 752.5 99.74 ingressus SE 40,200 ± 1,20028 44,775–42,905
TU863 Perspektywiczna Cave, PL 319.5 99.73 ingressus SE 41,600 ± 1,40028 46,176–43,715
TU865 Perspektywiczna Cave, PL 219.2 99.72 ingressus C 47,538 ± 1,337*,28 …−48,934
cohabited since 50 ka BP with the Alpine forms of the U. spelaeus complex, U. s. ladinicus and U. s. eremus, ulti-mately replacing these older haplotypes42 except in remote and/or high-altitude sites such as Bärenloch. Towards the onset of the LGM, the U. ingressus haplotypes retracted from their eastern habitats and advanced westwards, replacing the U. s. spelaeus haplotypes in the Ach valley at the eastern extension of the U. s. spelaeus distribution between 36 and 32 ka BP12,29,42,46.
Our results challenge this conclusion, considering that we were able to identify a deeply divergent branch from Casamène, France, clustering within the U. ingressus clade (Fig. 2, Figure S2). These specimens not only extend the U. ingressus distribution westwards across the Rhine river, but they also predate the hitherto known presence of U. ingressus in Western Europe by nearly 15 ka46. Furthermore, the obtained mitochondrial genomes are only closely related to one other specimen from Zoolithen cave, Germany40. Besides Herdengel, Austria, and the Ach valley caves in Southern Germany, Zoolithen cave represents a third site where both major haplogroups were genetically observed40,42. However, Zoolithen cave is the only of these three cases where the U. s. spelaeus remains are potentially younger than the U. ingressus fossil, previously molecularly dated to 37.742 or 4941 ka BP. In comparison, the U. s. spelaeus specimens are dated to be younger than 34.242 or 56.941 ka BP according to Stiller42 respectively Fortes and colleagues41. In Casamène, U. ingressus and U. s. ladinicus haplotypes coexisted at least ~4 ka between 47.2 and 43.2 ka BP, whereby U. ingressus inhabited the cave from 49.3 to 34.5 ka BP. Since a basal U. ingressus lineage continuously populated parts of the French Jura already for 15,000 years before the Ach valley haplogroup replacement, it appears unlikely that the expansion of U. ingressus occurred as a single, gradual westward migration. Instead, our results suggest that the original distribution of U. ingressus spanned much larger parts of Central Europe than previously assumed and that some relict populations persisted after the eastwards shift of their habitat.
Our analyses revealed new evidence for a second, eastward migration of U. ingressus. Noticeably, 16 out of 17 Serbian samples branch within the South-Eastern U. ingressus subclade. However, one specimen from Vrelska clusters with samples that originate from the Ural Mountain region (Bolshoi Glukhoi, Medvezhiya and Serpievskaya caves) within the Central European U. ingressus subclade. This result may reflect, as previously suggested by Baca and colleagues47, eastward migrations or gene flow between Central Europe and the Ural Mountains populations. A similar geographical pattern of gene flow between the European aurochs and the Eurasian steppe bison was recently reported by Soubrier and colleagues48. However, so far, this hypothesis was only supported by the comparatively old samples from Niedźwiedzia cave, Poland, dating between 41.5 and 87 ka BP47,49. In comparison, no published date of U. ingressus remains from the Ural Mountain region is older than 47.6 ka BP so far47,49. The Polish specimens share mitochondrial control region haplotypes closely related to the Ural Mountains ones, potentially indicating long-distance genetic exchange49. Forming an outgroup to all three Russian sequences, our sample from Vrelska cave suggests that this migration or gene flow from Central Europe did not only comprise the East European Plain north of the Carpathian Mountains but also the Southern Balkan Peninsula and that the distribution of this Central European haplogroup at the time of its highest diversity42 extended further eastward at least until 44 ka BP, potentially representing a taxon previously designated as Ursus
kanivetz kanivetz by Baryshnikov and colleagues based on morphological features18,50. In contrast, specimens from Serbia belonging to the South-Eastern group all together yield radiocarbon dates ranging between >49 and 33 ka BP. The persisting presence of only the Southern-Eastern lineage and the lack of the Central European one may be associated with a subsequent replacement of the latter population at the Southern Balkan Peninsula. However, more mitochondrial genomes from South-Eastern Europe are needed to confirm this hypothesis. Focusing on the North-Eastern Italian cave bears from Paina, Trene and Broion, these samples exhibit clos-est genetic affinities to other Central European U. ingressus individuals from Austria, Slovenia and Southern Germany. Interestingly, all four radiocarbon dated specimens younger than 25 ka BP (TU841, TU843, TU844 and TU855) form together a monophyletic clade, suggesting low genetic diversity within the relict population of the Berici Hills.
In an analogous manner, we investigated the phylogeography of the U. spelaeus complex. To infer the topol-ogy within the U. spelaeus clade, we generated sequences of U. s. eremus from Bärenloch as well as the first mitogenome of U. s. ladinicus from Casamène and Prélétang. Notably, it was not possible to reliably phyloge-netically classify the cave bears from Bärenloch using the mitochondrial control region-based approach. While these phylogenetical reconstructions place the Bärenloch specimens within the U. s. ladinicus branch (Figure S1, Figure S3), the tree featuring complete mitochondrial genomes yields another topology (Fig. 2, Figure S1, Figure S2). These findings confirm that phylogenetic relationships within branches of the mitochondrial control region tree should be interpreted with caution as discussed previously44. This observation could be explained by the impact of recurrent mutation that appears most acute in closely related control region haplotypes exhibiting
ID Site Mean Cov. 3X Cov. in % Classification 14C Cal. 14C (1-sigma)
TU866 Perspektywiczna Cave, PL 114.4 99.64 ingressus SE NA
TU867 Perspektywiczna Cave, PL 551.7 99.74 ingressus SE NA
TU868 Perspektywiczna Cave, PL 101.4 99.64 ingressus C NA
Table 1. Details of cave bear samples reported in this study. Details of Late Pleistocene European cave bear specimens successfully generating more than threefold coverage and more than 70% complete mitochondrial genomes after in-solution enrichment. Radiocar bon (14C) dates were calibrated to the Intcal 13 curve74 using the rcarbon package75. Samples without radiocarbon date are denoted by NA (not available). Radiocarbon dates obtained for this study are marked with an asterisk. Additional information about collagen quality can be found in Table S2.
a low level of evolutionary divergence as proposed by Knaus and colleagues44. Using complete mitochondrial genomes, U. s. eremus forms a distinct outgroup to all the other U. spelaeus sequences. Regarding U. s. ladinicus, our analysis demonstrated that this group previously described as monophyletic45 forms a paraphyletic group branching off basally to the U. s. spelaeus clade, and comprising haplotypes from Casamène, Prélétang, and the Grotte d’Ours. Thus, the control region haplogroup previously labelled as U. s. ladinicus19 does not represent a genetically distinct unit (based on the mtDNA), but rather a transitional form between the MRCA shared with U.
s. eremus and the typical U. s. spelaeus haplotypes. This again emphasizes that previous taxonomic classifications
based on morphology are not fully congruent with mtDNA haplogroups20,21,29. However, without knowledge of the nuclear genome, it is not possible to exclude gene flow as a potential reason for shared haplotypes as indicated by recent analyses of the autosomal cave bear genome21. In general, the basal position of these specimens as well as of U. s. spelaeus samples from Zoolithen cave, Germany, within the U. spelaeus haplogroup may indicate an Eastern French or North-Western alpine origin of the ladinicus/spelaeus (sensu stricto) haplogroup complex.
Extinction.
As demonstrated by Stiller and colleagues11, the start of the cave bear population decline preceded its final extinction by approximately 25 ka. A slow and continuous decline may be correlated with changing envi-ronmental conditions. Yet, climate and associated vegetation change as main factors appear improbable, albeit their strictly herbivorous feeding preferences remained unchanged during the Late Pleistocene12,24,51, since cave bears were well adapted to severe climate as indicated by their appearance beyond the Arctic Circle16. This is also congruent with our estimations of the cave bear population size development through the last 150 to 25 ka, exhibiting a relatively stable population size even during the two cold periods MIS 6 and MIS 4. Also, the multiple Heinrich cooling events during MIS 3 did apparently not coincide with sudden decreases in population size. Therefore, it appears unlikely that these previous climatic fluctuations did substantially affect the cave bear population in Europe. Furthermore, as emphasized by Stiller and colleagues11, the cooling climate of the begin-ning LGM did not start before 30 ka BP, nearly 20 ka after the beginbegin-ning of the cave bear population decline, Figure 2. Maximum Clade Credibility (MCC) phylogeny of 123 mitochondrial genomes. MCC phylogeny resulting from a BEAST analysis of 64 previously published and 59 mitochondrial genomes reported here drawn to a timescale. The relaxed molecular clock was calibrated using the tip-dating method. Nodes leading to major clades are labelled with the inferred tMRCA (95% highest posterior density of node ages is shown by grey bars). Posterior probabilities from 200,000,000 steps are provided in parentheses along branches leading to major clades. For visibility reasons, only support values related to the relationship of the major clades are shown. Haplogroup clades19 are indicated by the colour coding matching Fig. 1. Haplogroup identifications19 based on previous mtDNA40,41 analyses are provided as rectangular bars to the right of sample names. Trees were visualised using Figtree 1.4.3 (tree.bio.ed.ac.uk/software/figtree/).suggesting instead a major impact of human activities related to the expansion of modern humans in Europe that took place at the same time52–54. As documented in the present study, the cave bear demise did not proceed slowly. Although the initial decline in population size started shortly before 50 ka BP during the end of the Mousterian associated with Neanderthals, the more drastic downturn of the European cave bear took place at around 35 to 40 ka BP at the onset of the Aurignacian and the expansion of anatomically modern humans in Europe55. As demonstrated by Fortes and colleagues41, cave bears supposedly exhibited a homing behaviour indicated by the strong association between mitochondrial haplotype and cave. Such high dependence of cave bears on their birth caves may have created severe competition with Neanderthals, but especially with anatomically modern humans41. This was due not only to growing human density and group sizes but also increased human residence times11,35,36,52. These factors as well as the introduction of new technology (such as simple and split-based bone points) to more efficiently extract animal nutritional resources52,56, made the cave bears also more at risk for direct hunting by hominins32,36–38,57. Especially for North-Eastern Italy, namely Rio Secco Cave, Fumane Cave and the Berici Hills sites (Paina and Trene), persistence of cave bear exploitation from the Late Neanderthal to the anatomically modern human occupation during the last 50 ka years was recently reported24,32,38, supporting hunting evidence from other European locations such as the Ach valley caves36, Germany, or Potočka zijalka37, Slovenia. The negative human effect on cave bear populations would have been increased at the onset of the Last Glacial Maximum by the cooling climate and subsequently lower vegetation productivity, fragmenting the pop-ulation into various subpoppop-ulations inhabiting small refugial habitats12 with suitable, stable microclimates and thus a broad range of available plant types (such as the Berici Hills24) as suggested by Baca and colleagues23. For many late Pleistocene megafauna species, such reductions in habitat range, population size and genetic diversity are intrinsically linked over evolutionary time3. This seems also congruent with results reported by Cooper and colleagues, indicating that humans canalised cave bear metapopulation extinction by interrupting the subpop-ulation connectivity7. Until the end of the maximum extent of the Scandinavian Ice sheet, only a few isolated populations survived across Central and Eastern Europe22–24. Consequently, the U. ingressus specimens from Stajnia cave and the Venetian Pre-Alps (Paina and Trene) dating to 26 and 25 cal. yr. BP23 and between 24 and 23 cal. yr. BP24 respectively represent the genetically impoverished relict of the much larger and more diverse cave bear population in Europe.
Thus, our study highlights the potential role of human activity in the general extinction and local extirpation of the European cave bear. Furthermore, we have shown that our current knowledge of cave bear phylogeogra-phy is biased by the employed methodology and the small and/or sparse number of sampled specimens. Using complete mitochondrial genomes covering spatially widespread sites can mitigate these problems, allowing such studies to gain deeper insight into the population dynamics of Late Pleistocene megafauna species such as the cave bear. Even if these insights are restricted to the maternal lineage and limited by the available number and length of DNA sequences, the conclusions already provide a more detailed understanding of cave bear population dynamics than previous studies. In the future, new high quality AMS radiocarbon dates of more extensive geo-graphic coverage and, in particular, nuclear DNA data, combined with high-resolution palaeoecological data for each population and individual studied, will shed light on the evolution and extinction of cave bears.
Figure 3. Bayesian skyline plot derived from an alignment of 123 complete mitochondrial genomes. Effective female population sizes (Nef) times generation time (g) of all European cave bears (black), Ursus ingressus (orange), and the Ursus spelaeus complex (violet). x axis: time in 14C years before present; y axis: female N
ef x g; centre line: median Nef x g; upper and lower bounds: limits of 95% highest posterior density intervals.
Material and Methods
Sample collection.
We selected 81 assumed cave bear specimens to be included in this study, featuring geo-graphic regions that have been underrepresented in previous genetic work. We then generated 59 complete mito-chondrial genome sequences using the approach described below. In addition, we obtained direct Accelerator Mass Spectrometry (AMS) radiocarbon dates on bone collagen for 24 samples for which no 14C age was availableso far.
DNA extraction.
To minimize environmental contamination, bone samples were exposed to UV-light at least 30 minutes from all sides. Afterwards, 30–54.9 mg bone powder was removed from the inner substantia compacta of a long bone of each specimen using a dentistry drill. Afterwards, ancient DNA was extracted accord-ing to the method described by Dabney and colleagues14. DNA extracts were converted into double-indexed Illumina libraries using the approaches described elsewhere58,59. All extractions and pre-amplification steps of the library preparation were performed in a designated ancient DNA clean room facility. Indexed libraries were amplified in 100 μl reactions with AccuPrime Pfx and Herculase II Fusion followed by purification. Target enrich-ment of mitochondrial DNA was performed by in-solution capture of the pooled libraries using baits generated from modern polar bear (Ursus maritimus) mitochondrial DNA as described by Furtwängler and colleagues60. Finally, the enriched libraries were multiplex sequenced on an Illumina HiSeq. 4000 using 75 + 8 + 8 cycles at the Max Planck Institute for Science of Human History, Jena, Germany.Sequence processing.
De-indexing was performed by sorting all sequences corresponding to their p7 and p5 index combinations. Next, read processing, including adaptor trimming, quality filtering and duplicate removal, was performed using the software EAGER61. Mapping of single-end reads to a reference cave bear mito-chondrial genome (NC_011112.1) using CircularMapper and generating 3-fold consensus sequences was also conducted using EAGER61. To control for damage-derived substitutions, we applied an established set of crite-ria62,63 to create the consensus sequences and alignments: a minimum non-duplicate coverage for a position to be called (3X) and a minimal allele frequency for a call to made (75%). When either are not met an ‘N’ is called. Only sequences for which no more than 30% of bases are called as N (minimum 70% 3X coverage) are included in the alignment. Additionally, a second alignment using a stricter set of criteria62,63 (minimum 10X non-duplicate coverage for a position to be called, minimal allele frequency 90%, minimum 80% 10X coverage) was generated to examine possible incongruities between the tree topologies caused by low-coverage samples.Data from other studies.
We included in our study complete mitochondrial genome sequences of 64 European40,41,64 and 2 Caucasus cave bears40 previously published. For Bayesian analyses, Ursus kudarensis cave bears from Hovk40, Armenia, were subsequently excluded.Alignment and model selection.
Multiple Sequence Alignment was conducted in MAFFT 7.31065,66. Model selection was performed using ModelFinder, integrated in IQ-Tree 1.5.567.Inferring phylogenetic relationships.
Phylogenies were constructed from a total of 16,360 positions using MEGA 7.1.01468 and IQ-Tree 1.5.5 including ultrafast bootstrap69. Maximum-likelihood topologies were generated for all positions for which coverage was at least three-fold in each of the reconstructed sequences. Alignment columns with gaps or missing data were included. Bootstrap support values were obtained over 10,000 replicate data sets, using the American black bear (Ursus americanus, JX196366.1) as an outgroup. The phyloge-netic trees were edited in FigTree version 1.4.3 (http://tree.bio.ed.ac.uk/software/figtree).Comparison of D-Loop and Mitogenome Tree Topology Differences.
To identify D-Loop coor-dinates within our reconstructed mitochondrial sequences, these were aligned to D-Loop sequences of Ursusspelaeus previously published by Stiller and colleagues42 using MEGA 7.1.0 and sequences outside of the aligned regions were discarded. Calculated maximum-likelihood topologies were then compared using the tanglegram function integrated in Dendroscope 3.5.9 by Huson and Scornavacca (http://dendroscope.org)70.
Bayesian phylogenetic inference and demographic reconstruction.
Dated Bayesian phylogeny and demographic reconstructions were obtained using BEAST 1.8.471. The alignment, including 59 new mitogenomes and 64 previously published mitogenomes, 16,360 nt long, was partitioned using PartitionFinder 2.1.172 using six input data blocks (noncoding, tRNA, rRNA, and codon position 1, 2 and 3 of the protein coding genes), greedy search scheme and BIC model selection. The selected five partitions (tRNA and rRNA were combined into one partition by PartitionFinder) were included in BEAST analysis. We used tipdating to calibrate the relaxed molec-ular clock (uncorrelated, lognormal, separate clock for each partition). For radiocarbon and stratigraphy-based dated samples we used midpoint ages as point tipdates. For samples, for which age estimates have been previously estimated using molecular dating and are published, we used their ages as distributions rather than points in the analysis with normal priors (the estimated molecular age as the mean and 10% of the molecular age estimate standard deviation). Undated samples were assigned uniform age priors between 20,000 and 120,000 years old. Results of the molecular dating of these samples (median estimated age plus 95% credibility intervals as well as posterior density distribution for each estimate) can be found in Table S1 and Figure S4. Bayesian skyline pop-ulation model was used. Markov Chain was run under for 200 million steps with sampling every 20,000th step.Mixing and convergence was inspected using Tracer 1.7.173.
Accession numbers.
The demultiplexed sequencing data for the 59 cave bear mtDNA genomes is deposited in the NCBI SRA Archive with the BioProject ID PRJNA545596.References
1. Barnosky, A. D., Koch, P. L., Feranec, R. S., Wing, S. L. & Shabel, A. B. Assessing the causes of late Pleistocene extinctions on the continents. Science 306, 70–75, https://doi.org/10.1126/science.1101476 (2004).
2. Stuart, A. J. & Lister, A. M. Patterns of Late Quaternary megafaunal extinctions in Europe and northern Asia. Courier Forschungsinstitut Senckenberg 259, 287–297 (2007).
3. Lorenzen, E. D. et al. Species-specific responses of Late Quaternary megafauna to climate and humans. Nature 479, 359–364, https:// doi.org/10.1038/nature10574 (2011).
4. Doughty, C. E. et al. Megafauna extinction, tree species range reduction, and carbon storage in Amazonian forests. Ecography 39(2), 194–203, https://doi.org/10.1111/ecog.01587 (2016).
5. Malhi, Y. et al. Megafauna and ecosystem function from the Pleistocene to the Anthropocene. Proc Natl Acad Sci USA 113, 838–846,
https://doi.org/10.1073/pnas.1502540113 (2016).
6. Bocherens, H. The rise of the anthroposphere since 50,000 years: an ecological replacement of megaherbivores by humans in terrestrial ecoystems? Frontiers in Ecology and Evolution 6, 3, https://doi.org/10.3389/fevo.2018.00003 (2018).
7. Cooper, A. et al. Abrupt warming events drove Late Pleistocene Holarctic megafaunal turnover. Science 349, 602–606, https://doi. org/10.1126/science.aac4315 (2015).
8. Wan, X. & Zhang, Z. Climate warming and humans played different roles in triggering Late Quaternary extinctions in east and west Eurasia. Proc. R. Soc. B 284, 20162438, https://doi.org/10.1098/rspb.2016.2438 (2017).
9. Lyons, S. K. et al. The changing role of mammal life histories in Late Quaternary extinction vulnerability on continents and islands. Biol. Lett. 12, 20160342, https://doi.org/10.1098/rsbl.2016.0342 (2016).
10. Barnett, R., Yamaguchi, N., Barnes, I. & Cooper, A. The origin, current diversity, and future conservation of the modern lion (Panthera leo). Proc. R. Soc. B 273, 2159–2168, https://doi.org/10.1098/rspb.2006.3555 (2006).
11. Stiller, M. et al. Withering away–25,000 years of genetic decline preceded cave bear extinction. Mol Biol Evol. 27, 975–978, https:// doi.org/10.1093/molbev/msq083 (2010).
12. Bocherens, H. et al. The last of its kind? Radiocarbon, ancient DNA and stable isotope evidence from a late cave bear (Ursus spelaeus
ROSENMÜLLER, 1794) from Rochedane (France). Quaternary International Volumes 339–340, 179–188, https://doi.org/10.1016/j.
quaint.2013.05.021 (2014).
13. Rabeder, G., Nagel, D. & Pacher, M. Der Höhlenbär. - Species 4: 1–111, Stuttgart (Jan Thorbecke Verl.) (2000).
14. Dabney, J. et al. Complete mitochondrial genome sequence of a Middle Pleistocene cave bear reconstructed from ultrashort DNA fragments. Proc Natl Acad Sci USA 110, 15758–15763, https://doi.org/10.1073/pnas.1314445110 (2013).
15. Knapp, M. et al. First DNA sequences from Asian cave bear fossils reveal deep divergences and complex phylogeographic patterns. Mol Ecol. 18, 1225–1238, https://doi.org/10.1111/j.1365-294X.2009.04088.x (2009).
16. Sher, A. V. et al. The first record of “spelaeoid” bears in Arctic Siberia. Quaternary Science Reviews 30(17–18), 2238–2249, https:// doi.org/10.1016/j.quascirev.2010.10.016 (2011).
17. Baryshnikov, G. F. & Foronova, I. Pleistocene small cave bear (Ursus rossicus) from the South Siberia, Russia. CAD. LAB. XEOL. LAXE 26, 373–398 (2001).
18. Baryshnikov, G. F. & Puzachenko, A. Y. Craniometrical variability in the cave bears (Carnivora, Ursidae): Multivariate comparative analysis. Quaternary International 245, 350–368, https://doi.org/10.1016/j.quaint.2011.02.035 (2011).
19. Rabeder, G., Hofreiter, M., Nagel, D. & Withalm, G. New Taxa of Alpine Cave Bears (Ursidae, Carnivora). Proceedings of the 9th International Cave Bear Conference, Cahiers scientifiques du Centre de Conservation et d’Etude des Collections (Muséum d’Histoire naturelle de Lyon)/Hors Série 2, 49–67 (2004).
20. Münzel, S. C. & Athen, K. Correlating genetic results with Biometric analysis on metapodial bones. Slovenký Kras, Acta Carsologica Slovaca 47, 47–56 (2009).
21. Barlow, A. et al. Partial genomic survival of cave bears in living brown bears. Nat Ecol Evol. 2, 1563–1570, https://doi.org/10.1038/ s41559-018-0654-8 (2018).
22. Pacher, M. & Stuart, A. J. Extinction chronology and palaeobiology of the cave bear (Ursus spelaeus). Boreas 38, 189–206, https:// doi.org/10.1111/j.1502-3885.2007.00071.x (2009).
23. Baca, M. et al. Retreat and extinction of the Late Pleistocene cave bear (Ursus spelaeus sensu lato). Die. Naturwissenschaften 103, 92,
https://doi.org/10.1007/s00114-016-1414-8 (2016).
24. Terlato, G., et al Chronological and Isotopic data support a revision for the timing of cave bear extinction in Mediterranean Europe. Historical Biology 1–11, https://doi.org/10.1080/08912963.2018.1448395 (2018).
25. Bocherens, H., Fizet, M. & Mariotti, A. Diet, physiology and ecology of fossil mammals as inferred from stable carbon and nitrogen isotope biogeochemistry: implications for Pleistocene bears. Palaeogeography, Palaeoclimatology, Palaeoecology 107, 213–225,
https://doi.org/10.1016/0031-0182(94)90095-7 (1994).
26. Bocherens, H. et al. Niche partitioning between two sympatric genetically distinct cave bears (Ursus spelaeus and Ursus ingressus) and brown bear (Ursus arctos) from Austria: Isotopic evidence from fossil bones. Quaternary International 245, 238–248, https:// doi.org/10.1016/j.quaint.2010.12.020 (2013).
27. Naito, Y. I. et al. Evidence for herbivorous cave bears (Ursus spelaeus) in Goyet Cave, Belgium: implications for palaeodietary reconstruction of fossil bears using amino acid δ15N approaches. J. Quaternary Sci. 31, 598–606, https://doi.org/10.1002/jqs.2883
(2016).
28. Krajcarz, M. et al. Isotopic variability of cave bears (δ15N, δ13C) across Europe during MIS 3. Quaternary Science Reviews 131, 51–72, https://doi.org/10.1016/j.quascirev.2015.10.028 (2016).
29. Münzel, S. C. et al. Pleistocene bears in the Swabian Jura (Germany): Genetic replacement, ecological displacement, extinctions and survival. Quaternary International 245, 225–237, https://doi.org/10.1016/j.quaint.2011.03.060 (2011).
30. Clark, P. U. et al. The Last Glacial Maximum. Science 325, 710–714, https://doi.org/10.1126/science.1172873 (2009).
31. Monegato, G., Scardia, G., Hajdas, I., Rizzini, F. & Piccin, A. The Alpine LGM in the boreal ice-sheets game. Nature Scientific Reports
7, 2078 (2017).
32. Romandini, M. et al. Bears and humans, a Neanderthal tale. Reconstructing uncommon behaviors from zooarchaeological evidence in southern Europe. Journal of Archaeological Science 90, 71–91, https://doi.org/10.1016/j.jas.2017.12.004 (2018).
33. Kurtén, B. Life and death of the Pleistocene cave bear. Acta Zoologica Fennica 95, 1–59 (1958).
34. Grayson, D. K & Delpech, F. The Upper Paleolithic at Grotte XVI (Dordogne, France): richness, evenness, and cave bears, in: Hays, M. A. & Thacker, P. (Eds), Questioning the Answers: Resolving Fundamental Problems of the Early Upper Paleolithic. British Archaeological Reports 1005, 187–197 (2001).
35. Grayson, D. K. & Delpech, F. Ungulates and the Middle-to-Upper Paleolithic transition at Grotte XVI (Dordogne, France). J Archaeol Sci. 30, 1633–1648, https://doi.org/10.1016/S0305-4403(03)00064-5 (2003).
36. Münzel, S. C. & Conard, N. J. Cave Bear Hunting in the Hohle Fels, a Cave Site in the Ach Valley, Swabian Jura. Rev Paleobiol. 23, 877–885 (2004).
37. Withalm, G. New Evidence for Cave Bear Hunting from Potočka zijalka (Slovenia). Mitt. Komm. Quartärforsch. Österr. Akad. Wiss.
13, 219–234 (2004).
38. Romandini, M. & Nannini, N. Epigravettians hunters in the territory of the bear of caves: The case of Covolo Fortificato di Trene (Vicenza, Italy). Anthropologie 116, 39–56 (2012).
39. Ramakrishnan, U. & Hadly, E. A. Using phylochronology to reveal cryptic population histories: review and synthesis of 29 ancient DNA studies. Mol Ecol. 18, 1310–1330, https://doi.org/10.1111/j.1365-294X.2009.04092.x (2009).
40. Stiller, M., Knapp, M., Stenzel, U., Hofreiter, M. & Meyer, M. Direct multiplex sequencing (DMPS)–a novel method for targeted
high-throughput sequencing of ancient and highly degraded DNA. Genome Res. 19, 1843–1848, https://doi.org/10.1101/
gr.095760.109 (2009).
41. Fortes, G. G. et al. Ancient DNA reveals differences in behaviour and sociality between brown bears and extinct cave bears. Mol Ecol.
25, 4907–4918, https://doi.org/10.1111/mec.13800 (2016).
42. Stiller, M. et al. diversity and evolution of the Pleistocene cave bear complex. Quaternary International 339–340, 224–231, https:// doi.org/10.1016/j.quaint.2013.09.023 (2014).
43. Subramanian, S. et al. High mitogenomic evolutionary rates and time dependency. Trends Genet. 11, 482–486, https://doi.
org/10.1016/j.tig.2009.09.005 (2009).
44. Knaus, B. J., Cronn, E., Liston, A., Pilgrim, K. & Schwartz, M. Mitochondrial genome sequences illuminate maternal lineages of conservation concern in a rare carnivore. BMC Ecology 11, 10, https://doi.org/10.1186/1472-6785-11-10 (2011).
45. Rabeder, G. & Hofreiter, M. Der neue Stammbaum der alpinen Höhlenbären. Die Höhle 55(1–4), 58–77 (2004).
46. Hofreiter, M. et al. Sudden replacement of cave bear mitochondrial DNA in the late Pleistocene. Curr Biol. 17, R122–123, https://doi. org/10.1016/j.cub.2007.01.026 (2007).
47. Baca, M. et al. Genetic analysis of cave bear specimens from Niedźwiedzia Cave, Sudetes, Poland. Palaeontologia. Electronica 15 2;21A, palaeo-electronica.org/content/2012-issue-2-articles/263-cave-bears-from-poland (2012).
48. Soubrier, J. et al. Early cave art and ancient DNA record the origin of European bison. Nature. Communications 7, 13158, https://doi. org/10.1038/ncomms13158 (2016).
49. Baca, M. et al. Ancient DNA and dating of cave bear remains from Niedźwiedzia Cave suggest early appearance of Ursus ingressus in Sudetes. Quaternary International 339–340, 217–223, https://doi.org/10.1016/j.quaint.2013.08.033 (2014).
50. Baryshnikov, G. F & Puzachenko A. Y. Morphometry of upper cheek teeth of cave bears (Carnivora, Ursidae). Boreas, https://doi. org/10.1111/bor.12360 (2018).
51. Bocherens, H. Isotopic insights on cave bear palaeodiet. Historical Biology, 1–12, https://doi.org/10.1080/08912963.2018.14465419
(2018).
52. Conard, N. J. The Demise of the Neanderthal Cultural Niche and the Beginning of the Upper Paleolithic in Southwestern Germany. In: Neanderthal Lifeways, Subsistence and Technology: One Hundred Fifty Years of Neanderthal Study, Vertebrate Paleobiology and Paleoanthropology (eds Conard, N. J. & Richter, J.) 223–240 (Springer Science + Business Media B.V. 2011).
53. Nigst, P. et al. Early modern human settlement of Europe north of the Alps occurred 43,500 years ago in a cold steppe-type
environment. Proceedings of the National Academy of Sciences 111(40), 14394–14399, https://doi.org/10.1073/pnas.1412201111
(2014).
54. Hublin, J. J. The modern human colonization of western Eurasia: when and where? Quaternary Science Reviews 118, 194–210,
https://doi.org/10.1016/j.quascirev.2014.08.011 (2015).
55. Benazzi, S. et al. The makers of the Protoaurignacian and implications for Neandertal extinction. Science 348, 793–796, https://doi. org/10.1126/science.aaa2773 (2015).
56. Conard, N. J., Bolus, M., Goldberg, P. & Münzel, S. C. The last Neanderthals and first Modern Humans in the Swabian Jura. In: When Neanderthals and Modern Humans Met (ed. Conard, N. J.) 305–341 (Kerns Verlag, 2006).
57. Wojtal, P., Wilczyński, J., Nadachowski, A. & Münzel, S. C. Gravettian hunting and exploitation of bears in Central Europe. Quat Int
359–360, 58–71, https://doi.org/10.1016/j.quaint.2014.10.017 (2015).
58. Meyer, M. & Kircher, M. Illumina sequencing library preparation for highly multiplexed target capture and sequencing. Cold Spring Harb Protoc. https://doi.org/10.1101/pdb.prot5448 (2010).
59. Kircher, M., Sawyer, S. & Meyer, M. Double indexing overcomes inaccuracies in multiplex sequencing on the Illumina platform. Nucleic Acids Res. 40, e3, https://doi.org/10.1093/nar/gkr771 (2012).
60. Furtwängler, A. et al. Ratio of mitochondrial to nuclear DNA affects contamination estimates in ancient DNA analysis. Sci Rep. 8,
14075, https://doi.org/10.1038/s41598-018-32083-0DO (2018).
61. Peltzer, A. et al. EAGER: efficient ancient genome reconstruction. Genome Biol. 17, 60, https://doi.org/10.1186/s13059-016-0918-z
(2016).
62. Chang, D. et al. The evolutionary and phylogeographic history of woolly mammoths: a comprehensive mitogenomic analysis. Scientific Reports 7, 44585, https://doi.org/10.1038/srep44585 (2017).
63. Fellows Yates, J. A. et al. Central European Woolly Mammoth Population Dynamics: Insights from Late Pleistocene Mitochondrial Genomes. Scientific Reports 7, 17714, https://doi.org/10.1038/s41598-017-17723-1 (2017).
64. Bon, C. et al. Deciphering the complete mitochondrial genome and phylogeny of the extinct cave bear in the Paleolithic painted cave of Chauvet. Proc Natl Acad Sci U A. 105, 17447–17452, https://doi.org/10.1073/pnas.0806143105 (2008).
65. Katoh, K., Misawa, K., Kuma, K. & Miyata, T. MAFFT: a novel method for rapid multiple sequence alignment based on fast Fourier transform. Nucleic Acids Res. 30, 3059–3066 (2002).
66. Katoh, K. & Standley, D. M. MAFFT multiple sequence alignment software version 7: improvements in performance and usability. Mol Biol Evol. 30, 772–780, https://doi.org/10.1093/molbev/mst010 (2013).
67. Kalyaanamoorthy, S., Minh, B. Q., Wong, T. K. F., von Haeseler, A. & Jermiin, L. S. ModelFinder: Fast model selection for accurate phylogenetic estimates. Nat. Methods 14, 587–589, https://doi.org/10.1038/nmeth.4285 (2017).
68. Kumar, S., Stecher, G. & Tamura, K. MEGA7: Molecular Evolutionary Genetics Analysis Version 7.0 for Bigger Datasets. Mol Biol Evol 33, 1870–1874, https://doi.org/10.1093/molbev/msw054 (2016).
69. Hoang, D. T., Chernomor, O., von Haeseler, A., Minh, B. Q. & Vinh, L. S. UFBoot2: Improving the ultrafast bootstrap approximation. Mol. Biol. Evol. 35, 518–522, https://doi.org/10.1093/molbev/msx281 (2018).
70. Huson, D. H. & Scornavacca, C. Dendroscope 3: an interactive tool for rooted phylogenetic trees and networks. Syst Biol. 61, 1061–1067, https://doi.org/10.1093/sysbio/sys062 (2012).
71. Drummond, A. J., Suchard, M. A., Xie, D. & Rambaut, A. Bayesian phylogenetics with BEAUti and the BEAST 1.7. Mol Biol Evol. 29, 1969–1973, https://doi.org/10.1093/molbev/mss075 (2012).
72. Lanfear, R., Frandsen, P. B., Wright, A. M., Senfeld, T. & Calcott, B. PartitionFinder 2: New Methods for Selecting Partitioned Models of Evolution for Molecular and Morphological Phylogenetic Analyses. Mol Biol Evol. 34, 772–773, https://doi.org/10.1093/molbev/ msw260 (2017).
73. Rambaut, A., Drummond, A. J., Xie, D., Baele, G. & Suchard, M. A. Posterior Summarization in Bayesian Phylogenetics Using Tracer 1.7. Syst Biol. 67, 901–904, https://doi.org/10.1093/sysbio/syy032 (2018).
74. Reimer, P. J. et al. IntCal13 and marine13 radiocarbon age calibration curves 0–50,000 years cal BP. Radiocarbon 55, 1869–1887,
https://doi.org/10.2458/azu_js_rc.55.16947 (2013).
75. Bevan, A. & Crema, E. R. rcarbon: Methods for calibrating and analysing radiocarbon dates. R package version 1.2.0, https:// CRAN.R-project.org/package=rcarbon (2018).
76. Blant, M. et al. Le gisement à faune würmienne du Bärenloch (Préalpes fribourgeoises, Suisse). Bull. Soc. Frib. Sc. Nat. 99, 149–170 (2010).
77. Bocherens, H. Isotopic tracking of large carnivore palaeoecology in the mammoth steppe. Quaternary Science Reviews 117, 42–7,
Acknowledgements
We thank Thierry Tillet for providing bone material of U. s. ladinicus from Prélétang and Abagail Breidenstein for prove reading of the manuscript. Furthermore, we thank Pierre Pétrequin (Maison des Sciences de l’Homme et de l’Environnement, Besançon, France) and Hélène Grimaud (Musée de Montbéliard, France) for their help in the study of the archaeological material of Casamène cave (Besançon, France) as well as Sanja Alaburić (Department of Palaeontology, Natural History Museum, Belgrade, Serbia), Milan Paunović (Deptartment of Palaeontology, Natural History Museum, Belgrade, Serbia), Zoran Marković (Deptartment of Biological Collections, Natural History Museum, Belgrade, Serbia), and Martin Sabol (Department of Geology & Palaeontology, Comenius University, Bratislava, Slovakia) for providing archaeological material of Kovačevića, Vrelska and Prepoštská cave. As well as, we would thank the Ministère de la Culture, Sous-Direction de l’Archéologie, for their funding of the program of radiocarbon datings and DNA analysis for the site of Casamène. This work was supported by the University of Zurich’s University Research Priority Program “Evolution in Action: From Genomes to Ecosystems” (V.J.S., C.U., J.N.), the Mäxi Foundation Zurich (V.J.S.), and the Max Planck Society (J.K.). Field work investigations and radiocarbon dates to Buso doppio del Broion, Paina and Trene have been promoted and supported by the University of Ferrara (FAR 2016), the Veneto Region, the Mossano Municipality and several public and private institutions (Fondazione CariVerona).
Author Contributions
V.J.S. and H.B. conceived and designed the research. M.S., M.B., C.C., V.D., H.B., J.K., M.P., M.R., E.H-K., D.G.D., R.K., M.K., M.T.K., I.R., J.S., S.C.M., N.J.C. and G.T. provided samples and palaeontological context. J.G., E.R., S.P. and C.U. performed sampling, DNA extraction and library preparation of sequencing libraries. J.G., J.N. and M.M. performed aDNA bioinformatic and population genetic analysis. J.G., M.M., H.B. and V.J.S. wrote the manuscript with input from all authors. All authors reviewed the manuscript.
Additional Information
Supplementary information accompanies this paper at https://doi.org/10.1038/s41598-019-47073-z. Competing Interests: The authors declare no competing interests.
Publisher’s note: Springer Nature remains neutral with regard to jurisdictional claims in published maps and institutional affiliations.
Open Access This article is licensed under a Creative Commons Attribution 4.0 International License, which permits use, sharing, adaptation, distribution and reproduction in any medium or format, as long as you give appropriate credit to the original author(s) and the source, provide a link to the Cre-ative Commons license, and indicate if changes were made. The images or other third party material in this article are included in the article’s Creative Commons license, unless indicated otherwise in a credit line to the material. If material is not included in the article’s Creative Commons license and your intended use is not per-mitted by statutory regulation or exceeds the perper-mitted use, you will need to obtain permission directly from the copyright holder. To view a copy of this license, visit http://creativecommons.org/licenses/by/4.0/.