1
Dottorato di Ricerca in Scienze Economiche
PhD in Economics, Management and Statistics - XXXI cycle
Università di Catania – Università di Messina
ESSAYS IN TRANSPARENCY AND
LIABILITY IN THE HEALTHCARE
SECTOR
By: Paolo Lorenzo Ferrara
Supervisor: Prof. Calogero Guccio
3
Acknowledgements
I am sincerely grateful with my Professor and
Master Calogero Guccio for all the effort,
patience and help he has given to me, in the
writing of this thesis and in all my PhD course.
A special thanks to my family, my father
Rosario, my mother Angela, my sister Chiara
and my girlfriend Martina for all the support they
have given to me for all these years.
A great thanks to my thesis’ “co-authors”: prof.
Massimo Finocchiaro Castro, prof. Domenico
Lisi, prof. Carla Scaglioni.
Thanks to all the people who supported and
believed in me, my grandparents, my relatives,
and my friends, even the ones I can’t see but still
feel.
Thanks to be here, always.
Yours sincerely,
Paolo
4
Contents
Summary ... 7
Chapter 1
Is Transparency a Free Lunch? Evidence from the Italian Local Health Authorities 1. Introduction ... 152. Related literature ... 17
3. Measuring Transparency in the health sector: the approach of Composite Indicator of Transparency (CTI) ... 21
4. The role of transparency as a determinant of health expenditure ... 22
5. Setting the stage ... 24
6. The cost of being transparent for the Italian Local Health Authorities... 27
7. Conclusion ... 33
5
Chapter 2
Medical Malpractice Liability and Physicians’ Behaviour: Experimental Evidence
1. Introduction ... 41
2. Literature review ... 44
3. Theoretical framework and behavioral predictions... 49
4. Experimental design ... 54
5. Results ... 64
6. Conclusions ... 75
References ... 78
Appendix A : Instructions ... 83
Appendix B: “ Inside z-Tree “ ... 89
Chapter 3
Does medical malpractice liability matter for physicians’ behavior? An experimental evidence for mixed payment systems 1. Introduction ... 972. Literature background ... 99
3. Experimental design ... 106
4. Predictions and hypotheses ... 115
5. Empirical results... 116
6. Concluding remarks ... 119
References ... 120
Appendix A: Instructions ... 124
7
Summary
This thesis comprises three papers that represent three autonomous chapters. The linking "fil rouge" between the essays is the investigation of the issue of liability and transparency in the health care sector.
In the first chapter1, we evaluate the role of transparency in measuring the
performance of Local Health Authority (LHA) using the composite indicators prosed in literature and depict the relative geographical distribution in order to investigate whether transparency index matters on the performance for different expenditure functions at LHAs level. The health sector is considered to be one of the most exposed to the risk of corruption and therefore needs adequate levels of transparency. Healthcare is a particularly sensitive ground, where opportunistic behaviours germinate and can degenerate into corruption with several possible reasons behind:
• the magnitude of the expenditure
• the pervasiveness of information asymmetries • the unpredictability of demand
• the high specialization of the products purchased • the need for complex regulation systems
1 “Evaluating the role of transparency in measuring the performance of Local Health Authority” This chapter mainly refer to a joint research conducted with prof. Carla Scaglioni and prof. Calogero Guccio
8
The forms and intensity differ according to the overall level of integrity and are becoming increasingly worrying even in the most advanced countries. Corruption in the health sector has both economic effects, diverting resources from assistance programs and social effects, undermining people's trust in the healthcare system. In the last years, several studies have considered this issue in order to assess the magnitude, the determinants and the effect of corruption in the healthcare sector. Italy recently has implemented legislation on transparency (so-called Code of Transparency - Leg. decree n. 33/2013 ), extended also to the health sector.
It provides several (about 270) detailed transparency obligations to be published in a standardized format (Amministrazione trasparente), regarding different aspects such as: the organization of public organizations with respect to politico-administrative bodies and top public managers and officers, external consulting and collaboration, public procurement, management of properties and assets, timing of payments, provision of public services.
In our analysis, we follow a “top-down” approach which develops indicators from the legal and formal aspect. In particular, we use the indicator “Composite Transparency Index” (CTI) developed by Galli et. al (2017) in a study on the transparency in the main Italian municipalities. The indicators CTI uses the values attributed by OIVs to the items included in ANAC resolution n. 77/2013, according to a scale going from 0 to 3. It is composed by two sub-indicators “CTI-Integrity” and “CTI-Performance” which investigate the two different aspects. In particular, the “CTI-Integrity” consider items on income and asset disclosure and conflict of interest (on both politicians and top and senior public officials, while the “CTI-Performance” considers items on the management of public property, the timeliness of public payments, the quality of public services. At the end, the total CTI is constitute by the average of the two indicators. The information was collected for all the 143 LHAs.
The degree of transparency of Italian Local Health Authorities (LHAs) using the composite indicators prosed by Galli et al. (2017) depicts the usual geographical dichotomy between North and South, with Tuscany and Emilia Romagna aligned with the former macro area, while Lazio, Umbria and Marche with the latter.
9
Then we explore the relationship between transparency and expenditure at LHA level. Our results show a negative correlation between transparency and total expenditure whereas we find a significant positive correlation for the administrative expenditure.
The second chapter2 is devoted to exploring the role of medical malpractice liability and in physicians’ behaviour using an experimental approach. The effect of the payment system on the behaviour of the physician has been a very hot topic, intensely studied by a lot of researches all over the world in the last decades, even in a laboratory study. Also, the effect of the medical liability on the behavioural changes has been deeply investigates. Nonetheless, to the best of our knowledge, there are no papers still that have studied the effect of medical liability on the physician in a laboratory environment.
Considering these aspects and building on the results of Brosig-Koch et al. (2017), we investigate whether the introduction of the possibility for a physician of being sued has any effect on the effort he/she devotes to cure his/her patients.
This effect has been observed through the two different payment schemes: fee-for-service and capitation. Finally, we check whether different samples of participants in our experiment show the same behaviour, running sessions with randomly chosen students, medical students and post-graduate MDs.
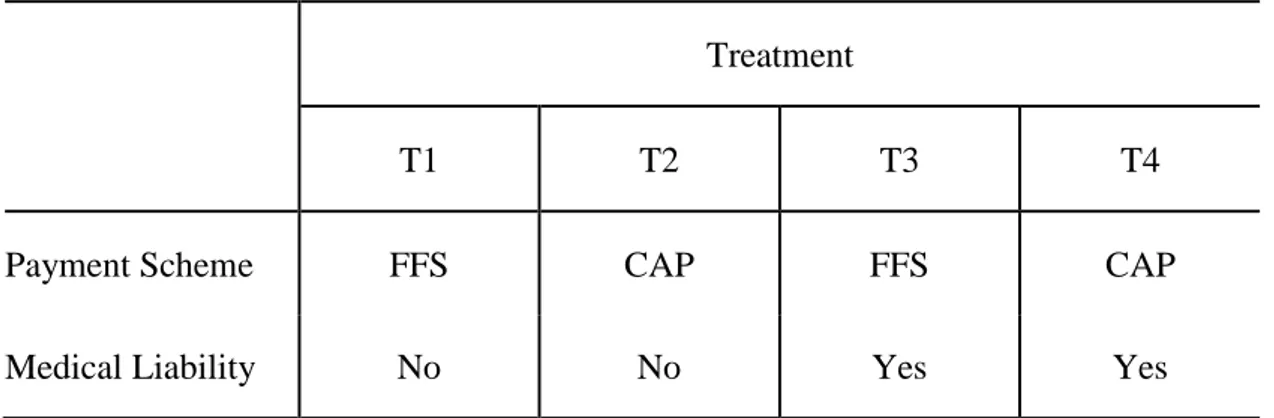
The experimental design is divided into four treatments differing in the payment system (fee-for-service and capitation) and in the presence of medical liability device. In each treatment, each participant plays the role of a physician who has to choose how many medical prescriptions (from zero to ten) to provide to his/her patients. Patients are divided according to the severity of disease (three levels) and gender (M/F).
The experiment was totally computer-based experiment and run with the z-Tree software. At the beginning of each treatment, subjects receive the instructions of
2 “Medical malpractice liability and physicians’ behavior: experimental evidence”. This chapter mainly refer to a joint research conducted with prof. Massimo Finocchiaro Castro, prof. Domenico Lisi and prof. Calogero Guccio
10
that treatment only and the relative payoff table. Moreover, before starting the treatment they have to solve a couple of simple numerical exercises in order to be sure they have understood how FFS/Capitation payment scheme works and how to compute their profits.
Each treatment lasts for six periods, representing six patients differing in terms of severity of disease and in gender for the three levels of severity. The sequence of patients has been randomly drawn at the beginning of the research, it changes in every treatment but stays the same for all the subjects playing the experiment. Regardless of the payment system, the quantity of medical services provided by physicians is higher when the risk of being sued for medical malpractice is at play.
The increase in the quantity of medical services induced by the risk of being sued for medical malpractice is higher in CAP than in FFS
While the increase in CAP brings closer to the efficient level of medical services, the increase in FFS pushes further away from the efficient level of medical services.
In the third Chapter3 of the thesis, we further explore the role of malpractice
liability using the experimental setting. In this Chapter, building on the seminal model of Ellis and McGuire (1986) and the experimental results of Brosig-Koch et al. (2017), we investigate whether the introduction of a mixed payment system and the possibility for a physician of being sued has any effect on the quantity of medical services provided to cure the patients. To do this, at first we compare the two main payment schemes fee-for-service and capitation with a perfectly balanced “fee-cap” mixed payment system. Then, we check if the presence of medical liability influences the optimal calibration of the mixed payment system. The experimental design is made up by two parts, with two different samples composed by different subjects. The first sample plays the experiment following
3 “Medical malpractice liability and mixed payment systems: experimental evidence on physicians’ behaviour”. Also this chapter mainly refer to a joint research with prof. Massimo Finocchiaro Castro, Domenico Lisi and prof. Calogero Guccio
11
the scheme Fee-for-service/Mixed and the second one with the scheme Capitation/Mixed. Each part is composed by four treatments differing in the payment system (fee/mixed, cap/mixed), as mentioned before, and in the presence of medical liability. In each treatment, each participant plays the role of a physician who has to choose only how many medical prescriptions (from zero to ten) to provide to his/her patients, which are divided according to the severity of disease (three levels-low, medium, high) and gender (M/F).
Each treatment lasts for six periods, in order to represent the six patients differing for severity of disease and gender. The sequence in which patients appears to subjects playing has been randomly drawn at the beginning of the research, it changes in every treatment but remains the same for all the experiment.
Even if there are no patients inside the lab, in order to make the effort decision more realistic subjects are made aware that the benefits awarded to patients through medical prescriptions are converted into euros and donated to a charity providing health care to children affected by spinal muscle atrophy (SMA). The experimental data give results in line with our behavioural hypothesis.
References
Galli, E., I. Rizzo and C. Scaglioni 2017 “Transparency-quality-of-institutions-and-performance-in-the-Italian-Municipalities”, ISEG/UTL – Technical University of Lisbon, Economics Department, WP10/2017/DE/UECE, ISBN/ISSN: 2183-1815
Brosig‐Koch, J., Hennig‐Schmidt, H., Kairies‐Schwarz, N., & Wiesen, D. (2017). The effects of introducing mixed payment systems for physicians: Experimental evidence. Health Economics, 26(2), 243-262.
Ellis, R. P., & McGuire, T. G. (1986). Provider behavior under prospective reimbursement: Cost sharing and supply. Journal of Health Economics, 5(2), 129-151.
Chapter 1
Is Transparency a Free Lunch? Evidence from the
Italian Local Health Authorities
4
4 In conducting this research, I am largely in debt with Calogero Guccio (University of
14
Abstract
Transparency and integrity of public bodies play a relevant role in their accountability and to prevent misbehaviours. In the last decades, a significant amount of empirical research has proposed several measures to capture transparency and to understand their determinants. In the paper, we evaluate empirically the role of transparency in the performance of Local Health Authority (LHA) in the year 2013. Using composite indicators recently proposed in literature and depicting the relative geographical distribution we investigate whether transparency index matters on the performance for different expenditure functions at LHAs level. Our results show a negative correlation between transparency and total expenditure whereas we find a significant positive correlation for the administrative expenditure.
JEL Classification: C92, H30, H41.
15
1. Introduction
Worldwide, the health sector is one of the areas that is extremely susceptible to corruption (European Commission, 2013; 2017). Several factors contribute to make health a particularly sensitive ground, where opportunistic behaviours germinate often degenerating into corruption (Vian 2008; Vian et al., 2010). The magnitude of the expenditure, the omnipresence of information asymmetries, the extent of the relationship with the private sector, the unpredictability and inelasticity of demand, the high specialization of the products purchased, the need for complex regulation systems are just some of these factors. Fraudulent and corruptive behaviours are all characterized by different forms of abuse of power positions for private purposes5. The mode and intensity of their diffusion differ according to the overall level of integrity present in the various countries and to the state of development of countries’ health care systems. Furthermore, they are becoming increasingly worrying even in the most advanced countries. The European Network against Fraud and Corruption in the Health Sector (EHFCN) estimates that in Europe around 6% of the health budget is absorbed by corruption (Sauter et al., 2017). The theme also deserves attention because corruption in the health sector has not only economic effects (in particular public finances), but also on the health of populations6 and undermines people's trust in the healthcare system7. For this reason, affirmation of legality and
5 The European Commission (2017) identified six typologies of corruption in the healthcare sector: bribery in medical service delivery; procurement corruption; improper marketing relations; misuse of (high)level positions; undue reimbursement claims; fraud and embezzlement of medicines and medical devices”.
6 It reduces access to services, especially among the most vulnerable; significantly shrinks overall health indicators and is associated with higher infant mortality
7 For an extensive review of the consequences of corruption in health care sector see Cavalieri et al. (2017).
16
integrity must be a priority commitment to public policy makers, especially at a time when institutions are perceived as far away from citizens’ everyday concerns. Unfortunately, all these malpractices are not easy to be detected, therefore healthcare sector needs adequate levels of transparency. The term “transparency” usually is considered a synonym of openness, democracy, reliability, efficiency and proximity do citizens (Dyrberg, 1997, 81), whereas “opacity” is directly associated with secrecy on information and corruption, that is hidden by nature. Thus, transparency is both one of the principal measures in the fight against corruption8 (Arrowsmith et al., 2000; Kaufmann and Bellver, 2005) and a key precondition for services improvement and productivity.
To this end, we apply a new composite indicator of transparency (CTI) and its two sub-indicators, CTI Integrity and CTI Performance, proposed by Galli et al., (2017) to assess the level of transparency of Italian Local Health Authorities in the year 2013. These indicators have the advantage to quantitatively describe the degree of transparency of public administrations as well as the two different aspects of the public activity’s transparency. Then, we investigate whether transparency matters on
the performance for different expenditure functions at LHAs level. As valuable as the impact of transparency could be, it is worth to note that it might not be a “free lunch”.
For this purpose, we built on results obtained by Di Novi et al., (2018) to estimate the determinants of the cost incurred by LHA in the year 2012 in four different
8 Empirical analysis supports that more information leads to a reduction in corruption (Rose-Ackerman, 2004, 316–322). Nonetheless, these outcomes are not sufficient to conclude that transparency always means lower corruption (Cordis & Warren, 2014; Grimmelikhuijsen, 2010; Peisakhin & Pinto, 2010, 262).
17
expenditure functions (i.e. total expenditure, administrative expenditure, the cost for purchasing goods, and the cost for buying non-healthcare-related services).
Our analysis confirms that transparency matters. However, fulfilling transparency obligation is costly and thus it is important to evaluate its effect on public administration performance. In this respect, the stability of rules and obligations and their consolidation not only would promote the effectiveness of transparency but also reduce the costs of its design and implementation.
The analysis develops as follows. Section 2 report a short literature review on the field. Section 3 presents the empirical strategy, illustrating the methodology employed to build the new indicator of transparency and the econometric model we employ to estimate the determinants of the cost incurred by LHA. The characteristics of the sample performance, the distribution of the transparency compliance across the different Italian LHAs and results of the estimation are provided in Section 4. Finally, Section 5 offers some concluding remarks.
2. Related literature
2.1 Corruption in the healthcare sector
A growing body of literature analyse efficiency and productivity in health care sector, but international empirical evidence on the role played by corruption in the healthcare sector is less investigated (Transparency International, 2017; Cavalieri et al., 2017). Only recently, some important evidence comes from some in-depth studies on the characteristics, causes, remedies and effects of illicit in various healthcare dimensions, which show how the opacity of budgets and control systems
18
and administrative confusion facilitate the emergence of interests illicit and collusion in the healthcare system. Cavalieri et al. (2017) show that, in Italy, the performance of the job contracts for healthcare infrastructures is significantly affected by ‘environmental’ corruption. Baldi and Vannoni (2017) stress the importance of
healthcare governance. They focus on the relationship between the grade of centralization (or decentralization) in public procurement of Italian Local Health Authorities (LHAs) and the auction prices of selected drugs for hospital usage during the period 2009-2012. The analysis let emerge that centralized and mixed procurers are statistically associated with lower prices respect to decentralized ones and more importantly that higher corruption and lower institutional quality strengthen the effects of centralization in terms of lower prices.
2.2 Measuring the performance of public health departments
Our paper is also related to the literature on the performance of Local Health Authorities and their determinants. Santerre, (1985) investigates the relationship between the institutional structure of public health departments and their performance. Bates and Santerre (2012) compare the spending levels of the local and regional demands for public health services, then examine if resources for public health services are more efficiently allocated to independent or to regional public health departments. According to their results, regionalization seems to increase spending on public health services, especially when serving a large population. Similar outcomes are provided by Mukherjee et al. (2010). Their analysis reveals that the more Local Health Departments (LHDs) are centralized and at the urban level, the less efficient they are at producing local public health services. This findings also
19
suggest that efficiency is higher for LHDs that produce a wider variety of services internally and rely more on internal funding. Gordon et al. (1997) identify the determinants of LHDs expenditures, emphasizing how local health department spending varies significantly across the jurisdictions even in case of similar size. The authors stress the need for effective strategies to analyse the efficiency of public health spending. A potential cost savings may be derived from the consolidation of local health authorities. This hypothesis is investigated by Bates and Santerre (2008) for LHDs in the USA. They show how better off municipalities are less likely to consolidate health departments. The consolidation process is impeded by population and income differences among municipalities. A similar approach, with a different outcome, to the determinants of Local Health Authorities (LHAs) expenditure and consolidation was recently proposed by Di Novi et. al (2018). The authors estimate the potential advantages from consolidation with specific reference to the Italian setting. Their main result is the presence of economies of scale with regard to a particular subset of the production costs of LHAs, i.e. administrative costs together with the purchasing costs of goods (such as drugs and medical devices) as well as non-healthcare-related services.
Noticeably, despite the numerous ongoing initiatives (see among others Mikkelsen-Lopez et al., 2011), to the best of our knowledge, no literature exists assessing the relationship between the degree of transparency and the performance achieved by the health authorities (or departments), running the governance of local healthcare systems.
20
Based on these, in the next Section, we first build a measure of transparency showing of how this approach could be applied to illuminate areas of governance weaknesses which are possibly addressable by specific interventions and policies.
21
3. Measuring Transparency in the health sector: the approach of Composite Indicator of Transparency (CTI)
In our analysis, we look at the degree of transparency in regard to the local governance of the healthcare sector focusing on the LHAs’ activities and departing
from the copious stream of literature on the transparency of costs, prices, quality, and effectiveness of medical services and products (among others Fung et al., 2008). As above mentioned, transparency refers to several attributes that make a specific administration more transparent. Practitioners and academics agree on considering
Integrity and Performance/Efficiency as key features to assess the degree of
transparency reached by a public organization. Galli et al., (2017) propose to measure them through two distinct indicators – respectively the CTI Integrity (CTIIn) and the CTI Performance (CTIMaEf). To this end, they operationalize the two dimensions selecting some of the obligations contained within the Italian “Code of Transparency - Leg. decree n. 33/2013”. Thus, CTI Integrity includes items such as income and asset disclosure and conflicts of interest (on both politicians and top and senior public officials); whereas CTI Performance consists of information about the management of public property, the timeliness of public services provision, the quality of public services. Finally, to offer a single measure of public transparency, they aggregate the previous indicators, according to a simple average, into the so-called Composite Transparency Indicator (CTI).
This ”top-down approach” provides a limited set of meaningful and robust indicators
that, in our opinion, are suitable also to appraise and measure the degree of transparency of the authorities running the governance of local healthcare systems and to drive policy choices. This belief is supported also by the fact that the Italian Legislator has extended the same obligation to the LHAs.
22
Therefore, we straightway follow the same methodology as in Galli et al. (2017), first building a dataset containing information about several aspects of LHAs’
activity and then derive the three indicators i.e the CTI, the CTIIn and the CTIMaEf. Each sub-indicator must be computed as an average of the set of the previously weighted and then normalized elementary indicators. The standardization method applied to elementary weighted indicators has to be that of so-called re-scaling. The data can be retrieved from official LHAs’ web pages or reports, making the methodology straightforwardly replicable in other contests.
To this extent, our analysis is, also, related to the little literature analyzing the effect of health care decentralization on several health outcomes (e.g., Jepsson and Okuonzi, 2000; Tang and Bloom, 2000; Bossert et al., 2003; Arreondo et al., 2005; Kolehmainen-Aitken, 2005; Saltman et al., 2007) along with the one focusing on the relationship between decentralization and health policies’ efficiency (e.g., Bordignon
and Turati, 2009; Piacenza and Turati, 2014; Francese et al., 2014).
4. The role of transparency as a determinant of health expenditure
As valuable as the impact of transparency could be, it is worth to note that it might not be a “free lunch”. To investigate whether transparency matters on the
performance for different expenditure functions at LHAs level, we propose to include the degree of transparency among the determinants of the cost incurred by LHAs. Following the results obtained by Di Novi et al., (2018), we propose to estimate four different expenditure functions (i.e. total expenditure, administrative expenditure, the cost for purchasing goods, and the cost for buying non-healthcare-related services).
23
Accordingly, the general specification of the determinants of different expenditure functions is expressed as follows:
𝑙𝑛𝐶𝑖 = 𝛼 + 𝛽1𝑙𝑛𝑃𝑂𝑃𝑖 + 𝛽2𝑙𝑛𝑃𝑂𝑃𝑖2+ ∑𝑗=1,𝑘𝛿𝑗𝑋𝑗+ 𝜀𝑖 [1]
where 𝐶𝑖 refers to the per capita expenditure in different functions incurred by the
i-th LHA, POP refers to i-the population in i-the i-i-th LHA, to control for potential scale
effects in the costs we include in [1] the POP square, finally and X is a set of other covariates at LHA level that are reported in Table 1.
Table 1 – Employed variables
Variable Description
Ci per capita expenditure in different functions incurred by the i-th LHA
POP population in the i-th LHA
POP2 controls for potential scale effects in the costs 𝐶𝑇𝐼𝑖ℎ transparency index both at LHAs and regional level X set of other covariates at LHAs level
24
5. Setting the stage
5.1 The sample: the Italian Local Health Authorities
The National Health System (Servizio Sanitario Nazionale, SSN) in Italy shows some interesting institutional characteristics. Since 1978, Italy relies on an SSN, which grants universal access to a uniform level of care all over the country. Over time, Italy has undergone a set of reforms inspired by the principles of regionalization, competition and managerialism. As a result, responsibilities for the financing and delivery of healthcare are now in charge of Regional governments, which administer, finance and organize healthcare according to the populations’ needs, though within the national regulatory framework. This organization pass through different structures. At first, we have Local Health Authorities (Aziende
Sanitarie Locali), a network of geographic and population-defined bodies, which are
independent public entities with their own budgets and management. They provide services for the patients and also directly run small public hospitals. Secondly, we have major public hospitals, which are granted the status of trusts with full managerial autonomy (Aziende Ospedaliere), and thirdly, we have accredited private providers.
We collected data from all the LHSs in order to compute our transparency index. In particular, the information were first-hand data collected for 143 LHAs. All the information used to compute the index were taken from the OIV (Organismo Interno
di Valutazione) grid 77/2013, which is available in every website of the Public
Administration in the “Transparent Administration” section9.
9 However, during the collecting activity we found wide heterogeneity in displaying the data among the different LHAs and a widespread incompleteness of information.
25
5.2 The degree of transparency across the Italian Local Health Authorities
The degree of transparency of Italian Local Health Authorities (LHAs) using the composite indicators prosed by Galli et al. (2017) are reported in Figures 1, 2 and 3. More specifically, Figures 1, 2 and 3 report, respectively, the geographical distribution of CTI Integrity, CTI Performance and CTI.
Figure 1 – CTI Integrity
Source: our elaboration on the data of the CTI index
less tra more
26
Figure 2 – CTI Performance
Source: our elaboration on the data of the CTI index
Figure 3 – CTI index
Source: our elaboration on the data of the CTI index
less
more
less
27
Depicts the usual geographical dichotomy between North and South, with Tuscany and Emilia Romagna aligned with the former macro area, while Lazio, Umbria and Marche with the latter. Basilicata represents an exception, but Potenza is not, as among the ten most transparent LHAs there are Oristano, Brindisi and Caltanissetta. CTI and CTIMaEf are almost aligned. Basilicata and FVG reach the highest level, while in terms of Integrity the best performer, besides Basilicata, is Liguria. Marche and Molise are located in lowest positions in the ranking. Nonetheless, we can notice that our results are in line with those presented by AGE.NA.S, despite the different approach followed in measuring LHAs’ transparency.
6. The cost of being transparent for the Italian Local Health Authorities
In this section, we empirically test the role of transparency for our sample of Italian LHAs. They seem particularly well-suited to test our predictions that transparency might not be a “free lunch” for the administrations. In fact, not only Italy exhibits
one of the most interesting initiatives in detailing the transparency obligation for the public administrations among the OECD countries but, because of the high decentralization, great variation exists across regions both in the regulation and in the delivery of services (e.g., Francese et al., 2014; Cavalieri et al., 2014). As far as the Italian National Health System (NHS) is concerned, most works have focused on the relationship between decentralization and the efficiency of health policies (e.g., Bordignon and Turati, 2009; Piacenza and Turati, 2014; Francese et al., 2014). This literature supports the idea that fiscal decentralization makes local governments more accountable and efficient.
28
Thus, in this Section, we carry out an empirical assessment of Italian LHAs using the data on cost collected by Di Novi et al., (2018) using information provided by Italian Ministry of Health (New Health Information System - NSIS). In particular, we considered the determinants of expenditure thanks to data provided by Di Novi et al., (2018) which include several information about expenditure and main characteristics of Italian LHAs for the year 2012. The following Table 2 provides some descriptive statistics of the variables.
Table 2 - Descriptive statistics of the sample
Source: our elaboration on data provided by Di Novi et al., (2018)
To investigate whether transparency index matter for the considered expenditure functions (i.e. total expenditure, administrative expenditure, the cost for purchasing
29
goods, and the cost for buying non-healthcare-related services) we first consider three possible levels of transparency and then we use a linear regression model. Considering the general specification of the determinants of the different expenditure function presented in the previous section, differently from Di Novi et al., (2018) we estimate the equation [1] for all LHA including those located in Special Statute regions (SSR). To control for the difference with Ordinary Statute regions we include in each estimate a dummy variable (d_SSR). Furthermore, to take into account that in the year 2013 the four LHAs in Umbria are merged in two LHAs, we aggregate the data for those LHA obtaining two virtual LHA. Finally, we estimated the equation [1] using a slightly different approach of those proposed by Di Novi et al., (2018) that is based on stepwise backward elimination technique (at 5% level of significance). We believe that this approach although based on statistical significance potentially exclude variables that in principle could be important to explain the expenditure variability at LHA level. Thus, as a first exploratory assessment, we perform a stepwise backward elimination technique with a lower level of significance (i.e. 10% level of significance) and include in each estimate the control for SSR.
Tables 3, 4, 5 and 6 report the estimates obtained for our four expenditure functions using OLS with robust standard errors and stepwise backward elimination at 10% level of significance. In each table, the analysis is conducted considering separately the two sub-indicators (CTIIn – CTIMaEf) and the general one (CTI), in order to test both for the specific components of the sub-indicators and for the main index.
30
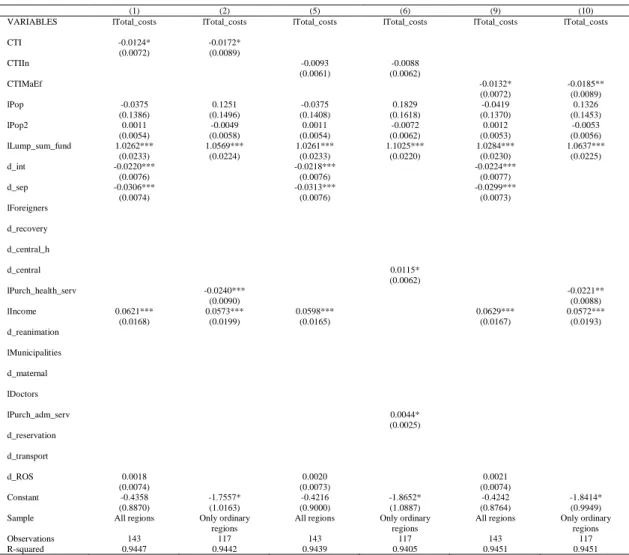
Table 3 – Total expenditure (per capita)
(1) (2) (5) (6) (9) (10)
VARIABLES lTotal_costs lTotal_costs lTotal_costs lTotal_costs lTotal_costs lTotal_costs
CTI -0.0124* -0.0172* (0.0072) (0.0089) CTIIn -0.0093 -0.0088 (0.0061) (0.0062) CTIMaEf -0.0132* -0.0185** (0.0072) (0.0089) lPop -0.0375 0.1251 -0.0375 0.1829 -0.0419 0.1326 (0.1386) (0.1496) (0.1408) (0.1618) (0.1370) (0.1453) lPop2 0.0011 -0.0049 0.0011 -0.0072 0.0012 -0.0053 (0.0054) (0.0058) (0.0054) (0.0062) (0.0053) (0.0056) lLump_sum_fund 1.0262*** 1.0569*** 1.0261*** 1.1025*** 1.0284*** 1.0637*** (0.0233) (0.0224) (0.0233) (0.0220) (0.0230) (0.0225) d_int -0.0220*** -0.0218*** -0.0224*** (0.0076) (0.0076) (0.0077) d_sep -0.0306*** -0.0313*** -0.0299*** (0.0074) (0.0076) (0.0073) lForeigners d_recovery d_central_h d_central 0.0115* (0.0062) lPurch_health_serv -0.0240*** -0.0221** (0.0090) (0.0088) lIncome 0.0621*** 0.0573*** 0.0598*** 0.0629*** 0.0572*** (0.0168) (0.0199) (0.0165) (0.0167) (0.0193) d_reanimation lMunicipalities d_maternal lDoctors lPurch_adm_serv 0.0044* (0.0025) d_reservation d_transport d_ROS 0.0018 0.0020 0.0021 (0.0074) (0.0073) (0.0074) Constant -0.4358 -1.7557* -0.4216 -1.8652* -0.4242 -1.8414* (0.8870) (1.0163) (0.9000) (1.0887) (0.8764) (0.9949)
Sample All regions Only ordinary
regions
All regions Only ordinary regions
All regions Only ordinary regions
Observations 143 117 143 117 143 117
R-squared 0.9447 0.9442 0.9439 0.9405 0.9451 0.9451
Source: our elaboration on CPI index and data provided by Di Novi et al., (2018).
31
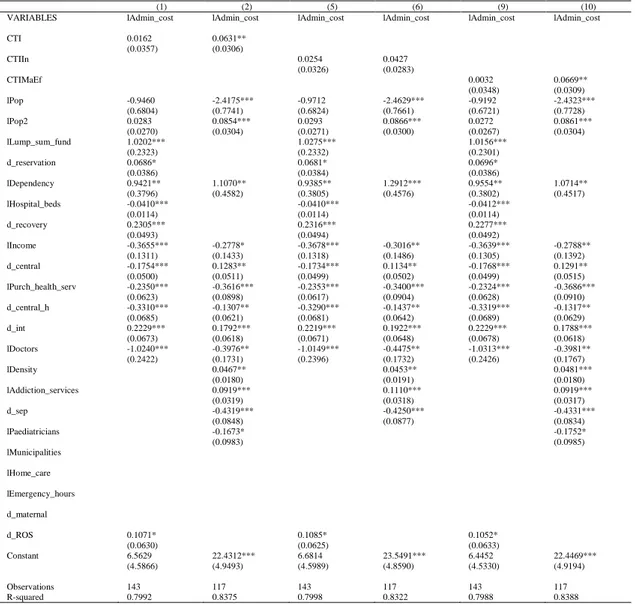
Table 4 – Administrative expenditure (per capita)
(1) (2) (5) (6) (9) (10)
VARIABLES lAdmin_cost lAdmin_cost lAdmin_cost lAdmin_cost lAdmin_cost lAdmin_cost
CTI 0.0162 0.0631** (0.0357) (0.0306) CTIIn 0.0254 0.0427 (0.0326) (0.0283) CTIMaEf 0.0032 0.0669** (0.0348) (0.0309) lPop -0.9460 -2.4175*** -0.9712 -2.4629*** -0.9192 -2.4323*** (0.6804) (0.7741) (0.6824) (0.7661) (0.6721) (0.7728) lPop2 0.0283 0.0854*** 0.0293 0.0866*** 0.0272 0.0861*** (0.0270) (0.0304) (0.0271) (0.0300) (0.0267) (0.0304) lLump_sum_fund 1.0202*** 1.0275*** 1.0156*** (0.2323) (0.2332) (0.2301) d_reservation 0.0686* 0.0681* 0.0696* (0.0386) (0.0384) (0.0386) lDependency 0.9421** 1.1070** 0.9385** 1.2912*** 0.9554** 1.0714** (0.3796) (0.4582) (0.3805) (0.4576) (0.3802) (0.4517) lHospital_beds -0.0410*** -0.0410*** -0.0412*** (0.0114) (0.0114) (0.0114) d_recovery 0.2305*** 0.2316*** 0.2277*** (0.0493) (0.0494) (0.0492) lIncome -0.3655*** -0.2778* -0.3678*** -0.3016** -0.3639*** -0.2788** (0.1311) (0.1433) (0.1318) (0.1486) (0.1305) (0.1392) d_central -0.1754*** 0.1283** -0.1734*** 0.1134** -0.1768*** 0.1291** (0.0500) (0.0511) (0.0499) (0.0502) (0.0499) (0.0515) lPurch_health_serv -0.2350*** -0.3616*** -0.2353*** -0.3400*** -0.2324*** -0.3686*** (0.0623) (0.0898) (0.0617) (0.0904) (0.0628) (0.0910) d_central_h -0.3310*** -0.1307** -0.3290*** -0.1437** -0.3319*** -0.1317** (0.0685) (0.0621) (0.0681) (0.0642) (0.0689) (0.0629) d_int 0.2229*** 0.1792*** 0.2219*** 0.1922*** 0.2229*** 0.1788*** (0.0673) (0.0618) (0.0671) (0.0648) (0.0678) (0.0618) lDoctors -1.0240*** -0.3976** -1.0149*** -0.4475** -1.0313*** -0.3981** (0.2422) (0.1731) (0.2396) (0.1732) (0.2426) (0.1767) lDensity 0.0467** 0.0453** 0.0481*** (0.0180) (0.0191) (0.0180) lAddiction_services 0.0919*** 0.1110*** 0.0919*** (0.0319) (0.0318) (0.0317) d_sep -0.4319*** -0.4250*** -0.4331*** (0.0848) (0.0877) (0.0834) lPaediatricians -0.1673* -0.1752* (0.0983) (0.0985) lMunicipalities lHome_care lEmergency_hours d_maternal d_ROS 0.1071* 0.1085* 0.1052* (0.0630) (0.0625) (0.0633) Constant 6.5629 22.4312*** 6.6814 23.5491*** 6.4452 22.4469*** (4.5866) (4.9493) (4.5989) (4.8590) (4.5330) (4.9194) Observations 143 117 143 117 143 117 R-squared 0.7992 0.8375 0.7998 0.8322 0.7988 0.8388
Source: our elaboration on CPI index and data provided by Di Novi et al., (2018).
32
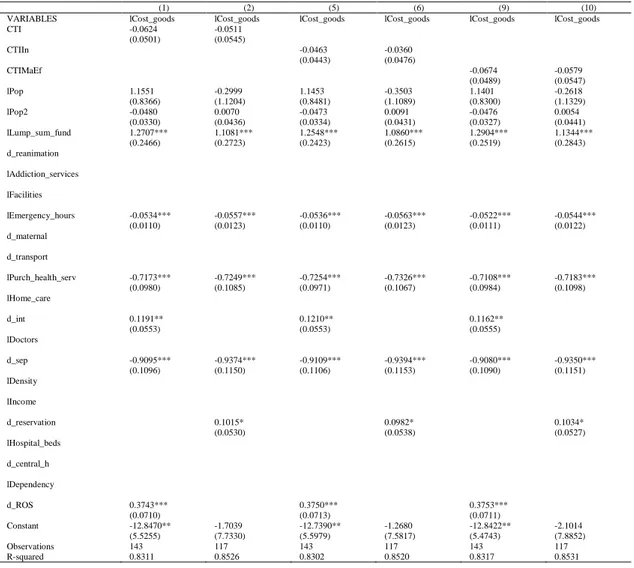
Table 5 – The cost of purchasing goods (per capita)
(1) (2) (5) (6) (9) (10)
VARIABLES lCost_goods lCost_goods lCost_goods lCost_goods lCost_goods lCost_goods
CTI -0.0624 -0.0511 (0.0501) (0.0545) CTIIn -0.0463 -0.0360 (0.0443) (0.0476) CTIMaEf -0.0674 -0.0579 (0.0489) (0.0547) lPop 1.1551 -0.2999 1.1453 -0.3503 1.1401 -0.2618 (0.8366) (1.1204) (0.8481) (1.1089) (0.8300) (1.1329) lPop2 -0.0480 0.0070 -0.0473 0.0091 -0.0476 0.0054 (0.0330) (0.0436) (0.0334) (0.0431) (0.0327) (0.0441) lLump_sum_fund 1.2707*** 1.1081*** 1.2548*** 1.0860*** 1.2904*** 1.1344*** (0.2466) (0.2723) (0.2423) (0.2615) (0.2519) (0.2843) d_reanimation lAddiction_services lFacilities lEmergency_hours -0.0534*** -0.0557*** -0.0536*** -0.0563*** -0.0522*** -0.0544*** (0.0110) (0.0123) (0.0110) (0.0123) (0.0111) (0.0122) d_maternal d_transport lPurch_health_serv -0.7173*** -0.7249*** -0.7254*** -0.7326*** -0.7108*** -0.7183*** (0.0980) (0.1085) (0.0971) (0.1067) (0.0984) (0.1098) lHome_care d_int 0.1191** 0.1210** 0.1162** (0.0553) (0.0553) (0.0555) lDoctors d_sep -0.9095*** -0.9374*** -0.9109*** -0.9394*** -0.9080*** -0.9350*** (0.1096) (0.1150) (0.1106) (0.1153) (0.1090) (0.1151) lDensity lIncome d_reservation 0.1015* 0.0982* 0.1034* (0.0530) (0.0538) (0.0527) lHospital_beds d_central_h lDependency d_ROS 0.3743*** 0.3750*** 0.3753*** (0.0710) (0.0713) (0.0711) Constant -12.8470** -1.7039 -12.7390** -1.2680 -12.8422** -2.1014 (5.5255) (7.7330) (5.5979) (7.5817) (5.4743) (7.8852) Observations 143 117 143 117 143 117 R-squared 0.8311 0.8526 0.8302 0.8520 0.8317 0.8531
Source: our elaboration on CPI index and data provided by Di Novi et al., (2018).
33
Table 6 - Cost for buying non-healthcare-related services (per capita)
(1) (2) (5) (6) (9) (10)
VARIABLES lNon_health_serv lNon_health_serv lNon_health_serv lNon_health_serv lNon_health_serv lNon_health_serv
CTI -0.0346 -0.0600 (0.0429) (0.0449) CTIIn -0.0461 -0.0638 (0.0389) (0.0407) CTIMaEf -0.0154 -0.0433 (0.0432) (0.0480) lPop 0.9366 -0.0663 0.9768 -0.0689 0.8867 -0.1082 (1.0010) (1.5109) (0.9847) (1.4768) (1.0127) (1.5524) lPop2 -0.0394 -0.0023 -0.0409 -0.0021 -0.0373 -0.0007 (0.0385) (0.0580) (0.0379) (0.0567) (0.0390) (0.0596) lLump_sum_fund 1.9045*** 2.5312*** 1.8924*** 2.5089*** 1.9095*** 2.5407*** (0.2642) (0.3289) (0.2635) (0.3324) (0.2630) (0.3210) d_semi_int -0.2825*** -0.3784*** -0.2803*** -0.3793*** -0.2871*** -0.3816*** (0.0710) (0.1001) (0.0705) (0.0969) (0.0711) (0.1029) d_int -0.1816* -0.3573** -0.1786* -0.3565** -0.1825* -0.3603** (0.0926) (0.1479) (0.0926) (0.1452) (0.0923) (0.1502) d_central 0.2104*** 0.2083*** 0.2128*** (0.0582) (0.0579) (0.0585) d_sep -1.7059*** -1.6617*** -1.7072*** -1.6651*** -1.7066*** -1.6596*** (0.2073) (0.1770) (0.2076) (0.1762) (0.2058) (0.1761) d_central_h 0.2709*** 0.1640** 0.2680*** 0.1619** 0.2722*** 0.1662** (0.0853) (0.0755) (0.0856) (0.0759) (0.0851) (0.0749) d_recovery -0.3566*** -0.2200*** -0.3596*** -0.2213*** -0.3510*** -0.2154*** (0.0529) (0.0542) (0.0511) (0.0527) (0.0549) (0.0562) lPurch_health_serv -0.6064*** -0.6379*** -0.6039*** -0.6405*** -0.6134*** -0.6399*** (0.0863) (0.1332) (0.0834) (0.1294) (0.0892) (0.1376) lPurch_adm_serv 0.0597*** 0.0567*** 0.0604*** 0.0577*** 0.0584*** 0.0555*** (0.0209) (0.0211) (0.0209) (0.0211) (0.0210) (0.0209) lDoctors -0.9626** -0.9665** -0.9457** (0.3842) (0.3902) (0.3769) lPaediatricians 0.3779*** 0.3756*** 0.3773*** (0.1266) (0.1249) (0.1284) lDependency lForeigners lIncome d_ROS 0.3646*** 0.3628*** 0.3683*** (0.0932) (0.0923) (0.0936) Constant -15.9543*** -12.8354 -16.1108*** -12.6733 -15.7242*** -12.6505 (5.8541) (8.8649) (5.7813) (8.6914) (5.9252) (9.1659) Observations 143 117 143 117 143 117 R-squared 0.8997 0.9178 0.9001 0.9181 0.8994 0.9173
Source: our elaboration on CPI index and data provided by Di Novi et al., (2018).
Notes: robust standard errors in parentheses. *** p<0.01, ** p<0.05, * p<0.1
7. Conclusion
This paper studied the relevance of transparency in the public sector and in particular it measures a transparency index for the Italian Local Health Authorities. Moreover, we put in relation transparency with four cost functions (total expenditure, administrative expenditure, the cost for purchasing goods, and the cost for buying non-healthcare-related services) for the Italian LHA in 2012 looking at the role played by transparency
34
As we can see from the results, transparency index matters on the performance and it is costly.
Our results show that for what concerns the total expenditure (per capita) CTIs indicators present the expected negative sign which means that more transparency implies less total costs for the administration. CTI and CTIMaEf are both significant but CTIIn is not. Moreover, we find no significant difference between ORD and SSR For the Administrative expenditure (per capita) we see ambiguity for the expectation of the sign of transparency on the administrative costs considering that both directions are quite reasonable, meaning that more transparency implies more administrative and bureaucracy costs for the administration. We find a positive and, for the sub-sample of LHAs in ORD, significant impact. In fact, we find a significant difference between ORD and SSR.
The cost of purchasing goods (per capita) is with the expected negative sign but not significant even if there is a significant difference between ORD and SSR.
For the last cost function, we find that the cost of buying non-healthcare-related services (per capita) have the expected negative sign but not significant. Instead, there is a significant difference between ORD and SSR
However, for the sake of our analysis, we must take in consideration the wide heterogeneity in displaying the data among the different LHAs, some problems related to the incompleteness of information and, last but not least, the high grade of LHA managers’ discretionally.
35
References
ANAC, (2015) Aggiornamento 2015 al Piano Nazionale Anticorruzione,
Determinazione n.12 del 28 ottobre 2015
http://www.anticorruzione.it/portal/public/classic/AttivitaAutorita/AttiDellAu torita/_Atto?ca=6314
Arreondo A., Orozco E. & De Icaza E. (2005) Evidences on weaknesses and strengths from health financing after decentralization: lessons from Latin American countries. International Journal of Health Planning and
Management, 20 (2): 181-204
Arrowsmith, Inarelli and Wallace. (2000). Regulating public procurement. Kluwer Law International
Baldi, S., & Vannoni, D. (2017). The impact of centralization on pharmaceutical procurement prices: the role of institutional quality and corruption. Regional
Studies, 51(3), 426-438.
Bates L.J. & Santerre R.E. (2008), The demand for local public health: do unified and independent public health departments spend differently. Medical Care, 46, pp. 590-596
Bates, L. J., & Santerre, R. E. (2012). Do health insurers possess monopsony power in the hospital services industry?. International journal of health care finance
and economics, 8(1), 1.
Bordignon, M., & Turati, G. (2009). Bailing out expectations and public health expenditure. Journal of Health Economics, 28(2), 305-321.
Bossert, T.J., Larrañaga O., Giedion Ú., Arbelaez J.J, Bowser, D.M. (2003) Decentralization and equity of resource allocation: evidence from Colombia and Chile. Bulletin of the World Health Organization, 83 (1): 95-100
Cavalieri et al. (2014) Financial incentives and inappropriateness in health care: Evidence from Italian cesarean sections. FinanzArchiv
Cavalieri, M. C. Guccio & Rizzo I. (2017) On the role of environmental corruption in healthcare infrastructures: An empirical assessment for Italy using DEA with truncated regression approach, Health Policy 121 515–524
Cordis A.S., & Warren P.L. (2014) Sunshine as disinfectant: The effect of state Freedom of Information Act laws on public corruption. Journal of Public
36
Di Novi, C., Rizzi, D., & Zanette, M. (2018). Scale Effects and Expected Savings from Consolidation Policies of Italian Local Healthcare Authorities. Applied
health economics and health policy, 16(1), 107-122.
Dyrberg T. (1997), The circular structure of politics identity and community, Verso, London.
European Commission (2013). Study on corruption in the healthcare sector. Bruxelles: EC;. Available at: http://ec.europa.eu/dgs/home-affairs/what-is-new/news/news/docs/20131219 study on corruption in the healthcare sector en.pdf.
European Commission (2017). Updated Study on Corruption in the Healthcare
Sector. Available at:
https://ec.europa.eu/home-affairs/sites/homeaffairs/files/20170928_study_on_healthcare_corruption_en. pdf
Francese M., Piacenza M., Romanelli M. & Turati G. (2014) Understanding Inappropriateness in Health Spending: The Role of Regional Policies and Institutions in Caesarean Deliveries. Regional Science and Urban Economics, 49: 262–277.
Fung CH, Lim YW, Mattke S, Damberg C. & Shekelle PG. (2008) Systematic review: The evidence that publishing patient care performance data improves quality of care. Annals of Internal Medicine: 148(2):111–123
Galli, E., I. Rizzo & C. Scaglioni (2017) “Transparency-quality-of-institutions-and-performance-in-the-Italian-Municipalities”, ISEG/UTL – Technical University of Lisbon, Economics Department, WP10/2017/DE/UECE, ISBN/ISSN: 2183-1815
Gordon, R. L., Gerzoff, R. B., & Richards, T. B. (1997). Determinants of US local health department expenditures, 1992 through 1993. American Journal of
Public Health, 87(1), 91-95.
Grimmelikhuijsen S. (2010) Transparency of public decision-making: Towards trust in local government?. Policy and Internet, 2 (1), pp. 5-35
Jepsson A. & Okuonzi S.A. (2000) Vertical or holistic decentralization of the health sector? Experiences from Zambia and Uganda. International Journal of
37
Kaufmann D. & Bellver A. (2005). Transparenting transparency: Initial empirics and policy applications. mimeo
Kolehmainen-Aitken, R.L. (2005) Decentralization's impact on the health workforce: Perspectives of managers, workers and national leaders. Human Resources for
Health, 2 (5)
Mikkelsen-Lopez, I., K. Wyss & de Savigny, D. (2011), “An approach to addressing governance from a health system framework perspective”, BMC International
Health and Human Rights, 11:13
Mukherjee, K., Santerre, R. E., & Zhang, N. J. (2010). Explaining the efficiency of local health departments in the US: an exploratory analysis. Health care
management science, 13(4), 378-387.
OECD, 2015, Health at glance 2015, Paris. http://www.oecd-ilibrary.org/social-issues-migration-health/healthat-a-glance-2015/summary/italian_a9d3a400-it 8
Peisakhin, L., & Pinto, P. (2010). Is transparency an effective anti‐corruption strategy? Evidence from a field experiment in India. Regulation &
Governance, 4(3), 261-280.
Piacenza M. & Turati G. (2014) Does Fiscal Discipline towards Sub-national Governments Affect Citizens’ Well-being? Evidence on Health. Health
Economics, 23(2): 199-224.
Rose-Ackerman S. (2004) Governance and corruption, in B. Lomborg (Ed.), Global crises, global solutions, Cambridge University Press, Cambridge
Saltman R.B., Bankauskaite V. & Vrangbæk K. (eds.) (2007) Decentralization in health care, McGraw-Hill: Maidenhead.
Santerre, R. E. (1985). Spatial differences in the demands for local public goods. Land Economics, 61(2), 119-128.
Sauter, W., Mikkers, M., Vincke, P., & Boertjens, J. (2017). Healthcare fraud, corruption and waste in Europe: National and academic perspectives.
Tang S. & Bloom G. (2000) Decentralizing rural health services: a case study in China. International Journal of Health Planning and Management, 15 (3), 189-200
Transparency International, 2017, Global Corruption Report 2017. Corruption and Health, TI, London. www.transparency.org
38
Vian, T. (2008). Review of corruption in the health sector: theory, methods and interventions, Health Policy and Planning, 23(2), 8394.
Vian, T., Sayedoff, W. & Mathisen, H. (2010) Anticorruption in the Health Sector: Strategies for Transparency and Accountability, Kumarian Press, West Hartford, CT (USA).
39
Chapter 2
Medical Malpractice Liability and Physicians’
Behavior: Experimental Evidence
10Massimo Finocchiaro Castroa,c,d, Paolo Ferrarab,c, Calogero Gucciob,c,d, and Domenico Lisib,c
aDepartment of Law and Economics, Mediterranean University of Reggio Calabria (Italy) bDepartment of Economics and Business, University of Catania (Italy)
cHealth Econometrics and Data Group, University of York (UK) dInstitute for Corruption Studies at the Illinois State University (USA)
10 This paper is an improved version of the working paper: Finocchiaro Castro Massimo, Paolo
Ferrara, Calogero Guccio, and Domenico Lisi. Medical Malpractice Liability and Physicians’
Behavior: Experimental Evidence. No. 18/11. HEDG, c/o Department of Economics, University of
40
Abstract
Medical liability has been suspected of increasing health expenditure insofar as it induces the practice of defensive medicine. Despite the large evidence on the role of medical malpractice liability, the identification of its causal effect on physicians’ treatment decisions is a difficult task. In this paper, we study for the first time in a controlled laboratory setting the effect of introducing the risk of being sued for medical malpractice on the provision of physicians’ medical services. Our behavioural data show that introducing malpractice liability pressure does lead physicians to choose a higher amount of medical services, regardless of the physicians’ payment system. However, we also find that the payment system in which malpractice liability is implemented makes the difference under the societal perspective, with relevant implications for health policy.
JEL Classification: I12; K13; C91.
Keywords: medical liability; defensive medicine; payment systems; physicians’ behaviour; laboratory experiment.
41
1. Introduction
In the last decades, there has been a widespread concern about the growth of health expenditure in many OECD countries. While health expenditure as a share of GDP has remained stable and in line with the GDP growth in the years after the economic crisis, previously health spending outpaced economic growth in several healthcare systems (e.g., OECD, 2015). In this debate, medical liability systems are usually deemed a factor that can contribute to a high expenditure insofar as they induce the practice of defensive medicine, namely a physicians’ intentional overuse of (not cost
effective) healthcare services to reduce their liability risk (e.g., Mello et al., 2010). As argued by Kessler (2011), although the administrative cost of medical liability system represents a small share of total health spending, the additional costs induced by the practice of defensive medicine are likely to be far greater. For the US, Mello et al. (2010) estimate that medical liability system costs represent the 2.4% of total health spending.
Several empirical studies have estimated the effect of malpractice liability pressure on physicians’ behaviour and patient health outcomes, reporting evidence of
defensive medicine (Kessler and McClellan, 1996; Dubay et al., 1999; Baicker et al., 2007; Fenn et al., 2007; Avrahm and Schanzenbach, 2015). Despite this large evidence on the role of medical liability, the identification of its causal effect on physicians’ treatment decisions is a difficult task, due to the possible presence of
unobserved factors that generate the variation in treatment decisions and outcomes of care (e.g., patients’ risk profile), and are potentially correlated with measures of
42
In this paper, we study for the first time in a controlled laboratory setting, to the best of our knowledge, the effect of introducing the risk of being sued for medical malpractice on the provision of physicians’ medical services. In our experimental sessions, subjects (i.e. students) choose in the role of physicians how many medical services to provide for heterogeneous patients and, most importantly, under different scenarios. We include both medical and non-medical students, as previous experimental evidence reports that subjects with a medical background are more patient-oriented than others (Hennig-Schmidt and Wiesen, 2014; Brosig-Koch et al., 2016). The quantity of medical services determines the physician’s profit, the patient’s health benefit and, when medical liability is at play, the ex-ante probability
of being sued for medical malpractice. The decision-making in the experiment is incentivized by financial rewards, as all subjects at the end of each session get a monetary payment commensurate with their own payoff, which depends however on the ex-post event of being sued or not. On the other hand, real patients’ health outside the lab is affected, as the monetary equivalent of the patients’ health benefit resulting from subjects’ behaviour is transferred to a charity (Famiglie SMA) caring for
children affected by spinal muscle atrophy (Hennig-Schmidt et al., 2011; Brosig-Koch et al., 2017).
We implement exogenous variations in the presence of medical malpractice liability and the expected probability of being sued, while keeping all other variables (e.g., patients’ severity) constant. Therefore, we exploit the within-subject variation
in the provision of medical services to infer the causal effect of malpractice liability on physicians’ behaviour. Furthermore, motivated by a simple theoretical framework, we analyze the impact of malpractice liability under different physicians’
43
us to discuss the interplay between medical malpractice liability and payment systems.
Our behavioural data show that introducing ceteris paribus variation in malpractice liability pressure does lead physicians to choose a higher amount of medical services for their patients, regardless of the patients’ severity and the physicians’ payment system. Under the societal perspective, however, we find that
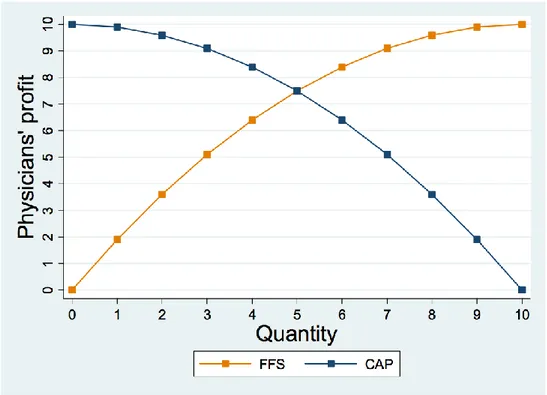
the payment system in which medical malpractice liability is implemented makes the difference. Specifically, as FFS embeds an incentive to provide too many services, introducing and/or intensifying medical liability pressure has the effect of exacerbating overprovision and, thus, reduces social welfare. Conversely, as physicians in CAP are incentivized to provide too few services, the increase in the amount of medical services induced by the fear of litigation helps to counterbalance the financial incentive to under-treat patients and, thus, improves social welfare. In this perspective, it is not surprising that the debate on medical liability systems is especially heated in the US where physicians are mainly paid by FFS.
Finally, we also find that medical students respond stronger to the introduction of malpractice liability pressure as compared to non-medical students. This result would seem to suggest that subjects with a medical background are more sensitive than non-medical subjects about the risk of being sued for medical malpractice.
This study complements the previous empirical research on the effect of liability pressure on physicians’ behaviour by providing experimental evidence,
which is indeed important in this context given the difficulty to infer the causal effect of malpractice liability from empirical works. Moreover, our analysis clearly highlights that the effect of medical malpractice liability is best analyzed by
44
considering the physicians’ payment system and the associated financial incentives at
play. In particular, our results suggest that, while in healthcare systems where physicians are paid by FFS tort reforms mitigating liability might reduce health expenditure without affecting patients’ health outcomes, in healthcare systems where
physicians are paid by CAP mitigating liability might make things worse.
The rest of the paper is organized as follows. Section 2 reviews the related literature. In Section 3, we derive behavioral predictions from a simple theoretical framework of physicians’ behavior. Section 4 describes our experimental design and
procedure. In Section 5, we discuss the results of our experiments. Section 6 concludes the study.
2. Literature review
Our study contributes and integrates three strands of literature. The first concerns the effect of medical liability pressure on physicians’ behaviour and, as a result, patients’
health outcomes. The second relates to the financial incentives given by the different payment systems and the impact on physicians’ behaviour. Finally, our study
integrates the growing literature that employs the experimental approach to study health-related behaviours. We briefly discuss these strands of literature in turn.
2.1 Medical liability and physicians’ behaviour
There is widespread economic literature studying the effect of liability pressure on physicians’ behaviour. The basic premise is that physicians may practice defensive
medicine, that is provide low-benefit (or not cost effective) diagnostic tests, procedures and treatments as liability shield against malpractice litigation. Danzon (2000) provides an extensive discussion on the economics of medical liability.
45
Several empirical contributions have studied the relationship between medical liability pressure and treatments selection. Extant literature focuses largely on obstetrics where physicians face significant liability pressure, finding mixed evidence on defensive medicine. In this respect, the conventional wisdom is that physicians choose cesarean sections (instead of natural deliveries) more frequently to reduce the risk of litigation, and this leads to higher costs for the healthcare system.
Dubay et al. (1999) use state liability law reforms as a source of variation in liability pressure to study the effect on the use of c-sections, concluding that physicians practice defensive medicine in obstetrics, especially for mothers of lower socioeconomic status. Esposto (2012) also finds a lower c-section rate in states in the US where tort reforms lowered the probability of medical malpractice suit. Conversely, Currie and MacLeod (2008) find that caps on non-economic damages increase the use of c-sections, although they reduce liability pressure. In a similar vein, Amaral-Garcia et al. (2015) find that an increase in medical malpractice pressure, given by an experience-rated insurance system in Italian hospitals, is associated with a decrease in the use of c-sections. A reconciling stance is provided by Shurtz (2014). He studies the effect of a tort reform that lowered the providers’
liability risk in Texas considering also the type of financial incentives at play and, consistent with the theoretical framework, he finds that the effect of malpractice law is the sum of offsetting responses associated with other financial incentives.
Heart disease is also a branch where physicians face significant liability pressure and, thus, may practice defensive medicine. Kessler and McClellan (1996) study the impact of tort reforms that limit liability on medical costs and outcomes for a population of elderly Medicare patients with serious cardiac illness, finding
46
evidence of defensive medical practices. Using similar data on Medicare heart patients, Kessler and McClellan (2002) report that increases in malpractice pressure have more significant impact on diagnostic rather than therapeutic decisions. Avrahm and Schanzenbach (2015) find that caps on non-economic damage reduce treatment intensity of heart attack patients without affecting mortality rates.
Looking at a broader population of patients, Baicker et al. (2007) report that higher malpractice premiums are associated with higher Medicare expenditures especially for imaging services that are deemed to be driven by fear of malpractice, with no effect in aggregate mortality rates. Similarly, Fenn et al. (2007) find that UK hospitals facing higher expected liability costs use diagnostic imaging procedures more frequently. Finally, Studdert et al. (2005) survey directly physicians about the role of liability systems, reporting that 93% of responding physicians practiced defensive medicine. More comprehensive reviews of the literature on the effects of malpractice systems are provided by Kessler (2011) and Bertoli and Grembi (2018).
2.2 Payment systems and physicians’ behaviour
In their seminal study, Ellis and McGuire (1986) develop a theoretical model in which physicians choose the level of services to be provided to their patients and show that, when they act as imperfect agents, physicians’ choice of care is strongly
affected by payment systems, potentially leading to non-optimal service provision. Following this influential study, several papers have analyzed the effects of different payment systems on physicians’ behaviour under a variety of circumstances regarding asymmetric information and physicians’ altruism (e.g., Ellis and McGuire,
1990; Chalkley and Malcomson, 1998; Choné and Ma, 2011; Makris and Siciliani, 2013). Among these, Allard et al. (2011) study the treating-referring trade-off for
47
general practitioners under three common payment schemes, namely fee-for-service, capitation and fundholding. Overall, the main result from this theoretical literature is that under capitation physicians are expected to undertreat and refer their patients, while under fee-for-service they are expected to overtreat their patients.
Empirical findings, by and large, confirm this prediction. Gaynor and Gertler (1995) study medical group practices in the US and find that compensation arrangements with greater degrees of revenue sharing, such as capitation, significantly reduce physicians’ effort. Sørensen and Grytten (2003) report that
Norwegian primary care physicians with a fee-for-service contract produce a higher number of consultations and other medical services than physicians with a fixed salary. Similarly, Devlin and Sarma (2008) find that Canadian family physicians under fee-for-service conduct more patient visits relative to other types of payment schemes. More generally, there is a large literature showing that healthcare providers do respond to financial incentives (e.g., Gruber et al., 1999; Croxson et al., 2001; Cavalieri et al., 2014).
2.3 Experimental health economics
Surprisingly, health economic issues have been studied through the lens of experimental economics only in recent years. In particular, a growing experimental literature has been devoted to investigating how different payment structures affect medical service provision.11 In their pioneering work, Hennig-Schmidt et al. (2011) study the effects of FFS and CAP under controlled laboratory conditions and find
11 Although we focus on experimental studies looking at providers’ payment systems, in the recent years a number of laboratory experiments have been carried out to analyze other health-related issues, such as health care finance model (Buckley et al., 2012) and the impact of professional norms (Kesternich et al., 2015).