POLITECNICO DI MILANO
Facoltà di Ingegneria Industriale
Laurea Specialistica in Ingegneria Meccanica
“Computer-Supported Modeling
Techniques to Analyze Goal Interrelations
within
Strategic Product Planning Systems”
Relatore: Prof. Gaetano Cascini
Correlatore: Dipl. Ing Clemens Hepperle
Simon Eichiner - 707363
Technische Universität München
Diplomarbeit
Nr. 1212
Computer-Supported Modeling
Tech-niques to Analyze Goal Interrelations
within Strategic Product Planning Systems
Simon Eichiner
Ich versichere, dass ich die Arbeit selbständig verfasst und keine anderen als die angege-benen Quellen und Hilfsmittel benutzt habe.
PRODUKTENTWICKLUNG
Technische Universität München
o. Prof. Dr.-Ing. Udo Lindemann
Diplomarbeit
Nr. 1212
für Herrn Simon Eichiner
Matrikel-Nr.: 2714886
Thema: Computer-Supported Modeling Techniques to Analyze Goal
Interre-lations within Strategic Product Planning Systems
Initial situation:
Manufacturing companies face the challenge of enhancing their ability and productivity in inno-vating products due to an increasingly competitive environment which is characterised by rapid-ly changing technologies and dynamic market needs. In this context frontloading an integrated lifecycle understanding to the early stages of planning future products distinguishes itself as a promising approach. The ability to comprehend interrelations among and in-between future product and process potentials and demands increases the transparency of planned goods within corresponding innovation processes. This transparency allows anticipating possible goal con-flicts and thus averts preventable changes along the future lifecycle. In consequence, companies avoid unnecessarily provoked lifecycle costs, which grow exponentially the later unintended changes are made within the lifecycle.
In this context, a detailed concept to analyse and elaborate on interrelations among anticipated demands and potentials along the whole lifecycle has been developed within the collaborative research center SFB 768 “Managing cycles in innovation processes”. This concept, consisting of a framework for information flows and a method to handle this information in respect to analyse goal interrelation, needs to be expanded, both considering to embed the approach within plan-ning processes and to implement these within respective computer supported tools.
Therefore, work carried in this thesis should primarily focus the conceptualization of computer-based tools for modeling interrelations within the context of analyzing goal interrelations. The currently existing approach should be extended to allow the analysis of multiple planning hori-zons and multiple scenarios for these planning horihori-zons as well as corresponding qualitative and fuzzy information. Furthermore, the approach should consist of features to handle the update of respective models comfortably.
Taks and approach:
Elaborating on research questions:
– Dealing with current status of approach to analyze goal interrelations developed with-in the SFB 768 „Managwith-ing cycles with-in with-innovation processes“
– Detailed presentation of research questions
Analysis of further dimensions to be considered within approach by extending perspective on multiple time horizons and multiple scenarios
Requirements analysis for developing concept of computer-supported modeling techniques – based on analysis of current advantages and disadvantages of
existing modeling techniques
– based on updated approach for analyzing goal interrelations – under consideration of possible updates of modeled elements
Elaboration of formalized framework for computer-supported modeling of goal interrela-tions based on detected requirements
Prototypic implementation of concept – using existing modeling techniques
– providing insights into further development possibilities
Embedding concept for computer-supported modeling techniques for the analysis of goal interrelations within the product planning process
Validation of results based on an appropriate, industry-relevant example.
Documentation of procedure and results in this thesis; reflection of results and presentation of future steps.
Die Arbeit bleibt Eigentum des Lehrstuhls.
betr. Assistent: Clemens Hepperle
Partner in Industrie/ Forschung:
ausgegeben am: 15.05.2011
abgegeben am:
Computer-Supported Modeling Techniques to Analyze Goal Interrelations
within Strategic Product Planning Systems
1 Introduction ... 3
1.1 Motivation ... 3
1.2 Goals and Objectives ... 3
1.3 Structures ... 5
2 State of the Art ... 7
2.1 Related Work ... 7
2.1.1 Strategic Product Planning ... 7
2.1.2 Innovation and Innovation Management... 8
2.1.3 Product Lifecycle and Product Lifecycle Management ... 10
2.1.4 Complexity and Complexity Management ... 13
2.2 Approach for the Analysis of Goal Interrelations ... 15
2.2.1 Aims Concerning the Approach ... 15
2.2.2 Considered Elements within the Approach ... 16
2.2.3 Context Analysis ... 18
2.2.4 Graph-Based Approach for Identifying Goal Interrelations ... 19
2.2.5 Lifecycle-Oriented Goal Interrelations ... 22
2.3 Related Approaches ... 23
2.3.1 Fundamental Principles in Product Design ... 23
2.3.2 Applied Methods in Product Design ... 27
2.3.3 Usage of Models in Product Design ... 30
2.3.4 Computer-Supported Modeling Techniques ... 33
3 Requirements for Computer-Supported Goal Interrelation Analysis ... 42
3.1 Requirements for a Goal Interrelation Analysis ... 42
3.2 Requirements for an Implementation of the content ... 43
3.3 Requirements for a Software Implementation ... 45
4 Analysis of Computer-Supported Modeling Techniques ... 49
4.1 Conditions for the Analysis ... 49
4.1.1 Proceeding of the Analysis ... 49
4.2.1 Multiple-Domain Matrix ... 53
4.2.2 Graph Grammar... 60
4.2.3 Relational Databases ... 66
4.2.4 Semantic Web ... 75
4.3 Evaluation of the Analysis ... 82
5 Framework for a Computer-Supported Goal Interrelations Analysis ... 85
5.1 Enhancement of the Approach for Goal Interrelation Analysis ... 85
5.2 Goal Interrelation Analysis System ... 88
5.3 Goal Interrelation Analysis Software ... 90
6 Conceptual Implementation of Computer-Supported Goal Interrelation Analysis ... 94
6.1 Example for Lifecycle Oriented Product Planning... 94
6.1.1 Strategic Product Planning of TUfast ... 94
6.1.2 Graphical Representation of TUfast Goal Interrelation Analysis ... 96
6.2 Example for a Goal Interrelation Analysis Supporting Software Tool ... 106
6.2.1 General Workflow ... 107
6.2.2 Data Acquisition ... 108
6.2.3 Visualization... 113
7 Conclusions and Outlook ... 116
7.1 Conclusions ... 116
7.2 Outlook ... 117
8 List of Abbreviations ... 119
9 List of Figures ... 120
1
Introduction
1.1 Motivation
Since competitive pressure has in increased, manufacturing enterprises face the challenge to enhance their productivity in innovating products. This challenge is especially demanding in an environment, which is characterized by dynamic market needs, and rapidly changing technologies (COOPER & EDGETT 2005, p. 1). Consequently, enterprises need to be more efficient in their innovating processes and to avoid unnecessarily provoked lifecycle costs. A promising approach in this context consists in increasing the transparency of planned products within the corresponding innovation process. One way to achieve this is through methods supporting the ability to comprehend interrelations among and in-between potentials and demands of future products and processes (HEPPERLE ET AL. 2011a). This comprehension allows anticipation possible goal conflicts and thus reduces the amount of changes along the future lifecycle. These changes are directly linked to additional costs, which furthermore grow exponentially the later unintended changes are made within the lifecycle (EHRLENSPIEL ET AL. 2007, p. 242). However, having a grown complexity of developed products and process, these methods demand for more rigorous and formalized practices.
In response to this demand, along with advancements in computer technology, a common practice of engineering and product design is the fundamental transition from a document-based approach to a model-document-based approach. In the model-document-based approach, the emphasis shifts from producing and controlling documentation to producing and controlling a coherent model of the system with the support of computer technologies (FRIEDENTHAL ET AL. 2008, p. xi). Computers have advantages in representing, organizing, storing, and retrieving digital information, what makes them valuable tools. Thus, computers can especially be used to supporting the resolutions of problems or to carry out repeating tasks within product development. Moreover, with collaboration between humans and computers, extremely challenging tasks in product development for computers, e.g. creating a synthesis of a problem, can be overcome (SHEA 2010, p. 8). Consequently, the application of computer-supported methods can help managing the complexity, while at the same time improves design quality and cycle time, eases communications among a diverse development team, and facilitates knowledge capturing and evaluation.
1.2 Goals and Objectives
This thesis focuses on an especially developed approach, supporting the analysis and elaboration on interrelations among anticipated demands and potentials along the whole lifecycle. HEPPERLE ET AL. (2011a) and FÖRG (2010) are presenting this approach, allowing an early identification of goal interrelations and goal conflicts for the phase of product planning within the innovation process. Goal interrelations occur by applying essential product concepts for goals that are influencing the same parameters, which can lead to conflicts, in the
product goals among each other through possible solutions and their characterizing parameters. Figure 1-1 shows an abstract example for a graph-based representation of a product planning system and occurring goal interrelations. As it can be seen, demands are leading to goals, which are directly linked to a core function of a product or the development process. These core functions can be satisfied by various solutions, which are finally influencing the various parameters. Additionally, the approach considers an integrated lifecycle perspective and thus the various sources of demands and phases of a product’s life and their complex interconnections.
A disadvantage of the approach is the limited amount of elements, which are manageable by humans. With increased product complexity, the number of elements and therefore the amount of stored information, which needs to be handled, raises significantly. Moreover, if several product generations and their future developments are object of the planning process, the number of considered elements and their interrelations grows even faster. Containing a large amount of stored information, the whole system arrives at a point, where humans spend more time on searching information than using it effectively (SHEA 2010, p. 8). Consequently, computer-techniques should be used to support information handling within the approach. This paper aims to provide a concept for a computer-supported implementation of a goal interrelations analysis within a lifecycle-oriented product planning system through various product generations. Thus, based on the existing approach, possibilities for its enhancement as well as an implementation with various computer-supported modeling techniques need to be analyzed. The derived information should results in a specification of general requirements and a framework for the implementation of a computer-supported goal interrelation analysis.
Figure 1-1 Abstract example of a graph-based representation of goal interrelations (HEPPERLE ET AL.2011a)
Goal system Demands / underlying conditions Goals Concept system Solution elements Core functions Core
function 1 Goal 1 Demand 1
Solution element 1 Solution element 2 Goal 2 Core function 2 Demand 2 Parameter space Parameter II Parameter III Parameter I
Finally, a conceptual implementation is needed, showing a general outline for a software tool, which is based in previously achieved specifications.
1.3 Structures
Focusing on achieving the goal presented in chapter 1.2, the structure of this thesis is presented in this section. An overview on the general structure is shown in Figure 1-2, where the order of the various chapters as well as their relations can be seen. In order to provide a better understanding of the structure of this thesis, each chapter is further described in the following.
First, the thesis and its main topic are introduced in chapter 1, by primarily presenting the background motivation of this thesis. Based on this motivation the general goals and objectives are derived, followed by the description of the structure.
Chapter 2 provides the state of the art in related research. Therefore, it is divided into three parts: related work, related approaches and fundamental approach for the analysis of goal interrelations. The first part concerning related work regards several fields of research, as a general outline for this thesis. The following section about related approaches describes several different approaches, principles, methods and techniques, which are applicable to this research project. Since the approach for the analysis of goal interrelations presents the fundament of this paper, it is introduced separately in order to deliver a more detailed description. Having provided the background information on this chapter the main part of this paper becomes coherent.
As can be seen in Figure 1-2, the chapters 3, 4, and 5 that represent the main part of the thesis,
Figure 1-2 Overview on the structure of this thesis
7. Conclusion and Outlook
6. Conceptual Implementation
3. Requirements
5. Framework
2. State of the Art
1. Introduction
of theses chapters is strongly linked with each other. The presented order, beginning with requirements, being followed by the analysis of modeling techniques and finally the definition of a general framework has been chosen to facilitate the reading of this paper.
Chapter 3 presents the collected requirements for a computer-supported goal interrelation analysis. These requirements are subdivided into three main parts: Requirements regarding the analysis of goal interrelations, requirements for the implementation of the related content, and requirements concerning the associated software implementation. All collected requirements have been improved by various iterations and present the final result. Having presented the detailed requirements to achieve the goal of this thesis, the knowledge gained strongly supports the general understanding of the following chapters.
Chapter 4 describes the analysis of several computer-supported modeling techniques and their aptitude for the analysis of goal interrelations. Therefore, the general conditions applied for the analysis of these techniques are specified. Based on these conditions, the four investigated techniques and their implementations to satisfy the requirements are presented. The gained results of the investigated implementations are finally confronted with each other and the requirements defined in chapter 3.
Based on the results discovered in chapter 4 and on the requirements listed in chapter 3, a framework for a general solution of a computer-supported goal interrelation analysis is shown in chapter 5. Hence, basic attributes and properties for the enhancement of the general approach are presented, as well as a systematical definition of all necessary elements. Furthermore, the main features and the requested structure of a software tool for goal interrelation analysis are defined within this section.
Chapter 6 finally presents an exemplary and conceptual implementation of a goal interrelation analysis, considering the requirements, the results of the analysis, and the framework. Therefore, a detailed example of lifecycle oriented product planning system is introduced, and used for an application of the approach. Furthermore, a conceptual implementation of a software tool is presented, satisfying the framework and the requirements.
Lastly, chapter 7 closes the thesis with a conclusion and a critical discussion of the results. Additionally an outlook is given, identifying necessary improvements, the need for an implementation and the application of the received results.
2
State of the Art
In this chapter, the fundamental background of the goal interrelation analysis and its application is provided. Therefore, the state of the art in related research is presented. This is done by firstly introducing the related work, being the sources of the request for the analysis of goal interrelations. Following the theoretical approach for analyzing goal interrelations, is presented. Finally related approaches are described, which include several principles, methods and techniques that are directly applied within this thesis. Having provided the background for this research project in this chapter, all necessary information has been delivered to understand the complete background of this thesis.
2.1 Related Work
Within this section, the related work to this thesis is introduced. In order to understand the application of a Goal Interrelation Analysis (GIA), it is vital to know the main expressions and potential fields of application. Consequently, strategic product planning, innovation management, product lifecycle management, complexity management, and their basic meanings are presented.
2.1.1 Strategic Product Planning
In general, the Strategic Product Planning (SPP) is seen as the initial phase of the product development process. However, a more detailed overview on the SPP phase, explaining the concept followed by the placement of the phase within the process to develop new products. SPP implies the reference to a strategic behavior in the field of planning a new product. Commonly speaking ‘strategic’ characterizes long-term planning followed by the marshaling and allocation of resources to achieve pre-defined goals (REA & KERZNER 1997, p. 2). Transferred to the field of company behavior it characterizes the way to influence the relationship of an enterprise to its environment in order to secure long-term success. This can be enabled mainly by securing the competitive position and offering marketable products (TIETZE 2003, pp. 17ff).
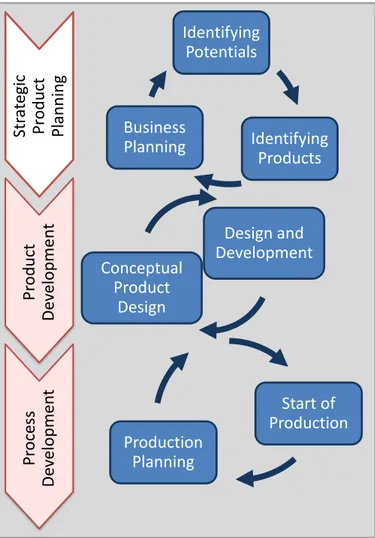
With these properties, SPP is commonly placed in an early stage of the product innovation process. GAUSEMEIER (2001, p. 43) developed a model of the innovation process showing the three main cycles of the innovation process, presenting the SPP as the initial one (see Figure 2-1). Aim of this phase is to identify innovation projects that support broader business strategy which also account for changes in competitive and technological environments. Methods like market segmentation analysis, scenario technique, technological positioning, portfolio analysis and organizational analysis of resources and capabilities can be used. Having gained the relevant information, opportunities can be received and used as inputs for the following steps in the product development process (LIMBERG 2008, pp. 23–24; BRAUN 2005, pp. 17–18).
To sum this up one can note that the main task of the SPP is to analyze possible solutions and potentials in order to create products, which satisfy demands within a long term business planning. These findings can be supported by a consequent analysis of goal interrelations in order to identify possible conflicts and strongly interrelated goals.
2.1.2 Innovation and Innovation Management
Another related field of work is innovation management. Companies can gather significant advantages in a competitive environment by inventing and offering innovative and creative products. Unfortunately, these products also imply the risk of a failure. Therefore, innovation management helps to minimize risk and to design successful products with substantial benefits for customers and, as an optimum, uniqueness (SCHWANINGER 2005, p. 40; LAMBERTZ ET AL. 1996, pp. 30–32). To introduce innovation management, firstly the expressions are defined and classified, followed by the management process for them.
Figure 2-1 Strategic product planning as partial phase of the innovation process according to GAUSEMEIER
(2001, p. 43) Start of Production Production Planning Str at eg ic P roduct P lann ing P roduct De velopme n t P roc es s De velopme n t Identifying Potentials Identifying Products Business Planning Conceptual Product Design Design and Development
Innovation is defined as qualitatively novel product or procedure, which use new knowledge to distinguish noticeable from the state of the art (HAUSCHILDT & SALOMO 2011, p. 3; AFUAH 2003, p. 13). It is not just a straight improvement on a technological problem. It is a more complex development (HAUSCHILDT & SALOMO 2011, p. 4). Innovations are the combination of new technological and market knowledge through companies’ competences and assets in order to achieve new products that customers will want (see Figure 2-2). Thus, a product is new in that its cost is lower, it has improved attributes and attributes it never had before (AFUAH 2003, pp. 5–6).
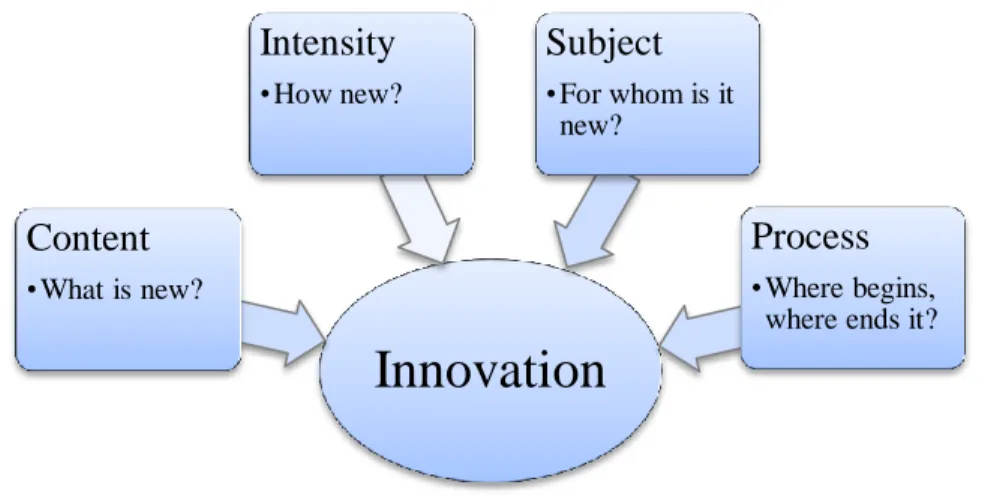
HAUSCHILDT & SALOMO (2011, pp. 5–23) further provide several dimensions to classify an innovation shown in Figure 2-3. Therefore, it is possible to ascertain something as innovative by looking at its content, intensity, subject and process. The content describes thereby what is new such as a product or process, an attribute, a technical, organizational, business related or a postindustrial innovation. The intensity refers to how new an innovation is, either by a fact or by a certain degree. The subject regards for whom it is new which can be experts, management, branches, nations or humanity. Moreover, it may be considered where, along the process of creating innovations, the innovation can be found. Having determined these dimensions, innovations can be compared in order to become manageable and therefore successful.
Figure 2-2 Composition of an innovation (AFUAH 2003, p. 5)
Technische Universität München Product Development
© 2011 Prof. Lindemann Mitarbeiter / 2011 / 0
New Product - Low cost - Improved attributes - New Attributes Competences and assets New technological knowledge New market knowledge
Finally, innovation management can be described as an active organization of innovations and the involved system. This includes not only managing the process of an innovation, but the entire institution, where the processes occurs (HAUSCHILDT & SALOMO 2011, p. 29). Therefore, the innovation management is focused towards understanding and controlling the appearance and diffusion of innovations within several areas of influence (HERRMANN 2010, p. 238). Innovation management has to consider the inter-divisional character and the single phases of the innovation process while working on strategic, tactical and operative tasks. Further information in this field is affected by complexity dynamic and non-transparency (SEIDEL 2005, pp. 14f.).
The product itself and the process of the product design within innovation management are relevant for this thesis. Limiting the view towards a new product, innovation management equals strategic product planning (HERRMANN 2010, p. 242). The presented concept in this thesis is used to identify goal interrelations during product planning process that can also be applied as a method in the innovation management.
2.1.3 Product Lifecycle and Product Lifecycle Management
The product lifecycle and product lifecycle management are in two different ways connected to this thesis. Firstly, the product lifecycle is a significant part of the method for integrated product planning. It is used as a source for the identification of demands and considered interrelations chains are classified according to their occurrence. Furthermore, product planning is a part of the product lifecycle and therefore the presented concept can be used as a method within it. Hence, the product lifecycle and Product Lifecycle Management (PLM) are presented in the following section.
A product lifecycle includes all phases in the life of a product and helps considering important influences and requirements of a product. These cycles can be seen, analogue to biological or natural systems with limited lifespans, as every phase from the first idea of a product, over
Figure 2-3 Dimensions of an innovation according to HAUSCHILDT &SALOMO (2011, pp. 5–23)
Innovation
Content •What is new? Intensity •How new? Subject • For whom is it new? Process •Where begins, where ends it?research, product design, construction, production, sales and service until the disposal (ARNOLD ET AL. 2005, p. 13; HERRMANN 2010, pp. 63ff). Having included the whole life of a product into the planning process sharpens the system understanding and therefore possible interrelations can more accurately be identified (EHRLENSPIEL ET AL. 2007, pp. 242ff). The detection of goal conflict can be supported by anticipating interrelations, company processes, and context factors, leading to a reduction of changes (GEORGANTZAS & ACAR 1995, pp. 13ff; GAUSEMEIER ET AL. 2004, pp. 46f.; HEPPERLE ET AL. 2011b). Supporting this analysis, various models of lifecycles exist according to the relevant subject.
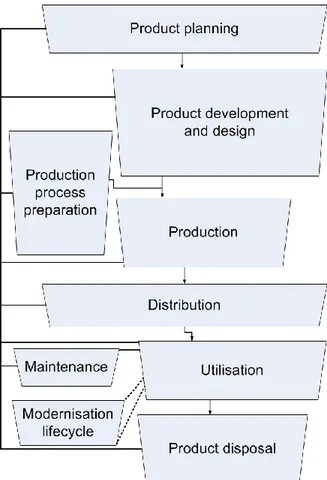
Within the context of this work, especially the integrated lifecycle model defined by HEPPERLE ET AL. (2009) has to be mentioned. The model is a synthesis of various models from different areas of product design and can be seen in Figure 2-4. The integrated perception of a lifecycle model enhances the classical linear market cycle and disposal cycle by a design cycle, an observation cycle and parallel phases (HEPPERLE ET AL. 2009; HOECK 2005, pp. 35ff.; HERRMANN 2010, p. 71). As a result the lifecycle model is built of superordinate phases of ‘Product planning’, ‘Product development and design’, ‘Production process preparation’, ‘Production’, ‘Distribution’, ‘Utilization’, ‘Maintenance’, ‘Modernization lifecycle’ and ‘Product disposal’. If requested, these superordinate phases can be split further down to more than 25 working phases and more than 15 product states (HEPPERLE ET AL. 2011b).
AL. 2005, p. 14; FELDHUSEN & GEBHARDT 2008, p. 20). Moreover, with the ‘Liebensteiner Theses’, a general explanation of product lifecycle management has been defined (SENDLER 2009, p. 27):
PLM is a concept, no system and no (completed) solution.
In order to implement/realize a PLM concept solution components are needed. These include CAD, CAE, CAM, VR, PDM and other application for the product design process.
In addition, interfaces to other applications like ERP, SCM or CRM are components of the PLM concept.
PLM providers offer components and/or services for the implementation of the PLM concept.
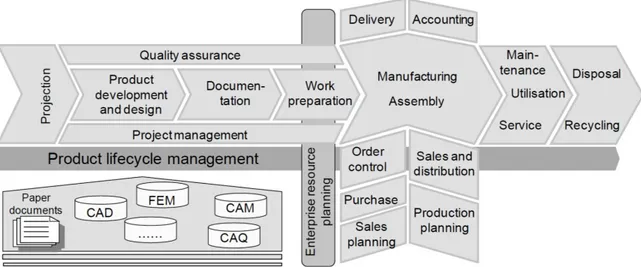
A graphical classification of PLM into typical processes of a company is provided by (ARNOLD ET AL. 2005, p. 14) (see Figure 2-5). While the enterprise resource planning system addresses mainly the production process, the product lifecycle management focuses orthogonally to it the product design and connected processes. Furthermore, the implementation of the integrated PLM processes is enabled by specialized software systems, methods and information supporting interconnection between all phases.
2.1.4 Complexity and Complexity Management
As already mentioned, there are some factors, which are limiting product design. Among them is the complexity of products, which makes product design often difficult to handle without the support of special techniques, e.g. computers (LINDEMANN & KIEWERT 2005, p. 415). In order to understand what complexity is and how it can be handled, the definition of complexity of technical systems is regarded and an introduction to management of complexity is given.
In general, the definition of complexity in literature is not consistent. Every definition focuses on certain aspects according to their discipline (LINDEMANN ET AL. 2009, pp. 25ff). Complexity of technical systems is depending upon the quantity of system elements and their relations, the intransparency, the number of variables and their dynamic behaviors (LINDEMANN ET AL. 2009, pp. 25ff; LINDEMANN 2005, p. 287; EHRLENSPIEL ET AL. 2003, pp. 54f). Consequently, the complexity of technical systems can generally be defined as the property of a system to have many different states and behaviors (SCHWANINGER 2005, p. 31; LINDEMANN ET AL. 2009, pp. 25ff).
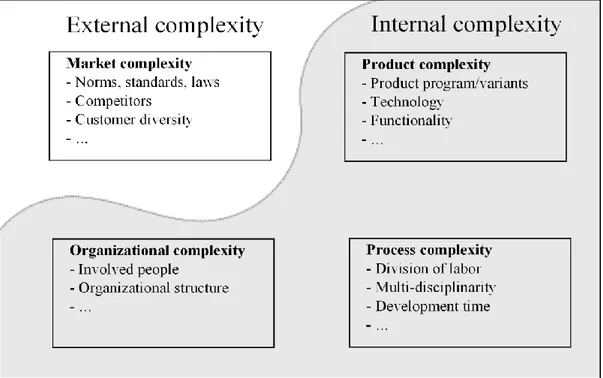
In the case of product design, complexity can be generated by different sources. Especially the number of disciplines involved and the distribution of work influences its degree (GAUSEMEIER & REDENIUS 2005, pp. 554f). As can be seen in Figure 2-6 complexity in product design exists within the product, the process, the organization and the market. These fields can be divided into internal and external sources, but just internal complexity can be actively managed (LINDEMANN ET AL. 2009, pp. 25ff).
mechatronic and individually adapted ones (Gausemeier & Redenius 2005, pp. 554f; BULLINGER ET AL. 2003, p. 18). Because of grown complexity in products and processes, special adapted strategies are needed. These strategies are referred to as complexity management. (CLARK & FUJIMOTO 2005, pp. 129ff; LINDEMANN ET AL. 2009, pp. 31ff). Hence, complexity management describes a method to control, guide and develop a company, its products and the environment. It allows achieving a requested state under complex circumstances and the consideration of typical problems in handling complexity (SCHWANINGER 2005, p. 31). (LINDEMANN ET AL. 2009, pp. 31ff) specifies two fundamental strategies to handle complexity shown in Figure 2-7. Thus, the basic strategy is the acquisition and evaluation of complex systems, which is required for both successive strategies in order to address complex problems.
The first fundamental step of successful complexity management is generating a meaningful model of the complex system. Most importantly, one has to identify all objects as well as all existing side effects instead of an extract of the system (DÖRNER 2010, pp. 288ff). These items have to be evaluated and systematically sorted to identify structural characteristics. Several methods of representation exist, which have to be chosen according to the requested management goal, but especially matrix based approaches like the multiple-domain matrix or graph-based approaches are commonly applied in this field (LINDEMANN ET AL. 2009, pp. 33ff).
Based on the generated model the strategy of avoiding and reducing complexity can be performed. In general, it is an effective and easy strategy to handle complexity but has to be applied reasonably. By identifying and eliminating unnecessary elements and relations while keeping the existing system’s functionality, the complexity of each system can be reduced (LINDEMANN ET AL. 2009, p. 34). One disadvantage of this method is that often the elements or relations, which are the main reason for the complexity of the system, are directly associated to important attributes for the client. In the worst case the reduction of complexity can lead directly to a reduced competitive capability and is consequently in these cases not applicable (LINDEMANN & MAURER 2007)
Another strategy is to control and manage the complexity. It can be described as the ability to
Figure 2-7 Complexity management strategies according to Lindemann et al (2009, pp. 31ff)
Avoidance and reduction of complexity
Management and control of complexity Acquisition and evaluation of complex systems
handle a system at an optimal level of complexity. Thus, the advantages of the system can be used while its side effects can be controlled without endangering the requested goals (LINDEMANN ET AL. 2009, p. 34; LINDEMANN & MAURER 2007; PUHL 1999). Therefore, the possibility to manage and control complexity offers a high, often unused, entrepreneurial potential. It enables several opportunities, like highly individual products, increased protection from product plagiarism and improved prediction of the impact of change (PINE 2008, pp. 31ff; WILDEMANN ET AL. 2007, p. 50; CLARKSON ET AL. 2004).
In order to achieve objectives and actively develop complex products, several methods have been developed (LINDEMANN ET AL. 2009, pp. 39–42). Among these methods especially the visualization of information, the multiple-domain matrix and the computational approaches are within the focus of this thesis.
2.2 Approach for the Analysis of Goal Interrelations
Main task of this work is to present a concept for a computer-supported implementation of the approach provided by HEPPERLE ET AL. (2011a) and FÖRG (2010). The approach was developed to anticipate and systematically analyze demands and corresponding product goals as well as trends concerning future solutions by linking product goals among each other via possible solutions and their characterizing parameters.
This chapter gives an introduction to the approach. This is done by presenting firstly the aim upon which the approach is based, the elements considered within, and the context analysis needed to identify them. Based on these, the graph-based approach for identifying and analyzing goal interrelation is described. Finally, it is shown how the approach is enhanced to reflect lifecycle-oriented product planning.
2.2.1 Aims Concerning the Approach
HEPPERLE ET AL. (2011a) and FÖRG (2010) are presenting an approach, which supports the early phases of the innovation process by providing a life-cycle oriented approach to identify and analyze goal interrelations among future demands and potential. To assure covering the right aspects he bases his approach on a systematic clarification of requirements. These are gathered by reflecting the weaknesses and strengths of related work as well as planning-specific requirements for developing new approaches as can be seen in Figure 2-8.
These requirements are setting the framework for the graph-based method to represent goal interrelations. Thus, it considers product potentials and corresponding product concepts as well as demands arising from the company, market and environmental context. The corresponding approach is described in the next chapters.
2.2.2 Considered Elements within the Approach
This section gives an overview on the different elements and their coactions being relevant in lifecycle oriented planning with the aim of identifying goal interrelations according to HEPPERLE ET AL. (2011a). In Figure 2-9 a graphical visualization of the framework can be seen.
Focusing on information relevant and manageable for planning phases
Compatibility to existing planning procedures and applicability to various branches, products, levels of innovation (radical and incremental), etc.
Pursuing a modular approach to allow the partial use according to the respective planning task
Compatibility to existing organisational structures within an enterprise (both considering upstream (e.g. information acquisition) and downstream (e.g. product development) processes))
Allowing consideration of process and product related potentials and demands arising along different lifecycle phases
Allowing traceability of causal chains among abstract context factors to concretised solution opportunities
Increasing transparency in causal networks of product potentials and demands by integrating structural complexity management approaches
Consideration of both Market-Pull and Technology-Push approaches to detect and set trends
Providing a framework to deduce consistent product concepts by increasing transparency concerning product goal interrelations
Enhancing innovativeness by solution neutral goal formulation as well as openness for functionally equivalent and better solutions independent from known existing solutions Figure 2-8 Aims of the approach to handle goal interrelations (HEPPERLE ET AL.2011a; FÖRG 2010)
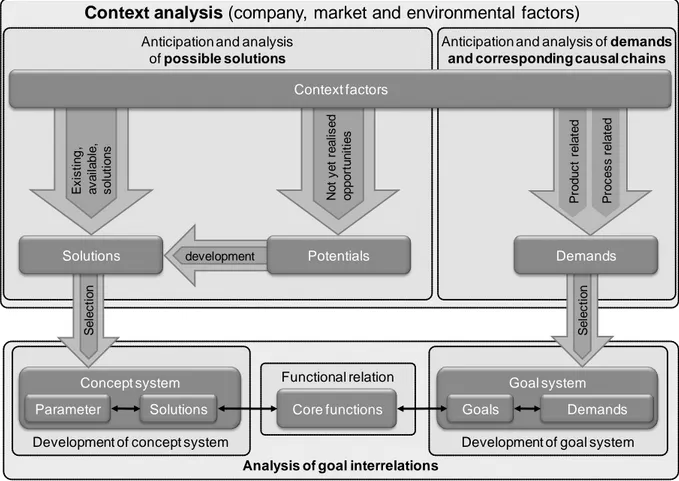
The superordinate task of identifying future potentials and demands is illustrated in the upper box. The context factors can be analyzed with the model provided by LANGER & LINDEMANN (2009b), described in the following section. Thus, important issues from the environmental, market and company context can be detected. These, shown on the right side of the figure, can lead to opportunities and demands, referred to as a market pull. On the left side, where future solutions are anticipated and analyzed, the opportunities are referred to as technology push. These solutions can be subdivided into two types: on the one hand, already existing and available solutions that can be used in future solutions (e.g. products transferable from other branches). On the other potential solutions being not yet implemented into products (e.g. findings in research). These potentials are needed to be developed and projected to product solutions in order to be later considered within the analysis of goal interrelations (HEPPERLE ET AL. 2011a). As a next step, a first selection of solutions and demands should be carried out in order to allow manageable analysis of goal interrelations and to focus on the task of planning products. This step should be performed systematically for example by considering the background of the company strategy and economic aspects (HEPPERLE ET AL. 2011a). The confrontation of the collected demands on the right side and solutions on the left side can be seen in the lower box of Figure 2-9. In the figure, the alignment of the elements is based on the Means-End-Chains, which is later described in chapter 2.3.1.2. At the goal system (right side), the chain starts with demands (e.g. deriving from external sources like legal restrictions)
Figure 2-9 Framework for analysis of goal interrelations according to HEPPERLE ET AL.(2011a)
Analysis of goal interrelations
Development of concept system
Functional relation
Development of goal system Anticipation and analysis of demands
and corresponding causal chains
Anticipation and analysis of possible solutions N o t y e t re a li s e d o p p o rt u n it ie s E x is ti n g , a v a il a b le , s o lu ti o n s P ro c e s s r e la te d P ro d u c t re la te d development Context factors Goal system Concept system Core functions
Parameter Solutions Goals Demands
Potentials S e le c ti o n S e le c ti o n Demands Solutions
the solutions are concretized by planning relevant parameters. Both sides, the goal system and the concept system, are connected through a functional relation, described by the core function. Core functions are directly related to either features of the planned product or tasks within the product planning process and are serving to organize the various chains. Thus, a complete chain from the demand via goals and core functions to solutions with their parameters can be provided. Within the approach, the information acquisition of goal and concept system can be carried out concurrent, since both sides are first independent and linked afterwards by core functions. Another advantage of the framework is the flexible support of Technology-Push and Market-Pull approaches. This means that product concepts can be deduced starting from both sides, the concept system (Technology-Push) as well as the goal system (Market-Pull) (HEPPERLE ET AL. 2011a). However, for the identification of the necessary factors a method for the analysis of the context in needed, and therefore presented in the following section.
2.2.3 Context Analysis
New products are influenced by many different factors from within or outside of the company. One task within product development is to identify all possible sources of influences and consider their specific requirements. Also in the case of a GIA, it is important to identify all elements of the product planning system. Not identifying all influences can, in the worst case, lead to a complete product failure, e.g. not considering a certain law. Especially external factors are often difficult to identify. Therefore, it is necessary to perform a systematic analysis of the integrated context of a company, instead of an intuitive identification of requirements. This can be done by using a model for the classification of context factors (LANGER & LINDEMANN 2009a).
A framework for the systematical analysis of context factors is provided by Langer and Lindemann (2009a) and can be seen in Figure 2-10 Model for classification of context factors. First, it distinguishes between elements from the development process, the company, the company interfaces, the market and the environment. With the market being considered as an element of the overall environment, the company interfaces are part of the market, and therefore the connection between company and market. Within the company, the overall development process takes place, thus laying emphasis on this model. Additionally the differentiation between purchases and sales is introduced in the model to provide new perspectives for the allocation of factors. The application context is bundling fields of context, which are possibly affecting the application, and usage of future products (like e.g. legislation, energy). These elements are crossed with the elements from technology/knowledge, socio-economics, and politics/legislation to identify all influencing factors. Further, the four classes can be subdivided by twelve sub-elements leading to a complete framework for the classification of context factors (HEPPERLE ET AL. 2011a; LANGER & LINDEMANN 2009a).
Initially this framework was established for the developments of products. However, it can also be applied in earlier planning tasks, like the GIA, because it describes factors being in
general interest for innovating products. Thus, it is an important part of the integrated identification of relevant demands and potentials to point out what results need to be further processed to identify interrelations between product demands and potentials (HEPPERLE ET AL. 2011a). In the next section it is shown how, based on the framework, how the described elements are used within a graph-based approach to analyze goal interrelations.
2.2.4 Graph-Based Approach for Identifying Goal Interrelations
The implementation of the described framework by a graph representation is based on a definition by (HEPPERLE ET AL. 2011a) describing which kind of goal interrelations exist and why the two goals interrelate:
“First, goal interrelations can occur, because two goals follow the same
characteristic, but with different values (e.g. customer 1 prefers speed > 150 km/h, Figure 2-10 Model for classification of context factors (LANGER &LINDEMANN 2009a)
different available values.”
“Another type of goal interrelation can occur if two product goals are linked by the
possible solution(s) to achieve the goals. E.g. customer 1 demands goal 1 (energy consumption when operating the car < 4 litres/100 km) and at the same time demands goal 2 (acceleration from 0 to 100 km/h in less than 6s). There is no direct goal conflict between these two goals. Still, if taking solution A (specific combustion engine) to achieve goal 1, goal 2 cannot be achieved and vice versa.”
The approach and its graph representation limit themselves to the second type of goal interrelation. This means that achieving the considered product goal requires a consistent set of possible and compatible goals. Vice versa, if it is not possible to detect a consistent set of solution, goals have to be prioritized or further possible solutions have to be found and new iterations of the goal interrelation analysis have to be carried out.
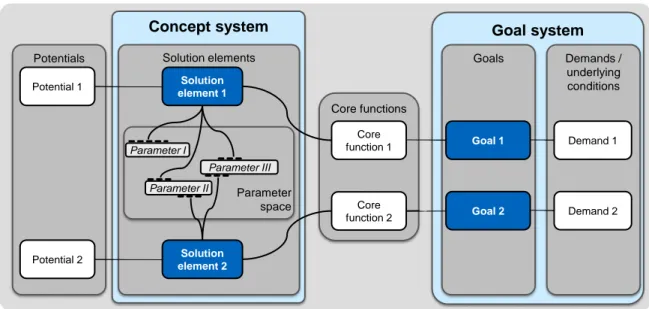
The implemented graph representation of the framework for a goal interrelation analysis is presented in Figure 2-11 as a simplified, abstract example by HEPPERLE ET AL. (2011a). The example shows the elements that were already presented in chapter 2.2.2. Thereby on the right side, a demand is connected to a goal, whereas on the left side, a potential is linked to a solution, which has several connections to parameters. Finally, both sides are connected through the core function. Since the example is simplified, just connections between two single elements are considered and no multiple ones. However, in practical examples this representation technique can also express multiple connections. For example, several solutions can be linked to one core function or several demands can be linked to one goal etc.
As can be seen in Figure 2-11, within the graph representation, the ‘parameters’ are the characterizing elements for the possible solutions. As multiple possible solutions can be characterized by the same parameter, these solutions are therefore indirectly linked through it (see ‘Parameter 2’ and ‘Parameter 3’ in Figure 2-11) (HEPPERLE ET AL. 2011a). Following the connected chains of elements, from the solution to the goal, an interrelation between ‘Goal 1’ and ‘Goal 2’, in Figure 2-11, can be detected. On these connection-chains, the goal interrelation analysis, with the aim to identify goal conflicts, is based.
Hepperle et al. (2011a) and FÖRG (2010) are further presenting an approach for identifying goal conflicts by showing alternatives of linking product parameters. In the abstracted example Figure 2-11 a goal conflict can be identified through ‘Parameter 2’, where two connected solutions are pointing at different ranges of the parameter. In contrast, the two connected solutions of ‘Parameter 3’ have overlapping ranges and therefore no goal conflict can be identified. Several types of connection between solution and parameter exist, which can be seen in the overview of alternatives for linking product parameters in Figure 2-12. It shows how the scale for characterizing a parameter can differ: For very precise information about the possible solution, the quantitative scale can be considered. Nevertheless often, the information about the anticipated future solutions is very vague and qualitative; hence, for the product planning the qualitative scale or the even less detailed binary scale is of particular interest. Additionally it can be distinguished between the type of parameter interrelation, which means if the solution is connected to only one discrete value or a range of parameters. With having several different possibilities for describing connection between solutions and a parameter, which can occur also at the same time in one system, it is important that solutions sharing one parameter should be described similarly in order to allow detecting the interrelation and the possible conflict between them.
Moreover, the approach also allows linking several parameters with each other. Since in
Figure 2-11 Simplified, abstract example of graph-based representation of goal interrelations (HEPPERLE ET AL. 2011a) Goal system Demands / underlying conditions Goals Concept system Solution elements Potentials Core functions Core
function 1 Goal 1 Demand 1
Solution element 1 Potential 1 Solution element 2 Goal 2 Core function 2 Potential 2 Demand 2 Parameter space Parameter II Parameter III Parameter I
equation. Consequently, interrelations between two solutions can also be found via two or more parameters (HEPPERLE ET AL. 2011a). For example if a car is heavier, the kinetic energy to accelerate it raises proportional, based upon the law for kinetic energy E = ½mv².
The approach and the graph presentation according to HEPPERLE ET AL. (2011a) and FÖRG (2010) allows identifying goal interrelations via possible solutions within a future product concept. Connected to it, also goal conflicts can be detected by analyzing the values of the parameter. Besides, the approach is directed on an integrated lifecycle perspective, why its usage against the background considering manifold lifecycle phases is presented in the next section.
2.2.5 Lifecycle-Oriented Goal Interrelations
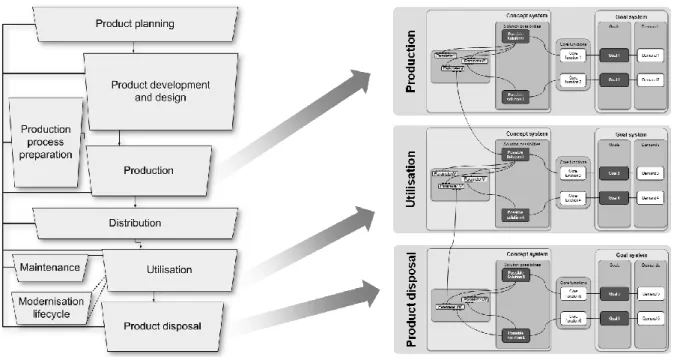
Planning new products through all lifecycle phases is an advantage for companies to differ from competitors, since the company’s strengths and weaknesses may be assigned to other lifecycle phases. With the background of presenting an approach for the integrated lifecycle perspective of product planning, HEPPERLE ET AL. (2011a) and FÖRG (2010) are introducing, how the approach is extended to consider lifecycle phases. To start with, this is done by applying the approach to the various lifecycle phases at the same time. Additionally, it is suggested to develop the framework for the every lifecycle phases in an extra box, so transparency can be maintained at a high level (See Figure 2-13). Therefore, a new product can be described by all related parameters derived from the various lifecycle phases, which can also be linked to each other.
Figure 2-12 Alternatives of linking product parameters (e.g. heat resistance) (HEPPERLE ET AL.2011a)
Scale
binary qualitative quantitative
T y p e o f p a ra m e te r in te rr e la ti o n d is c re te ra n g e Not applicable Heat resistance Heat resistance
+
-Heat resistance
y
n
Heat resistance Heat resistance Range of conformance Range of conformance Solution 1 Solution 2 Solution 1 Solution 2 Solution 1 Solution 2 Solution 1 Solution 2 Solution 1 Solution 2 Heat resistance Solution 1 Solution 2 Examples for no conformance2.3 Related Approaches
In order to receive a deeper understanding of this thesis’s content, the related approaches need to be regarded. Giving an introduction into these, an overview on the fundamental principles, the applied methods, the usage of models, as well as the computer-supported modeling techniques is presented.
2.3.1 Fundamental Principles in Product Design
In this section, some basic principles, being often applied in systematical product design and related to the GIA, are presented. These principles are general procedures of how to handle certain circumstances, leading to improved results. Consequently, the general principles to visualize systems as well as mapping information are introduced, which both are also applied in the approach to analyze goal interrelations.
2.3.1.1 System Visualization
Making system data visually available is a fundamental feature of many research disciplines and an important principle of systematical management. The general objective of representing information visually is to give users a global overview and a better system understanding by focusing views on specific aspects (LINDEMANN ET AL. 2009, pp. 39f.). Furthermore, the use of graphics and diagrams helps to overcome communication issues and saves time for
graphs and matrices are the most common (LINDEMANN ET AL. 2009, pp. 39f.; WARE 2004, pp. 210ff).
The application of graph theory for representing system is a basic property of many methods in product design, where the focus lies on elements and their interdependencies. In general, a graph describes a start node and an end node, which are connected through an edge. Figure 2-14 shows a simple example for graph representation, where several components of a product are connected to parameters by lines. Having a component as a start node, a parameter as an end node, and a line as an edge, it is a typical graph representation, which therefore can help to identify components and depending parameter. Other examples, which can be traced back to the usage of graph theory are the critical path method or the project scheduling as well as numerous algorithmic problems (LINDEMANN ET AL. 2009, pp. 47.; GROSS & YELLEN 2006, pp. 493ff). Consequently, graph theory provides the basis to characterize system constellations like identifying implied substructures or structural attributes (LINDEMANN ET AL. 2009, pp. 127ff; GROSS & YELLEN 2006).
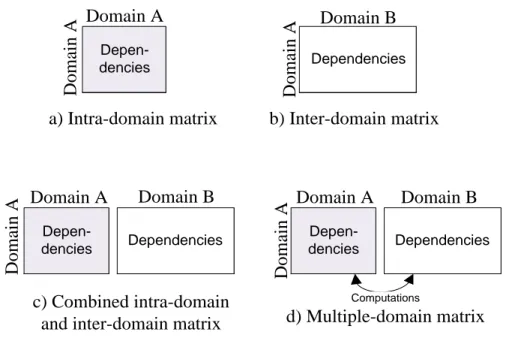
Matrix-based approaches can be seen as an alternative to graph-based approaches, since in general it is possible to transform graphs to matrices. However, it has to be considered, that every representation has own advantages for certain problems including the possibility to lose some explicit information during the transformation (BROY 1998, pp. 167ff; LINDEMANN ET AL. 2009, pp. 39f.). There is a large variety of matrix-based approaches in product design, which can be classified by the quantity of elements involved and executed computations. Figure 2-15 depicts the four types of general matrix systems. At first, the intra-domain matrices (depiction a) in Figure 2-15) are matrices which represent relations within one domain, e.g. Design Structure Matrices (DSM). Secondly, the inter-domain matrices (depiction b) in Figure 2-15) are considering the relations between elements belonging to two different domains, e.g. Design Mapping Matrix (DMM). Combined intra- and inter-domain matrices (depiction d) in Figure 2-15) are using the advantages of both systems, as it is used
Figure 2-14 Assignment of components to parameters with graphs
«block» Combustion Motor «block» Chassis «block» E-Motor «block» Costs «block» Energy Consumption «block» Max Torque
in the House of Quality introduced later in chapter 2.3.2. Finally the Multiple-Domain Matrix (MDM) uses the combination of inter and intra domain matrices plus the computation of information stored in other subsets and will be introduced in the following section.
2.3.1.2 Mapping Information
Focus of this research project is the analysis of goal interrelations. An essential basis of it is the linkage of information from various domains. Since the confrontation of information from various domains is required for most of cross-domain analysis disciplines, multiple approaches exist (LINDEMANN & MAURER 2007). Among them, this section regards the MDM as well as the Means-End-Chain.
Firstly, the MDM will be presented, whose origins can be seen in the complexity management (see chapter 2.1.4). The MDM is a graph- and matrix-based approach to analyze the interrelations of different domains (e.g. functions, processes, components, etc.) and to detect structure in the system in order to manage its complexity (LINDEMANN & MAURER 2007; LINDEMANN ET AL. 2009, pp. 39ff). It combines the functionality of a Design Structure Matrix (DSM) and a Domain Mapping Matrix (DMM) (see Figure 2-16) and enhances it with computation possibilities. The DSM and the DMM are methods supporting systems engineering by confronting system components from one or two domains in a matrix form (FRIEDRICH 2010, pp. 3ff; ZWERENZ 2009, p. 30; LINDEMANN ET AL. 2009, pp. 39ff). The MDM is providing a comprehensive and visual representation of a system, which is applicable on various design and development challenges. It offers an excellent basis for analyzing structures and structural patterns that numerous have researched in the recent years (BROWNING 2001; HEPPERLE ET AL. 2011a).
Figure 2-15 Classification of matrix-based methods (LINDEMANN ET AL.2009, p. 50)
Depen-dencies Depen-dencies Dependencies Domain B Dependencies Depen-dencies Dependencies Domain B Domain B Domain A Domain A D o m ai n A D o m ai n A D o m ai n A Domain A D o m ai n A
a) Intra-domain matrix b) Inter-domain matrix
c) Combined intra-domain
and inter-domain matrix d) Multiple-domain matrix Computations
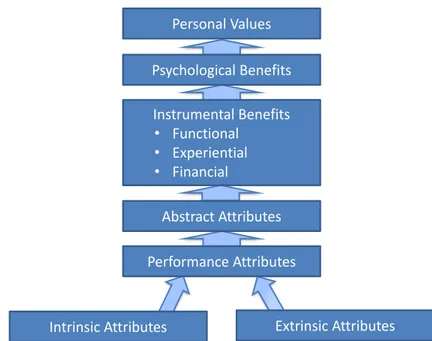
Another approach for linking information is a Means-End-Chain, which is derived from psychological and marketing research (HERRMANN & HUBER 2009, p. 179). Means-End-Chains are used to analyze the connection between certain product attributes and customer’s personal values (GRÖNING 2010, p. 4). The general Means-End-Chain links certain product attributes over benefits to personal values as can be seen in Figure 2-17 (KUSS 2000, p. 67; PARRY 2005, p. 4). However, the specific marketing algorithm is not directly relevant for goal interrelation analysis and strategic product planning. The interesting detail of the approach is the general idea of addressing customers’ demands on different abstraction levels, which can be regarded as a basic method for structuring future demands and potentials (HEPPERLE ET AL. 2011a).
Figure 2-16 Multiple-Domain Matrix according to LINDEMANN ET AL.(2009, pp. 69ff)
Domain 1 Domain 2 Domain 3 Domain 1 Domain 2 Domain 2 DSM2 DSM1 DMM2 DMM3 DMM4 DMM1
2.3.2 Applied Methods in Product Design
This section introduces into several applied methods from the field of product design, which is relevant in the context of this thesis. Thus, an introduction into the Quality Function
Deployment (QFD) is given, which provides a confrontation of solution and demands in
production, similar to the one in the GIA. Furthermore, an approach for the consideration of temporal aspects within product design as well the scenario-technique for the consideration of several trends or scenario is shown.
An approach which connects customers’ requirements and technical product specifications and which is widely accepted in industrial practice is QFD (AKAO 1990, pp. 3ff; HEPPERLE ET AL. 2011a). Integrating customers’ demands into the product design is the main focus of QFD. This is done by building the House of Quality (HoQ) which is a matrix based diagram combining several charts (Figure 2-18). Within the HoQ, customers’ requirements are compared to other products and to the companies’ engineering knowledge. Further interdependencies between engineered attributes and their attachments to product goals are listed (JAINTA 2009, p. 4; WEBBER & WALLACE 2008). Summarizing all necessary information, the HoQ can be seen as a blueprint for product design (MADU 2006, p. 19)
Figure 2-17 A general Means-End Chain model according to PARRY 2005, p. 4)
Personal Values Psychological Benefits Instrumental Benefits • Functional • Experiential • Financial Abstract Attributes Performance Attributes
Anticipating the whole lifecycle of future products allows fast responses to influences from the environment. Thus, it is an essential task to consider temporal aspects in the product planning process. With this knowledge, it is possible to adapt the portfolio of offered products to the latest condition concerning content and time (UGHANWA & BAKER 1989, pp. 212f; HEPPERLE ET AL. 2011b). As an introduction into this topic, the temporal aspects in lifecycle oriented planning of product-service systems as well as the scenario technique are presented. HEPPERLE ET AL. (2011b) identify several planning-relevant temporal aspects concerning singular lifecycle phases as well as lifecycle constellations of singular and multiple product generations. Therefore he provides a scheme based on a simplified product lifecycle, consisting of only four superordinate phases ‘Development’, ‘Production’, ‘Utilization’ and ‘Recycling/Disposal’ (see Figure 2-19). Besides multiple product generations, it also describes the industry-relevant topic of ‘facelifts’. This scheme supports the understanding of temporal aspects concerning lifecycles of one product generation and multiple product generations and therefore the systemically description of temporal patterns.
Another method, which is relevant for this research project, is the scenario technique. The goal of the scenario technique is an early identification of the dynamic development-paths of a system in order to derive conclusions on appropriate actions (WILMS 2006, p. 68). The approach combines the principles of ‘multiple futures’ and ‘cross-linked thinking’ and is generally based upon the scenario as a thinking model for strategic management (GAUSEMEIER ET AL. 2009, pp. 60ff). The idea of a scenario is visualized graphically in Figure 2-20 with the scenario-cone. Starting point for a scenario is always the current time. Depending on several decisions and disturbance, the development arrives at another point in the future. With longer development time, future conditions get less certain, which results in more variance and possible developments. Consequently, the scenario-cone spreads with the time and contains multiple development lines for scenarios (MIßLER-BEHR 1993, p. 3; GAUSEMEIER ET AL. 2009, p. 62). Thus, it can be seen that for planning future products, several scenarios have to be considered, in order to anticipate necessary trends for new products.
Figure 2-19 Scheme of multiple subsequently following lifecycles and product generations (HEPPERLE ET AL. 2011b)
2.3.3 Usage of Models in Product Design
With the increased need of developing complex products for highly dynamic markets, working with simplified models of products is an essential technique in product development (SCHWANINGER 2005, p. 33). In these models, all information gathered during the development process may be collected and used as sources for further analysis through all phases of the product development (KOCH & MEERKAMM 2001, p. 218; GAUSEMEIER ET AL. 2005, pp. 607ff). As an introduction to this topic, a short definition of models is given, followed by the general usage of models in engineering disciplines. Finally the model-based systems engineering approach is presented, which is also applied within this research project. In general, a model is a (simplified) image of a real or thought system, transferred into another system (BUNGARTZ 2009, p. 5; SCHILLER 2009, p. 23). Models are built according to the original, with changes to support the achievement of the intended aim (GAUSEMEIER & REDENIUS 2005, p. 562; KASTENS & KLEINE BÜNING 2005, p. 16). Since the quality of a result is directly connected to its underlying model, it needs to be chosen, how to model the system and which techniques are used to describe it. Consequently, some elements or properties that occur as unimportant can be neglected to reduce complexity and ease handling. In general, models can be characterized as material or immaterial while immaterial can further be verbal, mathematical, algorithmically or graphical (SCHILLER 2009, pp. 23, 50). Within product design especially CAx systems and systems engineering is based on the usage of models. CAx systems are helping to make relevant decisions about a product as early as possible in the product design process. This is done by calculating and simulating several alternatives of the product as close to reality as possible. The expression CAx summarizes computer-supported systems in product development (VAJNA 2005, p. 433). An example of various tools and the phases they are commonly used in can be seen in Figure 2-21. As can be seen,
the conceptual stage of product planning is hardly supported by specialized creating tools like CAD, but more general tools like the PLM or common office software.
Nevertheless, since product models used in CAx have evolved during several years, the trend towards integrated, knowledge-based models can be seen. Goal of this trend is to integrate all information needed during the whole product lifecycle into one model. Figure 2-22 shows this evolution. It started with conventional CAD models, which only use fixed geometric values, evolving to parametric ones, containing elements with variable constraints, leading to upcoming, knowledge-based CAD models (GAUSEMEIER ET AL. 2004, pp. 609f; VAJNA 2005, p. 437). Within these models, all relevant information is described by features. Through features, it is possible to model all properties of a product with considering all necessary circumstances. This is leading to an integrated product model, which allows managing the increased amount of collected and requested information (KOCH & MEERKAMM 2001, p. 218; VAJNA 2005, p. 437). Consequently, having a complete and consistent product model is one of the most important tasks in a modern product development environment and has to be supported also in the earliest phases of product planning processes.
The Model-Based Systems Engineering (MBSE) approach is a formalized application of modeling to support systems engineering (FRIEDENTHAL ET AL. 2008, p. 17). Systems engineering is an approach to use procedures and methods leading to an optimal development or redesign of any system (WALTER 2010, p. 4). Thereby it concentrates on the definition and documentation of system requirements, the design analysis, verification and validation activities from the conceptual design phase throughout development and all later lifecycle phases (WEILKIENS 2006, p. 11). The origins of MBSE can be seen in the CAD development while it was created to overcome limitations of document-based product planning and development. These are among others the inefficiencies in finding errors and stress points, testing both performance and timing behavior in one or more competing designs, and providing actionable information for trade studies and design reviews. Additionally there is a need to conduct tests before the first prototype has been completed (BUEDE 2009, p. 26; FRIEDENTHAL ET AL. 2008, p. 17). The output of the MBSE is therefore a coherent model of the system, where the emphasis is placed on evolving and refining the model using model-based methods and tools (FRIEDENTHAL ET AL. 2008, p. 17). One possibility to provide means to capture the systems modeling information is the Systems Modeling Language (SysML) (FRIEDENTHAL ET AL. 2008, p. 30).
SysML is a general-purpose graphical modeling language, which is developed to be a language for systems engineering. It supports the analysis, specification, design, verification, and validation of complex systems. These systems may include hardware, software, data, personnel, procedures, facilities, and other elements of man-made and natural systems. The language is based on the Unified Modeling Language (UML), which is established in software engineering and adapted to the needs of general system development and optimization. Looking at the nine provided diagrams, which can be seen in Figure 2-23, SysML can
Figure 2-22 Development of CAD systems (VAJNA 2001, p. 8, 2005, p. 438)
Knowledge-Based CAD
Ability to derive consequences from specific situations of construction (geometry- and backgroundinformation)
Feature-Based CAD
Acquisition and processing of geometry and provided Information (“semantics”)
e.g. functions, manufacturing technology CAD (parametric)
Acquisition and processing of geometric elements with variable references
a) Chronology based: editable history b) Constraint based: editable equations
CAD (conventional)