Analysis by optical absorption
and transmission
electron microscopy
of the strain inhomogeneities
in InGaAdlnP
strained layers
P. Roura
LCMM, Departament de Fi‘sica Aplicada i Electrhnica, Universitat de Barcelona, Fact&at de Fisica, Diagonal 645, E08028-Barcelona, Catalonia, Spain
S. A. Clark
Department of Physics and Astronomy, University of Wales, College oj. Cardifi PO. Box 913 Card12 CF2 3YB, Wales, United Kingdom
J. Bosch, F. Peira, A. Cornet, at& J. R. Morante
LCI&‘@~ Departament de Fisica Aplicada i Electrbica, Universitat de Barcelona, Facultat de Fisica, Diagonal 645, E0802&Barcelona, Catalonia, Spain
(Received 2 August 1994; accepted for publication 3. January 1995)
Optical absorption spectra and transmission electron microscopy (TEl\iI) observations-on In&As/ InP layers under compressive strain are reported. From the band-gap energy dispersion, the magnitude of the strain inhomogeneities, Us, is quantified and its microscopic origin is analyzed in view of the layer microstructure. TEM observations reveal a dislocation network at the layer interface the density of which correlates with a;. It is concluded that local variations of dislocation density are responsible for the inhomogeneous strain field together with another mechanism that dominates when the dislocation density is very low. 0 1995 American Institute of Physics.
I. INTRODUCTION
The most usual technique to obtain the mean strain and composition in strained epitaxial layers is double crystal x-ray diffraction.’ When the stress is partially relaxed, it is necessary to measure the lattice parameter perpendicular and normal to the growing surface. Of course, the mean values of strain and composition give no information about the layer quality. As the composition inhomogeneities and the struc- tural defects, such as dislocations, twins, or stacking faults broaden the diffraction peak, its width is taken as a measure of the layer quality.zY3 However, other factors such as sample curvature and layer thickness can also affect the peak broad- ening making a correct quantification difficult. Alternatively, observation by transmission electron microscopy (TEM) can give complementary information that is quantified in terms of defect density.3
In recent works,41 we have shown that the optical ab- sorption (OA) spectra near the band edge can deliver very detailed information.‘The analysis relies on the fact that the band-gap energy depends on the molar composition as well as the strain. Besides, the splitting of the heavy-hole (HH) and light-hole (LH) valence subbands increases with strain. So, from the band-gap energy and the valence-band splitting, the strain and the molar composition can be obtained with high accuracy.4 The main success of this technique is, how- ever, the possibility of the quantification of the layer quality in terms of composition or strain inhomogeneities through the band-gap energy dispersion. It has been shown that, de- pending on the origin of microscopical inhomogeneities, the spectral shape changes.s The HH energy dispersion (cm) is smaller than that corresponding to the LH subband (oLH) if composition is not homogeneous. On the other hand, a ratio wm/crm> 1 (am.t(r,,-2.8 for In,Ga, -,As when x-0.5) re- veals an inhomogeneous strain field.
In this article we compare the dispersion in the strain value on mGaAs/InP layers under compressive strain deter- mined by OA with the dislocation density measured by TEM. The good agreement between both techniques is the first ex- perimental proof that the microscopical inhomogeneities can be quantified by OA. It is concluded that, in partially relaxed layers, the strain inhomogeneities are related to the change in the dislocation density from point to point in the layer.
II. EXPERIMENTAL RESULTS
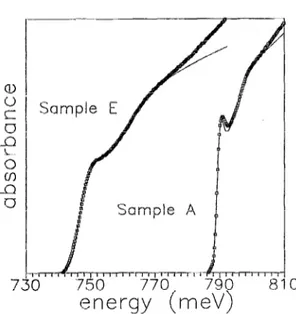
The samples analyzed in this work are In,Ga, -,As epi- taxial layers grown by molecular beam epitaxy on InP(lOO) with the growth conditions detailed in Ref. 1. Layer thick- ness ranges from 0.4 to 0.5 pm. The molar composition, X, and the mean strain, E(Table I), are deduced from the fitting of the OA spectra. The OA measurements have been carried out with a Fourier transform IR spectrometer. A continuous flow helium cryostat allowed the samples to be held at 10 K. Typical OA spectra are shown in Fig. 1. The valence- band splitting due to strain is clearly resolved and, as the first band in the spectra is the more intense,4 it is concluded that the strain is compressive. To quantify properly the layer pa- rameters, we have fitted the spectra with the theoretical shape given by Elliot’s formula6
hi-& 26,
a(hv)=AT c. -@ .( hu-E,+$
+ H(hu- Es)
1 -exp( -2rrJE,lhv-E,) ’ (1)
where .sX is the exciton binding energy and H(x) is the Heavyside function. To account for the valence-band split- ting, Al?, we consider that every subband has the same shape but a different band-gap energy, Es. Finally, the microscopi- cal inhomogeneities are introduced by convoluting every
4018 J. Appl. Phys. 77 (8), 15 April 1995 0021-8979/95/77(8)/4018/3/$6.00 Q 1995 American Institute of Physics
TABLE I. Layer characteristics (molar composition, X, mean strain, E and strain dispersion, CJJ obtained from optical absorption at 10 K and the relaxed strain, A%TEM, deduced from TEM observations.
Sample x 6(x 10-J) 0,(X 10-3) A-+&X 10-q A 54.9 1.0 0.28 0 B 55.7 1.6 0.26 0.33 C 57.5 2.5 0.35 0.33 D 58.0 2.6 0.59 0.87 E 59.4 2.3 0.50 0.59
subband with a Gaussian distribution characterized by the standard deviations a,, and oLn. The fitting parameters are detailed in Table II. The important result is the relative en- ergy dispersion, crmr/~t,n. In all samples we obtain a value between 2 and 2.8, which indicates that the microscopic in- homogeneities are essentially strain variations. Following the procedure given in Ref. 4, the layer parameters are summa- rized in Table I. As the band-gap energy changes linearly with strain, from the energy dispersion we can determine the strain dispersion (cri) in the samples (Table I).
The TEM observations in all samples but layer A show a regular network of dislocations which are clearly seen in the plan view micrograph of Fig. 2. This is evidence that the stress is partially relaxed. Sample A is near the lattice-match composition, so it is coherent with the substrate and no dis- locations or defects appear. On the other hand, sample E is far from the lattice-match composition and a great number of defects other than perfect dislocations are developed (stack- ing faults and threading dislocations are clearly seen in Fig. 3).
III. ANALYSIS
The aim of this section is to understand the layer param- eters deduced from a macroscopical technique as OA is, in view of the microscopic structure observed by TEM.
TABLE II. Fitting parameters of the optical absorption spectra: exciton binding energy, e.*, band-gap energy, Es, valence-band splitting, AE, and the energy dispersions, uHH and qw . (Energies are given in meV.)
Sample 6, Es AE flLH %d"LH A 0.9 790.8 6.9 0.9 3.0 B I .46 784.5 11.7 0.9 2.8 c 0.75 768.3 17.7 1.2 2.8 D 0.9 763.3 18 2.3 2.8 E 0.9 748.4 16.4 2.4 2.0
In the ideal case where only a network of dislocations of angle 60” are present, the amount of relaxed strain
Am
can be calculated with the following formula:7
lb1
TEM=z’
where d is the mean distance between dislocations and b is the Burger’s vector modulus. From the extinction conditions of the contrast we know that the dislocations are mainly of 60” with the Burger’s vector in the (1 IO) direction. Its modu- lus is proportional to the lattice constant a (b = ( 11 O)a/2) which is approximately that of the InP, ar,=5.87 A.8 So, b =4.15 A. The results are quoted in Table I. The subindex “TEM” indicates that this is the relaxed strain due to the network of 60” dislocations. Provided that the actual strain relaxation is great enough, it could be obtained from the OA spectra.” This procedure gives a significant value only in sample E, where the result is AE= 1.7+0.2X IOe3. This is about three times greater than the strain relaxed by the dis- location network indicating that the other defects seen in Fig. 3 contribute to relaxation as well.
The central point of this study is the microscopic origin of the strain dispersion, cr,, quantified by OA. In a first ap- proximation we could think that the greater the relaxation, the greater the strain inhomogeneities. However this is not the case in view of the results because sample A is not re- laxed at all, yet it has a strain dispersion similar to B and C. Further, sample E has the greatest strain relaxation (deter-
FIG. 1. ‘Qpical optical absorption spectra measured at 10 K (points) and EIG. 2. Plan view of sample D. The dislocation network at the interface is
their fitting (solid line). clearly seen.
J. Appl. Phys., Vol. 77, No. 8, 15 April 1995 Roura et al. 4019
FIG. 3. Plan view of sample E. Besides the dislocation network (MD) at the interface, a great density of threading dislocations (TD) and stacking faults (SF) is observed in the region where the substrate has been removed.
mined by OA) whereas its Us is smaller than that of sample D (Table I). In spite of these inconsistencies, there must be a relationship between the microscopic structure and the strain dispersion. We propose that the origin of oe is the dislocation network. Locally, the strain can be.djfferent from the mean value. However, as dislocations relax the strain, the departure from the mean value (Us) cannot be greater than the relax- ation, otherwise at some points the dislocations would in- crease the strain. This condition can be approximated as fol- lows:
A ETEM’ u,. (3)
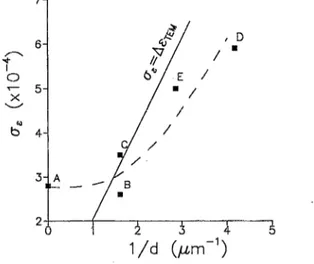
In order to test our hypothesis, in Fig. 4 we have plotted cr, versus the inverse of the mean distance between disloca- tions, d. There is a clear correlation: a; increases monotoni- cally with l/d. Further, in samples with greater dislocation densities, Eq. (3) is followed. This proves that the strain inhomogeneities are indeed due to the dislocation network. Other defects, such as stacking faults, have a minor effect on a,. We think that the strain inhomogeneities reflect the local variation of dislocation density (local plastic relaxation) and not the strain field surrounding each dislocation’ (local elas- tic relaxation). In this second situation, the inhomogeneities would be smoothed as dislocation density increases, which is not the case in view of Fig. 4. Besides, Fig. 4 tells us that, at low dislocation density, there must be another source of strain inhomogeneities. In particular, this is clearly seen in sample A, where no dislocations have been found. Of course, this unknown source of inhomogeneities can be present in the other samples as well. This can explain why sample C does not follow exactly Eq. (3).
At this point it is worthwhile to make a collateral discus- sion concerning the precision of x-ray diffraction and OA in determining the molar composition. In both cases, this deter- mination relies on the hypothesis that the lattice strain de- pends only on the molar composition and plastic relaxation. The fact that in sample A the strain dispersion is not due to composition variation (if this were the case, onH60LH) or plastic relaxation (absence of dislocations) means that the
FIG. 4. Figure relating the strain dispersion, me, quantified by OA and the mean distance between dislocations determined by TEM. If the source of strain inhomogeneities were the dislocations network all points would fall at the right-hand side of the straight line. The dashed curve shows the general trend.
strain may be due to another effect not accounted for in the analysis of OA and x-ray measurements. This can explain why those techniques are more reliable in the measurement of strain than molar composition.4 Concerning the new source of strain we think it could be due to the existence of the oval defects usually encountered in this kind of layer.
IV. SUMMARY
In summary, OA spectra and TEM observations have been made in InGaAs layers under compressive strain grown on InP. From the OA spectra it is concluded that the main microscopic inhomogeneities in the layers arise from an in- homogeneous strain field. Its origin has been analyzed by comparing the strain dispersion quantified by OA with the dislocation density determined by TEM. We conclude that there are two main sources of these strain inhomogeneities: the variations in the dislocation density from point to point in the layer and a mechanism not related to plastic relaxation that is predominant in layers near the lattice-matched com- position.
ACKNOWLEDGMENT
This work was supported by the Spanish “Programa de Ciencia de Materiales” project under Contract No. MAT93- 0564.
‘S. A. Clark, J. E. McDonald, D. I. Westwood, and R. H. Williams, .I. Cryst. Growth 121,143 (1992).
‘I. C. Bassignana, C. J. Miner, and N. Puetz, J. Appl. Phys65, 4299 (1989).
‘B. K. Tanner, J. Cryst. Growth 99, 1315 (1990).
‘S. A. Clark, P. Roura, J. Bosch, A. Perez-Rodriguez, J. R. Morante, D. I. Westwood, and R. H. Williams, J. Appl. Phys. 77, 3393 (1995). 5P. Roura, J. Bosch, and I. R. Morante, Phys. Rev. B 46, 10453 (1992). ‘R. J. Elliot, Phys. Rev. 108, 1384 (1957).
‘P. M. J. Maree, J. C. Barbour, 5. F. van der Veen, K. L. Kavanagh, C. W. T. Bulle-Lieuwma, and M. P. A Viegers, J. Appl. Phys. 62, 4413 (1987). sS. Ada&i, J. Appl. Phys. 53, 8777 (1982).
“R. Bonet, Phys. Status Solidi B 108, 435 (1981). 4020 J. Appl. Phys., Vol. 77, No. 8, 15 April 1995
I Roura et al.