Vision Based Intelligent Systems
to Monitor People’s Behaviour and
Perception
Candidate: Lorenzo Landolfi
Supervisor: Prof. Carlo Alberto Avizzano
Tutor: Dr. Paolo Tripicchio
PhD Thesis
Department of Perceptual Robotics
Scuola Superiore Sant’Anna, Pisa
Acknowledgements
One of the things that I learnt over the last three years is that nothing good happens in science if you consult your brain only and if you rely just on yourself. As a matter of fact, conversing too much just with yourself brings you to overthinking about dead ends. You really need someone that can change the focus of your thoughts. And this is not valid for science only, but for any problem that we face during our lives. All the people listed here are the ones that managed to do that for me.
First of all I would like to thank Carlo and Emanuele, who believed in me and who gave me the opportunity to start my journey at PERCRO.
Then I would like to thank my senior colleagues, which were with me during all my path of studies: Alessandro, Paolo, Massimo and Giulia, who are beautiful, nice and smart persons who make the atmosphere at the office always enjoyable.
I would also like to thank my friends and former colleagues Filippo, Giacomo, Lorenzo and Juan, brilliant and inspiring people who found their fortune abroad.
A great thanks goes to Peter, who was always kind and helpful and supported me so much during my period in Paris.
Thanks to all the friends I met at the ENS, and to Chiara, who helped me to feel at home.
Thanks to all the ”florentine” friends, but in particular Federico and Elisa, who literally kept me alive during this very last period.
I am thankful to my parents Elio and Giovanna, who are a source of inspiration for their strength, tenacity and patience, and to my brother Francesco, always ready to give me wise advice.
3
Contents
I
Observing Human Behaviour: the Learning Context
10
1 The Learning Analytics System 15
1.1 Background . . . 16 1.2 General Design . . . 16 1.3 Collection Service . . . 18 1.4 Analytics Server . . . 20 1.5 Acquired Data . . . 25 2 Estimation of success 29 2.1 Motivation . . . 30
2.2 System and Context . . . 31
2.3 Materials and Methods . . . 32
2.3.1 Datasets . . . 32 2.3.2 Preprocessing . . . 33 2.3.3 Methods . . . 34 2.4 Results . . . 34 2.4.1 Scoring . . . 35 2.4.2 E↵ect of Phase . . . 35 2.4.3 Type of Classifiers . . . 36 2.4.4 E↵ect of Features . . . 36 2.5 Discussion . . . 37 3 Collaboration Analysis 40 3.1 Background . . . 41
3.2 Focus of Attention System . . . 43
3.2.1 Target Coding . . . 44
3.2.2 Structure . . . 45
3.2.3 Subject Disambiguation . . . 47
CONTENTS 5
3.2.4 Action Association . . . 50
3.2.5 Tasks and Models . . . 54
3.3 Evaluation . . . 54
3.3.1 Subjects and Sessions . . . 56
3.3.2 Implementation . . . 56
3.3.3 Results . . . 57
3.4 Discussion . . . 63
3.5 Conclusion and Future Work . . . 65
II
Observing Human Behaviour: the Working Context
70
4 Monitoring the Collision Risk 73 4.1 The acquisition system . . . 744.1.1 System Architecture . . . 74
4.1.2 Low Level Modules . . . 75
4.2 Software and Algorithms . . . 78
4.2.1 Unambiguous Detection of People and Vehicles . . . 78
4.2.2 Triangulation and Tracking . . . 80
4.2.3 Risk Assessment . . . 80
5 Multi camera Calibration 82 5.1 Multiple View Geometry and Calibration . . . 84
5.2 Methods . . . 87
5.3 Testing Environments and Setups . . . 91
5.3.1 Hardware Software infrastructure . . . 91
5.3.2 Setup . . . 93
5.3.3 Ground truth . . . 93
5.4 Results . . . 94
5.5 Discussion and Future Work . . . 95
6 Fast and Fluid Tracking of Landmarks 98 6.1 Background . . . 99
6.2 Method . . . 100
6.2.1 Initial body pose detection . . . 100
6.2.2 Feature tracking . . . 101
6.2.3 Measurement fusion for robust tracking . . . 102
6.2.4 Fusion of multi-rate measures . . . 103
CONTENTS 6
6.3 Evaluation . . . 105
6.3.1 Dynamic time warping . . . 106
6.3.2 Experiments . . . 106
6.4 Discussion . . . 109
III
Observing Perception: Vision
111
7 Human VS Robotic Visual Perception 112 8 Characterization of visual detectors 117 8.1 Description of the experiment . . . 1188.1.1 Stimuli and Tasks . . . 118
8.1.2 Data . . . 120 8.1.3 Image preparation . . . 120 8.1.4 Insertions . . . 121 8.1.5 Probe generation . . . 122 8.1.6 Image variations . . . 122 8.1.7 Cues . . . 123 8.1.8 Construction of a block . . . 125 8.1.9 Methods . . . 125 8.2 Results . . . 126 8.2.1 Detection . . . 128 8.2.2 Congruence . . . 129 8.3 Discussion . . . 132
Introduction
A system is a compound of functional components collaborating one with the other or with other systems in order to achieve a known objective.
For computer science, an intelligent system is a system whose components are units of computations and whose objective is inferring high level information from the en-vironment, which are useful for a specific task, and possibly use such information in order take specific actions that can modify the environment itself. In other words, an intelligent system is a system whose components are units of computation and whose objective is collaborating with humans.
As a matter of fact, the current trend in computer engineering and intelligent sys-tems is to decrease the amount of human e↵ort required to interact with them. From a physical perspective, this is equivalent to decreasing the size and hardware capa-bilities of local devices (Internet of Things , IoT) by outsourcing the heaviest com-putations to remote servers and delegating data storage to big data centers (Cloud computing). But there is also another branch of innovation, now one of the most studied topic in computer science, which has the purpose of reducing the amount of human intervention on computational systems by filling the gap between how hu-mans and machines ”think” or ”perceive”. This topic falls into the general name of ”artificial intelligence” (AI).
Just to mention some example of how AI can facilitate human machine interaction, think to the smart home systems. They can turn on the lights just by perceiving that you are back home or order groceries at the supermarket vocally interacting with you. Possibly, in the future, they could order your meals just by observing your diet patterns and lifestyle.
Since AI techniques are used both for imitating human perception and human think-ing, they can be used both to transform low level data such as video or audio streams into intermediate representation of reality (objects in case of video, words in case of audio) and to further elaborate them into higher level features and patterns relevant to more abstract tasks e.g. the measure the level of danger of a displacement of a set of objects, or inferring the most likely answer given a set of words.
CONTENTS 8
From this statement, it is clear that a throughout understanding of human percep-tion is crucial to improve design and development of artificial intelligence algorithms, either for understanding whether there are possible essential features of brain pro-cessing that are not yet captured by state of the art or to allow the decisions taken by machines and their interfaces to be compatible with the human perceptual system. In general, we want that computers and human perception do not diverge as less as possible.
In the work reported in this thesis, I tried to follow all the three aspects men-tioned above. First of all creating intelligent perceptual systems with limited impact in terms of cost and hardware, where most of the computation is delegated to remote computing nodes. Secondly, I tried to make those system ””intelligent” by integrat-ing them with state of the art AI vision based techniques. And finally, by designintegrat-ing an experiment to explore the basic mechanism underlying human visual perception, in order to understand whether there are important di↵erences between artificial and human vision even at the lowest level of perception.
More specifically, this work presents the development and analysis of three infor-mation systems used to obtain insights about human behaviour and perception in three di↵erent contexts.
The common thread between the first two systems and analysis is that they heavily rely on visual features. Data is mostly acquired from video sources and then trans-formed in more refined features suited for the analysis of complex and abstract tasks. As a matter of fact, the most used feature exploited in this thesis is human body pose, which has been proved to be e↵ective for recognizing actions and interactions between people.[2]. For this reason, a part of this thesis is dedicated to the presenta-tion of a software framework designed with the purpose of tracking body landmarks in a fast and fluid fashion. This both for increasing the o✏ine processing speed, in which body pose is first extracted from video files and then used for subsequent anal-ysis, and for online applications, in which body pose is used for extracting refined features in a real-time fashion.
The first system, described in Part I, is applied in the learning context, specifically ”practice based” learning, as a system designed to capture multi-modal data, but mostly acquired through visual sensors, from students performing practical tasks related to STEM (Science, Technology, Engineering, Mathematics) subjects. The system architecture is reported as long as multi-modal data analysis. A further work, in which the level of collaboration among students is extracted starting from
CONTENTS 9
monocular video source is also reported in details.
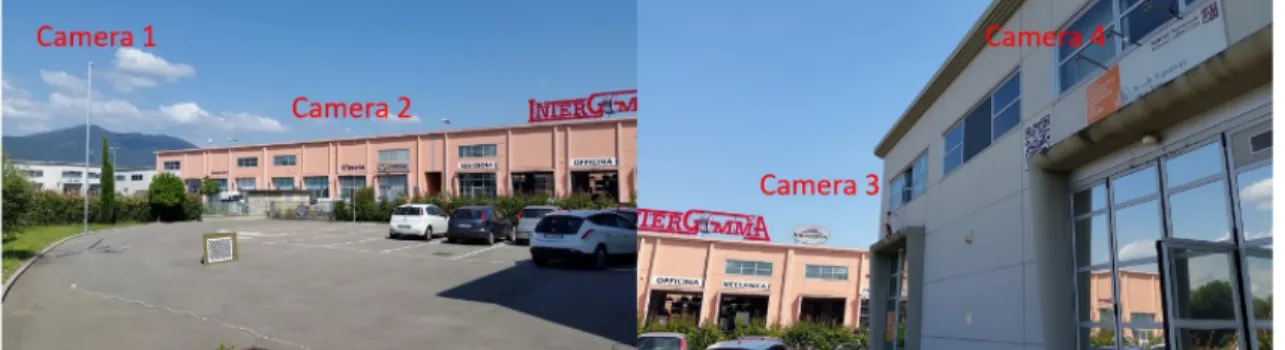
The second system, described in Part II, finds instead its application in working context. It is a system that is designed to monitor crowded and large outdoor work-ing areas where humans and vehicles interact in dangerous proximity. The system exploits video features only and from the hardware level it is composed by a set of calibrated cameras connected to smart computing devices. During the development of such a system, we identified two major issues: multi camera calibration and object tracking. For this reason, we report an overview and an analysis of possible solu-tions of the multi camera calibration problem in large outdoor environments and we propose a software framework for tracking objects landmarks from monocular video sources.
The last system, reported in Part III, reverts the perspective of the other two. In-stead of getting information about human behaviour using artificial vision, It exploits human interaction in order to get insights on how the human visual perceptual sys-tem works. The study of the human visual syssys-tem is indeed meaningful both for improving the design of future robotic perceptual systems and for the design of sys-tems that require human robot interaction through visual interfaces. Experiments performed with such a system reported evidence on adaptive properties that become measurable in response to natural stimuli, both with relation to local stimulation and to contextual modulation from the surrounding scene. The main consequence of this finding is that the model of perception of low level visual features is influenced both by spatial attention and by interpretability of images. We also provide a simple mathematical model that explains one of the task proposed in the experiment.
Part I
Observing Human Behaviour: the
Learning Context
11
This part reports the scientific advancements and the e↵orts made during my in-volvement in the PELARS (Practice-based Experiential Learning Analytics Research And Support) European project.
The PELARS project lead to the development of sensor and analytic technologies with the purpose of fostering teachers and learners understanding of the learning pro-cess, particularly concerning Science, Technology, Engineering and Math (STEM). The project required the involvement of students belonging to high schools, under-graduate engineering and master courses in interaction design. Despite the students di↵erent background, we tried to understand whether it was possible to identify some common milestones of their learning process. One of the main purpose of the PELARS project was to bridge the gap between qualitative and quantitative assess-ment of the learning process, being the qualitative approach mainly composed by human experience and the quantitative one consisting by sensor tracking and ma-chine learning. Concretely, the PELARS project lead to the realization of tools, processes and furniture to be deployed in actual practice-based STEM learning en-vironments. The research area that is focused on the design and development of the tools needed to automatically analyse the human learning process falls into the name of learning analytics (LA).
As a matter of fact, over the last several years the field of learning analytics has grown rapidly in conjunction with Massive Open Online Courses (MOOCs) and other tech-nology systems (mobile applications, student response systems) that have become part of the everyday educational landscape. These systems provide diverse types of data about learners interactions in digital environments and allow new insights into education. Such systems highlight the importance of data in education that is of interest to diverse actors for utilising learning analytics for educational management and policy [20]. However, from a research perspective, the aim of learning analyt-ics is to understand and optimise learning [123] and still a large part of learning takes place in face-to-face teaching activities. In this Part, we focus on the potential of learning analytics on providing insights about practice-based learning, in which small groups of learners create unique solutions to open-ended problems in face-to-face learning environments. Project-based learning activities are considered to have the potential to help educators achieve high tier institutional and policy goals such as developing 21st century skills in STEM subjects at scale. These activities, which often combine physical computing technologies with design principles in the con-text of computer science education, are increasingly popular in both secondary and postsecondary learning institutions [45]. To better accommodate learning in small groups, researchers use low-cost sensors, inexpensive computational power, and data from diverse sensors that include computer vision, audio, biometric, and data from
12
(a) (b) (c)
Figure 1: Graphic interface of the Integrated Development Editor (IDE) used to program the ARDUINO boards (a). ARDUINO boards physically connected (b). The final smart artefact produced by the learners (c).
the learning objects (like physical computing components or laboratory equipment) to collect data. The multimodal data from these sensors provides new opportunities for investigating learning activities in the real world between small groups of learners working on tasks with physical objects [10, 45].
It is important to remark that the PELARS project was not only about learning, but also about making. The project focused on how students manage to improve their proficiency in STEM activities when using both their heads and their hands. As a matter of fact, learners had to produce something physically tangible. In this regard, Figure 1 shows an actual example of one of the final artefacts produced by the students at the end of the learning sessions. The making of such an artefact requires reasoning and planning through the interaction with a software interface to devise a its specific algorithm, and, at the same time, it requires physical interaction with hardware components and mechanical parts in order to build a functioning ”smart” object.
Indeed, hands-on activities have always been one of the most important parts of science teaching, but we have not yet figured out how to model and how to analyse those practice in order to help teachers and to provide helpful feedback. The PELARS project tried to find ways of generating data and analysis of those data that can help teachers (and learners) by providing feedback from hands-on project-based and experimental learning situations.
In general, the importance of ”demonstrations” and laboratory sessions is well understood by teachers, although such activities are basically routed by ”tradition” and they are mainly unstudied. As a result, those experimental learning techniques
13
have an immeasurable value to the educational training of STEM practitioners. The PELARS project consists of three steps. First, take inspiration from the best STEM teachers. How they do what they do? How are they supported by their institutions? What are the values embodied by ”demonstration” and ”laboratory” in the individual learning process? Secondly, pass through an iterative process of prototype design and experiments tested and assessed with real learning environ-ments. In this phase we developed interactive kits for learning as well as furniture and interior design. Finally, bring the solutions developed during the second phase in real classrooms and workshop environments.
Key questions for the PELARS project included: in what ways does teaching through practice enable the best kinds and forms of STEM educational prospects? Can contextual computing, tracking and tracing technologies help empower teachers towards more hands-on STEM practices inside the classroom? Can these same tech-nologies show potential for bridging out-of-the-classroom learning with what goes on in taught environments? What new data analytics can be derived from the hands-on learning of STEM subjects? How could such data inform constructivist and practice-based learning models? What designs and physical interventions in the classroom can provide learning feedback to STEM learning in real-time, as well as after-the-fact for teachers, administrators and policy orientations? How might we provide STEM learning environments that are exciting and engaging as well as personalised and supportive?
The following sections of this chapter will highlight the potential solutions for some of the questions reported above. By way of example, Figure 2 outlines the general design principle inspiring the PELARS environments and workbench.
This part is articulated as follows. Chapter 1 describes the general design of the hardware software infrastructure needed to capture and safely store data acquired during PELARS trials. Chapter 2 reports some interesting facts deduced from the high level data captured by the software system. Mainly, which features (among the many collected by the senors of the PELARS system) are actually good discriminator of success in practice based tasks. Finally, Chapter 3 presents a study based on visual features and recurrent neural networks that represents a step towards the automatic assessment of physical collaboration of individual learners in practice based tasks.
14
Figure 2: An example workbench technology scenario for the PELARS project, high-lighting potential elements of system implementations (user centred design-developed through the project) for the creation of practice-based and experiential learning an-alytics for STEM subject matter.
Chapter 1
The Learning Analytics system
This Chapter presents an overview about the most relevant features of the Learning Analytic System (LAS) designed to capture multimodal data recorded during the progress of the PELARS project. As it will be highlighted in the next sessions, such a system tries to follow the principles described in the Introduction of this thesis. An HW/SW system located on site is in charge of capturing data, mostly acquired through a rig of video sensors, and to transform them in features significant for get-ting insights about the learning process, such as the distance between learners or the amount of their motion. Details about those features and their importance relative to the success of the learning process of practice based tasks will be reported in Chapter 2.
Then, a remote and powerful server is in charge of collecting both the raw data and the intermediate representations to produce learning traces which, based on the iden-tified metrics, can be employed, by the teacher, to better understand the learning process and, by the students, to document their work. The system can be used also in a ‘smart‘ way to recognize activities performed by students during their experi-ments using machine learning techniques on the acquired data [41].
This will highlight important events in the experiments and could give important insights to teachers about the learning process using custom visualizations like the one designed by Duval [32].
Previous work, [124], shows the importance and a↵ordability of such a system. It is important to remark that the target learning context is based on Arduino electron-ics projects at di↵erent levels, from high-school to graduate students. The di↵erent setups will be addressed by varying sensors and measured features.
This chapter is articulated as follows. Section 1.1 reports other attempts to devise
CHAPTER 1. THE LEARNING ANALYTICS SYSTEM 16
similar systems, Section 1.2 highlights the general system architecture, Section 1.3 reports the main aspects of the client HW and SW infrastructure, Section 1.4 reports the structure of the analytic server. Finally Section 1.5 reports an example of data acquired during a capturing session.
1.1
Background
Social Networks Adapting Pedagogical Practice (SNAPP) tools perform real-time so-cial network analysis and visualization of discussion forum activities within popular commercial and open source Learning Management Systems (LMS). LOCO-Analyst [54] is an educational tool aimed at providing teachers with feedback on the relevant aspects of the learning process taking place in a web-based learning environment. LOCO-Analyst provides feedback on the activities performed by students, the usage of the material and social interactions. LA e-Rubric [113] is a plugin for MOODLE [31] that realizes a grading method used for criteria based assessment. A more gen-eral LA can be found in GLASS [66] that tackles the di↵erent aspects of Learning Analytics (LA), spanning from data source management and processing to visualiza-tion.
The domain of project-lead learning requires to go beyond the traditional LA domain and investigate the statistics and pattern methods related to action and behavior un-derstanding when interacting in a real environment with real objects. Indeed, this chapter presents a new structure for supporting project-led activities and the pro-cessing for extracting learning traces.
1.2
General Design
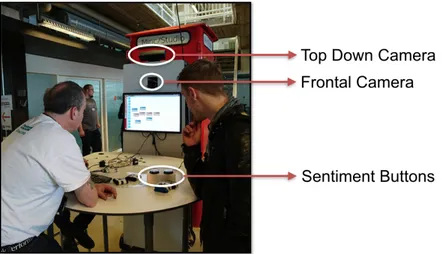
The system is composed by a single central server and a variety of remote clients. Each client is composed by a single computing machine and a series of sensors which interact with it, corresponding to a student (single or group) desk. A sensor can be a physical interface like a camera or a piece of software, gathering data from a remote resource, in any case related to the activity performed on the desk. The system is built in such a way that the array of acquisition sensors can be easily upgraded with new sensors depending on teachers needs. Figure 1.1 shows the actual rig of video sensors deployed on the physical client system.
The acquired information is meant to be initially processed locally for the purpose of reducing the bandwidth requirement and for removing any privacy-related issues, mainly associated to the camera systems. The data that is acquired is then sent to
CHAPTER 1. THE LEARNING ANALYTICS SYSTEM 17
Figure 1.1: Displacement of cameras and sentiment buttons in the PELARS table.
the remote server, unless the connection is absent, in which case it is cached locally and uploaded when the connection is available by intervention of the teacher. The remote server is in charge of storing the data, extract statistics, process new data from the raw acquisitions, extracts metrics for the LA and support visualization (See Figure 1.5 for example of visualization).
Given that the system can run at the same time a variety of client applications, each execution has to be identified by a unique value, called session id. A session identifies the execution of a client machine from a starting point to an end. All the gathered data is associated to that session along with the information of the creating user and starting and finishing time. Session duration depends on the teaching context, spanning from half an hour to few hours.
Workflow The general interaction of the teacher and students with the system is composed by the following steps:
1. The system is booted and, after logging in, the Arduino interface is started along with the client system which runs in background.
2. The system requests the server to open a new session and, if authorized, a new session is created on the server. The system will display a QR code to be used with the mobile application in order to synchronize the sessions.
3. The system starts to capture data from the di↵erent sensors and stores every-thing locally and remotely, if connection is available.
CHAPTER 1. THE LEARNING ANALYTICS SYSTEM 18
4. Students, teachers and researchers can upload multimedia content from a mo-bile app on their phone.
5. Students and teachers can get feedback from the system on how experiments are progressing.
6. The system is closed. A request to close the session is sent to the remote server. 7. The teacher logs out and the system is ready for a new session.
In the aftermaths of the session the teacher can look back at the session studying the progress of the data by visualization supported by LA processing.
Data Management Data management on the server is based on the concept of graphs of data streams. Each data stream is a time-index sequence of items of the same nature. The content of the streams can span from entities obtained from computer vision system (like hand positions) to logs of the Arduino IDE. Streams are grouped in sessions, and sessions are grouped in namespaces corresponding to the di↵erent teaching locations. The possible computations take streams and produce new streams, with algorithms spanning from basic statistics computation to more sophisticated machine learning based algorithms. In this way the streams create a flow graph that has the input data received from the client. The graph structure depends much on the types of analytics computed, and due to the fact that this is also a research platform, it is grounded on the principles of reproducible research. This means that at any time the system can clean up all the generated streams and restart from the input data applying a new set of operations. As happens in event-based management systems [23], computations can be applied when new data arrives, or o✏ine as batch process. Finally each stream is externally accessible for the purpose of creating Web visualizations, available both to students and teachers; according to the stream level of confidentiality.
1.3
Collection Service
This section discusses the features of the student-side component called Collector, which is in charge of capturing data from sensors, pre-process them and send them to the processing server. For the multimodal LA system being investigated, the Collec-tor deals with three types of information produced by students: the interaction in the physical world, the activity on the computer used for controlling Arduino electronics, and the self-documentation activity that is performed via mobile applications.
CHAPTER 1. THE LEARNING ANALYTICS SYSTEM 19
Physical Worlds The events in physical world comprise information captured from cameras (both Kinect2 and webcam), physical buttons and audio events. A computer vision module extracts di↵erent indicators of activity from the cameras, never sending out the full images. In particular, in the current prototype, the OpenCV library is used to identify the presence of faces in the scene for the purpose of understanding the number of students active at the desk. By asking students to wear a fiducial marker on the wrists, it is possible to identify the motion of the hands in the scene to measures activity. Finally object tracking is possible by using a RGB-D camera such as Kinect2 and modelbased algorithms such as LineMod [48]. The pose of the faces and hands is transformed from the camera reference frame to a table reference frame (e.g. with origin in a corner of the table with Z up) by means of a calibration computed when the cameras are installed. This way the presence and activity location information can be related to the table (e.g. moving away, working on something inside the table). This approach is not found in activity recognition and is specifically added to improve the understanding of students actions.
Additional information about the activity at the desk can be provided by physical buttons, like asking the teacher for help or giving feedback for the learning activity. Finally audio is being analyzed only for identifying if the students are talking during the project and if there is some activity. This is obtained by performing FFT over microphone data, filtering over interesting bands, and comparing against the back-ground. Only the audio power level is recorded, without discriminating over students or teachers voices.
Computer Activities During projectual work with Arduino electronics, the stu-dents interact with the computer by working in the Integrated Development Envi-roment (IDE) with the classic compile-run-debug cycles or with visual programming interfaces. Such integration is collected via instrumentation of the IDE and sent to the Collector software for assembling the analytics.
Self-Documentation The last source of information for the analytics system is self documentation, which is the capacity of the students to document their activity. This can be provided in several ways:
1. Taking a snapshot of the environment around the table 2. Taking a snapshot of the computer screen
CHAPTER 1. THE LEARNING ANALYTICS SYSTEM 20
In any case this is a voluntary action that allows the students to show the progress of their activity.
Implementation The Collector is implemented via a program running on a com-puter that is connected with the di↵erent information sources. This component uses sessions as the unit of processing, associating all the acquired data to it, even if there is no connection to the remote server. The Collector manages a variety of sensors (physical or virtual), processes the data coming from these sensors, and produces entities associated to di↵erent streams. These entities are then sent to the server for storage and analytics, if connected, otherwise stored locally for later upload.
In addition to device-based sources, the Collector supports various network sources for accommodating di↵erent services: UDP, push HTTP requests, get HTTP re-quests and WebSockets [34].
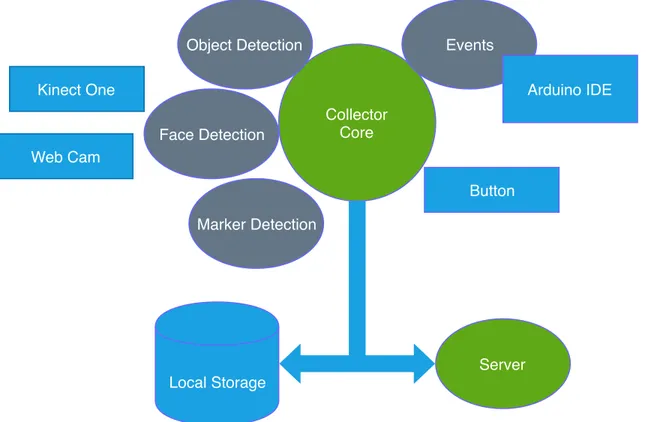
The nature of the processing and the connection with the server is mainly message based, and among the many message-based frameworks, this project has chosen to use one based on Web standards. Each stream item is a JSON entity, management exchanges (like session) are based on REST interfaces and data streaming occurs via WebSockets which provide, over HTTP, a message based channel. Figure 1.2 shows the overall structure with the data sources.
Internally the Collector uses multiple threads for addressing the sources, employ-ing the OpenCV [11] and Aruco [40] library for the computer vision tasks, with the help of GPU for fast face localization. In particular, the Collector is implemented in C++ and runs under Linux taking advantage of the ASIO library for asynchronous network communication. This choice is motivated by performance reasons and by the precise memory management possible with native languages.
The deployment of the Collector to the teacher locations (currently in three countries: Romania, United Kingdom, Sweden) is based on Docker containers [82]. Docker is a type of operating system virtualization on Linux that allows to isolate the appli-cation from the system without incurring in the penalties of virtualization. With proper configuration it allows the Collector to access both Kinect2 (USB3 device) and NVidia GPU directly.
1.4
Analytics Server
This section presents the characteristics of the LA server as discussed in the general design section. The specific implementation relies on the Java server frameworks, mainly due to the availability of libraries, tools and the strong typing of the language.
CHAPTER 1. THE LEARNING ANALYTICS SYSTEM 21 Collector Core Events Arduino IDE Button Object Detection Face Detection Marker Detection Kinect One Web Cam Server Local Storage
Figure 1.2: Structure of the Collector with the connection to the Server. Rectangles are data sources, ellipses computing elements.
A combination of features that make Java the golden standard for complex systems. Other options, like node.js would have been possible while keeping the external interface.
Core Structure The server software infrastructure is basically divided in two main parts: the WebSocket collector and the servlets. The WebSocket collector is a web application waiting for data to be sent in a websocket, which is a web transmission protocol requiring a connection between two partners. Websockets have been chosen as the protocol to exchange data from the client application to the server because they allow small overhead in case data exchange is perpetrated over a long period of time. Instead, servlets are a collection of operations directly exposed to any web user through a specific URL. Since such operations are Request-response operations, they are best supported by the connectionless and widespread HTTP protocol. Data storage is managed via MySQL, the most popular open source relational database
CHAPTER 1. THE LEARNING ANALYTICS SYSTEM 22
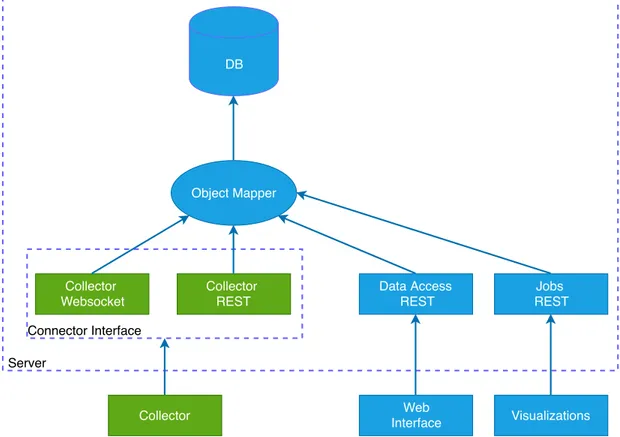
management system; Hibernate, which maps Java objects into MySQL entities, has been used to maintain a higher level of abstraction from the actual database, which can be easily replaced with another one. Figure 1.3 shows the structure of the server environment and outlines both the interaction with the client applications and with the database. DB Object Mapper Collector Websocket Collector REST Collector Data Access REST Jobs REST Web Interface Visualizations Connector Interface Server
Figure 1.3: Structure of the Collector-server LA system with the interfaces.
The LA web server also supports fixed and custom operations to manipulate data stored in the database, mainly streams, which are acquired during the learning ses-sions. Streams are intended as a sequence of data in time, acquired through the sensors or through the mobile application. Jobs are executed over the streams and produce as result new streams or single value results.
The system is designed in order to execute multiple tasks simultaneously using asyn-chronous requests.
Data Management and Operations LA data management may be divided in the following parts:
CHAPTER 1. THE LEARNING ANALYTICS SYSTEM 23
1. Database: handled by MySQL 2. Mapping: handled by Hibernate
3. Data manipulation: handled by the server collector and the REST APIs. Concerning point 3, it is necessary to specify that data obtained from the learning sessions are stored in the database by the Collector, while they can be read through a specific REST servlet by the client. Data not directly acquired by the sensors (e.g. users and sessions descriptions, multimedia contents) are managed with REST operations.
Data stream manipulation The LA server provides the facility of transforming the raw data acquired by the sensors during the learning sessions into streams, which are more suitable for data analysis. Such data manipulation is reachable to users or web client applications through two REST endpoints, that called for brevity reasons status and result. A client may submit a job capable of manipulating data by performing an HTTP PUT(status) request, which returns to the client a message containing the identification number i of the submitted job. The status of the very same job can be queried at any time performing an HTTP GET(status/i) request. Such status can be one of the following:
• executing: if job i is still in execution
• terminated: if job i has terminated and its result is properly stored
• queued: if job i has been submitted to the system but it has not yet started its execution
• failed: if job i has terminated its execution with an exception
In any case, the answer to the GET(status/i) will contain the date in which job i was submitted, while only in case of terminated status, it will contain also the execution time in milliseconds.
An HTTP GET request on endpoint result is needed to retrieve the results of a given job. The answer to the GET request depends on the job type: it can be a single value result or a stream.
For instance if job i asks to compute the average intensity value of the audio samples captured during session j, the result will be a single number, else if job i is asking for all the audio samples in session j having intensity I such that I > C, then the result will be a stream (a subset of the collected data).
CHAPTER 1. THE LEARNING ANALYTICS SYSTEM 24
In order to get the result of each job, the relational database provides the table Job table containing entities describing the status of each job and its result in case of single value result. There is also a table containing the results of the jobs (called Stream table), in case such results are streams. Each entity of Stream table contains the identifier of a data sample stored by the collector and the identifier of the job it relates to.
Any operation that can be provided by the server to manipulate the collected data is defined in a specific Java class implementing a common interface. Such a class exposes a run() method that must be implemented by any sub-class of it along with some basic information describing the job. The same abstract class exposes also the store result() method, which describes how to store the results of the run() computation in the database and the extract() method that describe how to fetch the input of the run() from the database.
The actual scheduling of the requested jobs is managed internally by a scheduler which is not visible to the users. The Scheduler class contains two data structures: a thread pool (of standard Java threads) and a First In First Out (FIFO) queue of jobs which have to be executed.
The thread pool is created and initialized before the server is deployed, and it is kept always alive. The threads belonging to the thread pool are called workers and the scheduler FIFO queue is shared by all of them. Each worker stays idle until a job is available in the job queue. As soon as a job is popped in reference op, the worker updates its state to executing and then calls the following line.
op.store result(op.run(op.extract()))
If an exception is thrown during the execution of the code above, the worker sets the status of the entity corresponding to the popped job to failed and stores the reason of the failure in the same entity.
If the computation terminates in a proper way, the worker simply sets the status to terminated; the results of the computation are stored according to the implemen-tation of the store result() method.
The framework provides multiple operations to compute various statistical values; it also provides some special operations, namely Pipeline and Map, which allow to modify the execution flow of the operations. The Pipeline allows to execute a sequence of operations one after the other avoiding to submit an HTTP PUT on status for each operation, whilst the Map allows to parallelize an operation over multiple data. Window size and overlap over windows are additional parameters to be passed in addition to the ones of the specific operation.
CHAPTER 1. THE LEARNING ANALYTICS SYSTEM 25
REST API The LA server exposes a REST interface for supporting data visu-alization, external processing and interoperability. First of all, any user willing to access the server’s resources has to register and authenticate himself. Registration must be done via the web server interface. The authentication is token based and each servlet accepts a request either if such a token is transmitted as a cookie or as an HTTP parameter.
We call the permission to write on resource r the possibility of performing PUT, DELETE and POST on endpoint r, whilst we call the permission to read on r the possibility of performing GET on endpoint r.
Each registered user is associated to a role (embedded and encrypted in the access token) that determines his read and write permission, stored in the server. For instance, an administrator can perform a DELETE on endpoint session whilst a researcher may only perform a GET on the very same endpoint.
In general each servlet endpoint responds to any HTTP request in JSON format, but it is also possible to visualize data in a more human readable form (in tables) through the web interface.
Higher-level processing The data processing scheme discussed above is the start-ing point for the e↵ective high-level learnstart-ing analytics processstart-ing that can give insights about the progress of students in projectual work. Higher level actions and activity recognition, and identification of patterns are possible in medium-level timescale, while longer-time scales allow for user profiling based on Bayesian methods or other machine learning techniques (See Chapter 2, 3).
1.5
Acquired Data
This section presents an example of session acquired using the presented system and involving di↵erent types of data: hands motion, faces, (acquired through video sensors), logging of Arduino operations and multimedia contents. It is also important to notice that single session has been divided in working phases by the teachers. Figure 1.4 shows a group of students in the process of making their assigned work at the PELARS table.
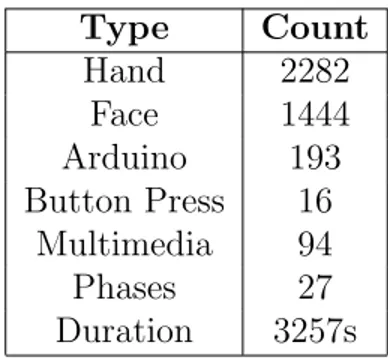
Table 1.1 shows a data example extracted from a real test scenario. Data types present the following information.
• Hand: represents a hand in the work space with a unique id and a 3D space position relative to a fixed point on the table.
CHAPTER 1. THE LEARNING ANALYTICS SYSTEM 26
Figure 1.4: Students working on the PELARS table while being monitored by the system. Type Count Hand 2282 Face 1444 Arduino 193 Button Press 16 Multimedia 94 Phases 27 Duration 3257s
Table 1.1: Data types present in the example session with the corresponding items
Type Count Text 57 Image 37
CHAPTER 1. THE LEARNING ANALYTICS SYSTEM 27
• Face: represents a face looking toward the camera (Arduino screen) along with its 3D position in space relative to the camera.
• Arduino logger: represents all the events which happened while programming with the Arduino IDE.
• Button presses: represents the moments when a special event happened. • Work phases: represents the beginning of a new phase of the experiment, added
by the instructor.
• Multimedia content: represents text, images, videos. In general it can represent any multimedia content.
• Audio content: represents the moment when a certain audio intensity level is exceeded. During this trial audio was disable.
Multimedia content is subdivided as shown in table 1.2. Figure 1.5 shows how the data is distributed in time. All data samples are acquired with a one second time interval which can be changed according to the experimenters need.
CHAPTER 1. THE LEARNING ANALYTICS SYSTEM 28 Fi gu re 1. 5: T h e fi gu re sh ow s th e sa m p le d d at a on a ti m eli n e, ga th er ed d u ri n g a te st se ss io n , gr ou p ed b y it em ty p e. T h e to p fi ll ed b ar co rr es p on d s to th e ov er al l se ss io n , b el ow th at th e p h as e d ec om p os it io n is re p or te d . F ac es p re se n ce is al m os t co n ti n u ou s. Ha n d id en ti fi ca ti on is p re se n te d w it h so m e d ot s, w it h on e ro w fo r ev er y d is ti n ct h an d ; th e b u tt on p re ss ro w ca n co n ta in a li gh b u lb as a p os it iv e fe ed b ac k fr om the st u d en ts , or a ligh ting b olt for ne gativ e fe edbac ks . T he lo w es t ro w s re fe r to m ultime dia con te n t. Of thos e, the upp er one s re p ort automa tic shots from the sc re en or came ras . T he lo w es t one s sho w m ultime dia submitte d bu stude n ts or teac hers through the mobile application.
Chapter 2
Estimation of Success in
Collaborative Learning Based on
Multimodal Learning Analytics
Features
In this chapter, we focus on the potential of the learning analytics system described previously on providing insights about practice-based learning, where small groups of learners create unique solutions to open-ended problems in face-to-face learning environments. More specifically, in our case, the learning environment is limited to a specially designed worktable, see Figure 2.1, 3.2, groups of learners are composed by three persons, and the open-ended task is the production of smart ”artefact” built with ARDUINO boards, Figure 1c.
Indeed, the ability to collect multimodal data from bodily movements, face track-ing, a↵ective sensors, log files from the hardware and software, user and research generated data seems to provide opportunities to obtain useful features for improve our understanding of the learning process. Through the use of multimodal learn-ing analytics platform that is part of the worktable, we collected diverse streams of data from learning activities. We processed and extracted multimodal interactions to answer the following question:
Which features of student group work are good predictors of team success in open-ended tasks with physical computing?
Potential answers to this question would enable to generate analytics to predict the success of groups based on multimodal features automatically. Such predictions
CHAPTER 2. ESTIMATION OF SUCCESS 30
are useful for both improving the awareness of students and practice of teachers to adjust their interventions. Finally understanding which features are significant for the success of the learning process in this context would help the design of future learning analytics systems.
2.1
Motivation
Project-based learning activities that support learners participation in open-ended tasks are one of the central teaching approaches in STEM education. These activi-ties emphasise the engagement of learners in projects that are personally meaningful, support engagement in authentic enquiry activities and are collaborative [86]. How-ever, the existing evidence about the impact of these approaches on learning is rare and one potential for this lack of evidence might be that the hands-on and open-ended nature of project-based learning creates challenges for tracking the learning processes. Moreover, often the value of such approaches is hard to measure with ex-isting standardised measurement methods [10]. More recently, Multimodal learning analytics (MMLA) provide opportunities to help address these challenges and ob-serve the evidence on expected learning outcomes of these complex pedagogies. This evidence and insights generated can be used to support students learning processes in these approaches and improve the practitioners practice.
Current research has focused on MMLA as a means to better understand the com-plexity of learning through the advances of high-frequency multimodal data capture, signal processing, and machine learning techniques [99]. There is an emerging body of work with MMLA to capture small group work on project-based learning that has grown out of the work of Blikstein and Worsley [9, 98]. Blikstein [8] explored multimodal techniques for capturing code snapshots to investigate students learning computer programming and video and gesture tracking for engineering tasks. This work o↵ers an opportunity to capture di↵erent insights about learning in tasks in which students have the opportunity to generate unique artefacts like computer pro-grams, robots, and collaborate in small groups to solve open-ended tasks. Worsley [145] presented di↵erent approaches for data integration and fusion and how these can have a significant impact on the relation of research and learning theories. These approaches provided the means for other researchers to begin to explore MMLA with small groups of students across di↵erent subjects. Grover and colleagues [44] have explored how to develop test computational models of social in collaborative prob-lem solving learning environments. Their approach has been to classify the quality of collaboration from body movement and gestures of pair programmers working together. Prieto and colleagues [106] and Martinez-Maldonado and colleagues [81]
CHAPTER 2. ESTIMATION OF SUCCESS 31
Figure 2.1: University engineering students working with the PELARS system
have focused their research e↵orts on how MMLA can support teaching actions and orchestration in the classroom. Drawing from the literature we can observe that MMLA has a role to play to support education in project-based learning through providing new means for gathering insights for complex open ended tasks [10].
2.2
System and Context
Data is gathered from the MMLA system described in Chapter 1, integrated with customised furniture. The learning contexts investigated are STEM education in high school; engineering and interaction design at universities. As a quick reminder, we point out that such system includes tracking hands, faces and other objects, meanwhile the Arduino platform with a visual web-based Integrated Development Environment (IDE) captures interaction information of physical computing tools. The learners and observers use mobile devices to capture multimedia data (text, im-ages, and video) to self-document the learning activities. The learning environment is designed to foster collaboration and includes an integrated screen and standing round table to allow learners to share and work together. Figure 2.1 shows the system ”in action”.
CHAPTER 2. ESTIMATION OF SUCCESS 32
2.3
Materials and Methods
The automatic approach discussed in this section is performed over a dataset acquired with students with the PELARS platform. In this section the data acquisition process is discussed, with the analysis performed based on machine learning classification.
2.3.1
Datasets
The data analysed in this work is from 3 sessions for each of the 6 groups made of 3 students studying engineering at a European University (average age 20 years old with 17 men and 1 woman), for a total of 18 sessions. Each student group used the system over 3 days completing one open-ended tasks in each session. The students were introduced to the system and then their first task was to prototype an interac-tive toy. The second task was the prototyping of a colour sorter machine, and the third task targeted an autonomous automobile. Each of the tasks introduced more complex concept to be solved with respect to the previous ones. Students have been asked to perform an initial phase of planning, followed by execution and finally a documentation phase. No specific instructions about the timing of these phases were given to students.
An observer split the session into these three phases based on personal judgment of the progress via the mobile tool.
To grade the sessions, a scoring scheme was developed that combined di↵erent ap-proaches for collaborative problem solving (CPS) in small groups.
We started with the seminal work done with engineering students [3] that was initially adopted by [145] for multimodal learning analytics. From these initial frameworks, we began to develop a framework for CPS [24] that we could apply on the PELARS context. We used a version of our CPS framework with the mobile system with an agreed set of codes for on-fly observations to initially grading of the students projects. A team of researchers then reviewed the students work collected in the LAS which included snapshots of the students plan, video of solutions, and learners text input. The 18 session were graded with these criteria, where 50% of the grade was the experts opinion, 25% was how the students planned and delivered the arte-fact, and the remaining 25% was the students own self-assessment. The resulting scores were categorised in three classes: bad, ok, and good equivalent to a Likert scale of 3 values.
Acquired Data For each session recorded, the LAS system collected data from the students comprising activity performed, user generated content (text and
multi-CHAPTER 2. ESTIMATION OF SUCCESS 33
media) and actions on the Arduino visual IDE. The following reports details about the various kind of collected data.
Face Tracking By means of a frontal camera and the Viola-Jones algorithm [142] the face of students was tracked, and then, thanks to camera calibration and as-sumptions about sizes, it was possible to estimate the distance of students from the camera. This means that the position of the face is computed in 3D coordinate with respect to a position on the table. Two metrics have been identified: the first is the count of Faces Looking at the Screen FLS, the second is the distance between the faces providing an indicator of Distance between Learners DBL. We hypothesise that the measure DBL can be seen as a proxy of collaboration, since when DBL is small it is more like that the collaboration would occur among students.
Hand Tracking A top down camera monitored the motion of the hands of the students that were wearing fiducial markers [40] that disambiguate each primary hand. Again, thanks to the calibration of the camera and the size of the markers the 3D position of the hands was obtained. The resulting metrics were the Distance between Hands DBH and the Hand Motion Speed HMS.
Arduino IDE The interface between the Visual Arduino IDE and the data col-lection system provided information about the types of physical and software blocks used in the project and their connections. In particular we counted the number of Active Blocks IDEC, the Variety of Hardware IDEVHW and Software Blocks used IDEVSW and the number of interconnections between blocks as a Measure of Complexity IDEX in students programming during their practice-based activities.
Audio Level By means of the microphone included in one of the cameras and Fast Fourier Transformation (FFT) we computed the sound level during the sessions. The resulting feature was a value sampled at 2Hz called Audio Level AUD.
2.3.2
Preprocessing
From all these MMLA data points the data was collected at variable data rates (around 2Hz), yet it was not synchronised. For this reason, we needed a processing stage that aggregates indicators from the di↵erent variables in windows of same duration. The aggregation performed was based on counting for most of the variables, except for the distance/proximity functions for which we employed averaging. Taking into account the di↵erent lengths of the sessions, we employed zero padding for
CHAPTER 2. ESTIMATION OF SUCCESS 34
sessions that were too short. In our investigation, the tested window sizes were 10,20 and 30 minutes and there was also the case of one single window for the whole session.
2.3.3
Methods
The approach proposed in this work is based on a supervised classification task that matches the observers scores. The purpose of this approach is to identify the data features that can support di↵erent score classifications (bad, ok, good). Among the di↵erent families of classifiers, we opted for the parametric ones namely Naive Bayesian (NB), Logistic Regression (LR) and Support Vector Machines with linear (SVML) and Gaussian kernel (SVMR). We avoided the non-parametric ones (Nearest neighbours) or decision threes with the purpose of reducing the overfitting e↵ect. In particular the Naive Bayesian is a simple classifier that employs a strong assumption about the feature, a condition that holds for most of the variables employed except for the ones related to the Arduino IDE. We decided not to use the ensemble of classifiers [62], as we would like to study the model behind these classifications as much as performing the classification itself.
We used cross-validation for understanding the e↵ect of di↵erent parameters such as window size and the inclusion of di↵erent phases. For each cross validation run, the training set has been re-sampled in order to have the same amount of samples per class.
The data acquired from the PELARS LAS was exported and then processed in Python using the sklearn [103] toolkit that provides state-of-the-art machine learn-ing techniques integrated with a common interface. The test of the classifiers was performed by varying the window size, the score (binary or original 3-level), the inclusion of the di↵erent phases (planning, building, and reflecting) and, most im-portantly, the e↵ect of features described above (FLS, DBL, DBH, HMS, IDEC, IDEVHW, IDEVSW, IDEX, AUD).
2.4
Results
The 18 session lasted between 33 and 75 minutes (median 63 min13) for a total activity time of 17 hours and 10 minutes. The teams scored with di↵erent patterns along the three sessions and Figure 2.2 shows the outcomes.
The phases annotated by the observer were quite variable: planning (11min10min), work (41min16min) and reflection (4min7min). Results of classifications are pre-sented in the next paragraphs.
CHAPTER 2. ESTIMATION OF SUCCESS 35 PWR PW W WR NB 0.8 0.8 0.6 0.75 SVML 0.6 0.75 0.75 0.8 SVMR 0.75 0.75 0.75 0.75 LR 0.6 0.75 0.5 0.6
Table 2.1: E↵ect of phase on accuracy in the inclusion of the classifier. P=Plan, W=Work, R=Reflect
2.4.1
Scoring
Figure 2.2: Scores of teams across sessions The three-level scoring (bad,ok,good)
posed difficulties to the classification ac-tivity and we needed to move to a bi-nary version in which we aggregated ok graded groups with good graded groups. For example, Naive Bayes and Support Vector Machines scores 0.8/0.75 accu-racy with a window of 30min and bi-nary classification, however this value decreases to 0.5 for a three-way classifi-cation. This is clearly not ideal, however in order to achieve better results we took this binary approach. We see this as the first step towards further more detailed classifications. For the rest of the
chap-ter, well focus on this binary classification between bad graded groups vs good and ok graded groups.
2.4.2
E↵ect of Phase
Across the di↵erent conditions, the selection of the phases used to train has a strong a↵ect on the capacity to recognise of the classifiers. For example, with a 30min window and binary classification, the exclusion of reflection (PWR) phase in student activities, provided stronger results across the di↵erent classifiers, while the exclusion of both planning and reflection reduced the classification power. See Table 2.1.
In order to provide the most reliable results and use the strongest classification power, for the rest of the section, we focus our results on planning and working stages
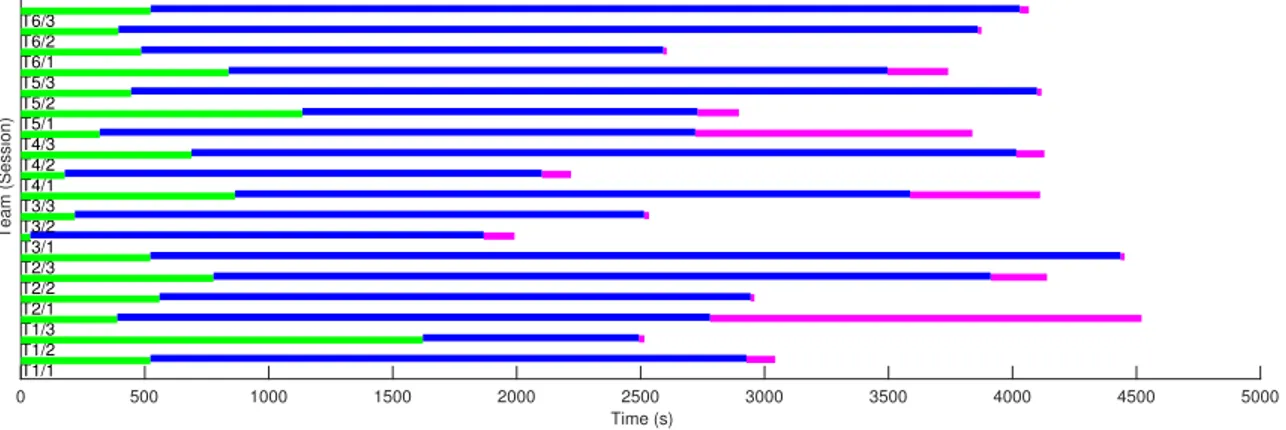
CHAPTER 2. ESTIMATION OF SUCCESS 36 0 500 1000 1500 2000 2500 3000 3500 4000 4500 5000 Time (s) Team (Session) T1/1 T1/2 T1/3 T2/1 T2/2 T2/3 T3/1 T3/2 T3/3 T4/1 T4/2 T4/3 T5/1 T5/2 T5/3 T6/1 T6/2 T6/3
Figure 2.3: Duration of phases across sessions. Green: plan, work: blue, reflect: pink.
of the students’ activities and excluding the reflecting stages. The interested reader can look at Figure 2.3 to see the distribution of phases across the sessions.
2.4.3
Type of Classifiers
As can be seen in table 2.1, across the di↵erent tests the classifier, those behaved the most consistently were NB and the SVM with linear kernel.
2.4.4
E↵ect of Features
Having established the window size through preliminary experiments (30 mins), grade classifications (bad vs. ok and good ones), learning activity stages (plan-ning and building), and the statistical methods we will use (NB and SVML), we now present the results of our analysis on the e↵ect of the learning analytics features. We start from the full set of features with a given selection of the other parameters mentioned above and we proceed removing features, as a form of model selection.
Regarding the e↵ects of the multimodal learning analytics features on predicting students group performances, results are reported below.
• IDEC (Arduino IDE) removal does not a↵ect the result of the classifier • Removal of all face and hand duration has very little e↵ect on the classifiers
CHAPTER 2. ESTIMATION OF SUCCESS 37
• Distance measures DHB and DBL alone are capable of predicting the results with a high accuracy (0.75) across classifiers
• Audio level feature AUD alone is a strong feature for classification (1.0 with Naive Bayes) with time windows 5min,10min and 30min and binary scoring. Interestingly the logistic regression is capable of an optimal result (1.0) when considering IDEX, IDEVHW, IDEVSW, and DBL, which are the main IDE features, except component counts.
2.5
Discussion
In this chapter, we processed and extracted multimodal learning analytics features to identify which features of student group work are good predictors of team suc-cess in open-ended tasks with physical computing. As an independent variable we used human judgement of the quality of students group work. We initially focused on identifying the di↵erent phases of work in relation to accuracy in predicting the group success. We found that the planning and building stages of students learning activities are better predictors of their success than the reflection stage. Then, we investigated the certain features of the MMLA, in order to determine which fea-tures can predict the group success with higher accuracy. Our results show that the Distance between Hands DBH hands and Distance between Learners DBL are key features to predict students performances in practice-based learning activities. In our case, they highly correlate with the performance of the students in practice-based learning. These results are aligned with existing MMLA research findings that show the potential of hand motion and speed, and the location of the learners to predict student success at various learning outcomes [8, 98, 44]. Figure 2.4 shows the distance along time in four sessions.
The other features of MMLA such as Hand Motion Speed HMS, Faces Looking at the Screen FLS did not perform very well to predict students group performances across the classifiers. While the Number of Active Blocks IDEC, the Variety of Hardware IDEVHW and Software Blocks used IDEVSW and the number of inter-connections between blocks as a Measure of Complexity IDEX were able to predict students group performances, IDEC alone was only marginal across the classifiers. Furthermore, the audio signal level AUD appears to be a promising feature to pre-dict performance, however more investigation is needed for using this feature in combination with others.
Figure 2.5 shows an example of four sessions, top one are good graded and lower one are bad graded session.
CHAPTER 2. ESTIMATION OF SUCCESS 38
Figure 2.4: Example of face distance in four sessions (top two are good and ok sessions, bottom two are bad ones)
Figure 2.5: Audio level across session (top one is a good session and bottom one is a bad session)
CHAPTER 2. ESTIMATION OF SUCCESS 39
One of the main limitations of our approach is on the scoring of the sessions that is limited to a binary classification with respect to a richer 3 level human scoring. In a possible future research, it could be planned to extend observer scale so that it comprises more levels of judgment or multiple criteria for student interaction actions to create the training sets.
Chapter 3
Collaboration Analysis of
Students’ Physical Interaction
Based on Neural Networks and
Body Pose
Until now, this work has shown how to retrieve meaningful features from an MMLA system that are exploited in order to infer success of students performing open ended task with physical computing. We also showed which of those features are good dis-criminators for success. By the way, the features analyzed until now do not belong to an high level of abstraction, since they are strictly related to visual (distance between learners, position of hands and faces) or audio perception (audio power level) and they are aggregated in time with simple operation such as counting or averaging. The purpose of this chapter is instead to higher the level of abstraction by showing a technique that can derive an abstract measure strictly correlated to the Collabora-tive Problem Solving (CPS) abilities of learners, by exploiting only the video sensors available in the PELARS LAS.
The significance of CPS is highlighted in recent reports that show the rising im-portance of working with other agents, both people and machines, to solve com-plex problems [77], and by policy-makers and world’s influential organizations like the Organisation for Economic Co-operation and Development (OECD). Due to the constant change happening in modern working contexts, and its increasing pace, one of the fundamental needs for the workers of the future is to be e↵ective collabora-tive problem solvers [67]. These skills look set to be increasingly relevant not just to many of the jobs that will survive new waves of automation, but also to our ability to
CHAPTER 3. COLLABORATION ANALYSIS 41
cope in everyday life [77]. On the other hand, looking at our education systems and schools, only a small percentage of our students appear to be exposed to high quality collaborative problem-solving, and receive training in the cognitive and social com-petences required for its e↵ective implementation [5]. Providing appropriate support for each students in CPS is an extremely challenging task for teachers. However, the system described in Chapter 1 seems to o↵er novel methods that generate distinctive information about what happens when students are engaged in these activities [144]. The work of Cukurova et al. [27] is our baseline to extract meaningful features re-garding CPS skills. Their work proposes an original framework to potentially iden-tify observable and objective di↵erences in students’ CPS behaviours in open-ended, practice-based learning environments.
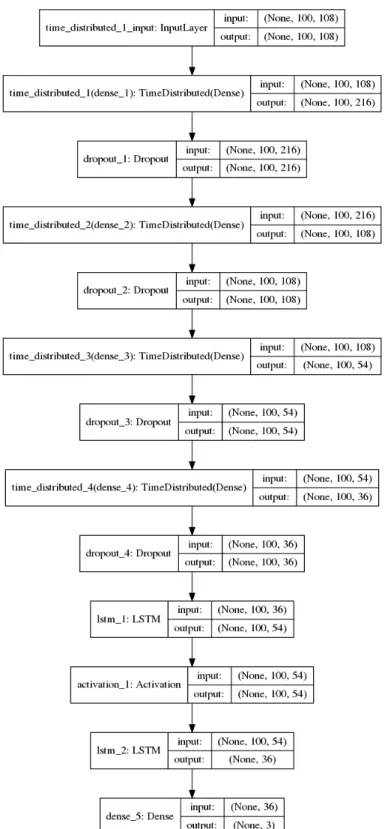
The purpose of this chapter is to present our computer vision and recurrent neural network (RNN) approach used to automate the suggested framework. This is an ini-tial attempt to objectively and systematically monitor and evaluate students’ CPS competences based on the automated observation of students’ physical interaction in practice-based learning environments.
The chapter is structured in the following way. Section 3.1 describes the broad research background and presents other works carried out in the field of CPS analysis with machine learning approaches. Section 3.2 explains the approach that has been followed in order to automate the estimation of the quality of CPS skills. Section 3.3 explains the experiment performed to validate our approach together with the results. Section 3.4 discusses the results and section 3.5 summarizes the approach and reports some conclusions about the impact of research undertaken here as well as the relevance of this work to educational technology community.
3.1
Background
The work described in this Chapter can be inserted in the field of research called social signal processing, which is considered a subset of the field of a↵ective computing. The area of social signal processing focuses on investigating how human social and cultural information can be used in order to improve the machine algorithms. Social signal processing has great potential to bridge the gap between human and machine observable features of complex social phenomena that include collaborative problem-solving [25]. The intention of this signal processing is to interpret behaviours in social and cultural contexts providing new ways to understand collaboration between the di↵erent actors [140].
CHAPTER 3. COLLABORATION ANALYSIS 42
social signal processing literature (see [139] for an extensive review). However, to the best of our knowledge, there is no previous attempt to automatically interpret and investigate collaborative problem-solving competencies from video data only. This is significant as video cameras have a relatively less obtrusive nature when compared to eye tracking, Microsoft Kinect, fiducial markers, virtual and augmented reality headsets type of technologies. Therefore, their adoption in real world learning and teaching settings is more likely.
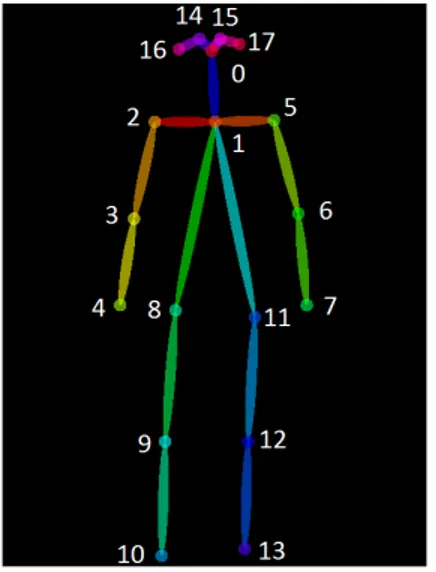
In terms of purpose, the closest work we have identified is the preliminary work completed by Grover et al. [44] who studied the quality of collaboration in pair programming by means of a Multimodal Analytics approach that combined gaze tracking and basic body positions collecting data from Microsoft Kinects and lap-top mounted cameras. The system was able to extract a set of first order static and dynamic handcrafted skeleton features using the 13 joints from the upper body. The authors trained a Support Vector Machine based classifier to perform classifi-cation and were able to classify high, medium, low level of collaboration with 44% accuracy, compared to the random allocation of 33% accuracy. On the other hand, technically, in terms of investigating the potential of video data to make sense of stu-dents’ complex behaviours in learning environments, Raca et al.’s [107] work presents similarities to our approach. In their work, the authors investigated the head mo-tions of students from video data in order to interpret and measure their level of attention. Although, technically we find this work relevant and interesting, con-ceptually we were mainly influenced by the literature that involved the design and implementation of technology in order to assess the quality of the collaboration in digital learning environments.
For instance, some works have been made concerning speech interaction in on-line collaborative problem solving contexts. Hao et al. [52] have developed an auto-matic annotation system for conversation in collaborative problem solving activities while Prata et al. [29] have developed a model to investigate features in dialogue interactions based on students di↵erences in understanding from their speech proto-col. Another important strand of work exploits eye trackers to study collaborative learning situations. For instance, Richardson and Dale [112] found that the degree of gaze recurrence between individual speakerlistener dyads (i.e., the proportion of times that their gazes are aligned) is correlated with the listeners accuracy on com-prehension questions. Jermann et al. [51] used synchronized eye-trackers to assess how programmers collaboratively worked on a segment of code; they contrasted a good and a bad dyad, and their results suggested that a productive collaboration is associated with high joint visual recurrence. In another study, N¨ussli [97] showed that eye-tracking data can be integrated with other measures to build models of