Downloaded from http://journals.lww.com/jaids by BhDMf5ePHKav1zEoum1tQfN4a+kJLhEZgbsIHo4XMi0hCywCX1AWnYQp/IlQrHD3i3D0OdRyi7TvSFl4Cf3VC4/OAVpDDa8K2+Ya6H515kE= on 11/02/2020 Downloadedfrom http://journals.lww.com/jaidsby BhDMf5ePHKav1zEoum1tQfN4a+kJLhEZgbsIHo4XMi0hCywCX1AWnYQp/IlQrHD3i3D0OdRyi7TvSFl4Cf3VC4/OAVpDDa8K2+Ya6H515kE=on 11/02/2020
Drop in CD4
+
Counts Below 200 Cells/
mL After Reaching
(or Starting From) Values Higher than 350 Cells/
mL
in HIV-Infected Patients With Virological Suppression
Nicola Gianotti, MD,* Giulia Marchetti, MD,
† Andrea Antinori, MD,‡ Annalisa Saracino, MD,§
Andrea Gori, MD,
k Giuliano Rizzardini, MD,¶ Miriam Lichtner, MD,# Alessandra Bandera, MD,k
Cristina Mussini, MD,** Enrico Girardi, MSC,
†† Antonella d’Arminio Monforte, MD,† and
Alessandro Cozzi-Lepri, MSC,
‡‡ on behalf of the ICONA Foundation Study Group
Background:The aim of the study was to quantify the risk of a drop
in CD4+counts below 200 cells/mL after reaching values .350 cells/mL
on antiretroviral therapy (ART) (or after starting ART with CD4+count
.350 cells/mL) in the absence of virological failure.
Setting:Ambulatory care services, Italy.
Methods: Prospective cohort study of patients enrolled in the
ICONA Foundation Study cohort who started ART with .350
CD4+/mL or with #350 CD4+/mL and reached values .350 cells/
mL after virological suppression (VS, defined by 2 consecutive
viral loads#50 copies/mL). The date of CD4 count .350 was the
baseline for the analysis and those with$1 viral load and CD4+
count after baseline were included. The primary end point was the
cumulative risk (estimated using the Kaplan–Meier method) of
a CD4+ drop below 200 cells/mL over follow-up, which was
censored at the date of virological failure (confirmed HIV-RNA .50 copies/mL), death, or last visit.
Results:Six thousand six hundred sixty-three patients were included.
A confirmed CD4+drop below 200 cells/mL was never observed over
a median follow-up of 45 (Q1: 21, Q3: 89) months, as long as VS was maintained. Upper limits of the 97.5% confidence interval of rates of
confirmed CD4+ drop below 200 cells/mL were 0.28 and 0.38/1000
person-years of follow-up for patients with#350 and .350 CD4+cells/
mL at starting ART.
Conclusions:In patients who started ART in Italy with.350 CD4+
cells/mL or reached .350 CD4+cells/mL after VS, the risk of a CD4+
drop below 200 cells/mL in those maintaining VS was negligible.
Key Words: CD4+cells count, CD4+count dipping, CD4+count
monitoring, virological suppression, antiretroviral therapy (J Acquir Immune Defic Syndr 2017;76:417–422)
INTRODUCTION
CD4+T-lymphocyte count is the strongest predictor of disease progression in HIV-infected patients, and prophylaxis of opportunistic infection is recommended when it drops below 200 cells/mL.1–6Frequent CD4+cell count monitoring has been highly recommended for many years, but the utility of monitoring has been recently debated.7,8 In HIV-infected people receiving antiretroviral therapy (ART), CD4+ counts tend to increase or remain stable as long as viral replication is controlled,9–12 and clinical events very infrequently occur after ART introduction.10,13 Furthermore, there are no treatment strategies to increase CD4+ cell count during
Received for publication April 13, 2017; accepted July 19, 2017.
From the *Malattie Infettive, IRCCS San Raffaele, Milano, Italy;†Dipartimento di Scienze della Salute, Clinica Malattie Infettive e Tropicali, ASST Santi Paolo e Carlo, Milano, Italy; ‡Area Dipartimentale HIV/AIDS, Istituto Nazionale per le Malattie Infettive L. Spallanzani IRCCS, Roma, Italy; §Clinic of Infectious Diseases, Univesity of Bari, Bari, Italy; kClinic of Infectious Diseases, “San Gerardo” Hospital-ASST Monza, University Milano-Bicocca, Milano, Italy; ¶Malattie Infettive, ASST Fatebenefratelli Sacco, Milano, Italy; #Department of Public Health and Infectious Disease, Malattie Infettive, Sapienza University of Rome, polo Pontino, Roma, Italy; **Malattie Infettive, Università degli Studi, Policlinico di Modena, Modena, Italy; ††Unitá di Epidemiologia Clinica, Istituto Nazionale per le Malattie Infettive L. Spallanzani IRCCS, Roma, Italy; and‡‡Infection and Population Health, Institute of Global Health, University College London, London, United Kingdom.
ICONA Foundation is sponsored by unrestricted educational grants of Abbvie, BMS, Gilead, Jannsen, MSD, ViiV, Italy. The funders had no role in study design, data collection and analysis, decision to publish, or preparation of the manuscript.
N.G. conceived the work, followed patients, contributed to data analyses, and wrote the manuscript since thefirst draft. G.M. conceived the work, followed patients, contributed to data analyses, and contributed to the writing of the manuscript. A.A. followed patients, contributed to data analyses, and contributed to the writing of the manuscript. A.S. followed patients, contributed to data analyses, and contributed to the writing of the manuscript. A.G. followed patients and contributed to the writing of the manuscript. G.R. followed patients and contributed to the writing of the manuscript. M.L. followed patients, contributed to data analyses, and contributed to the writing of the manuscript. A.B. followed patients, contributed to data analyses, and contributed to the writing of the manuscript. C.M. followed patients, contributed to data analyses, and contributed to the writing of the manuscript. E.G. contributed to data analyses and to the writing of the manuscript. A.d.M. followed patients, contributed to data analyses, and contributed to the writing of the manuscript. A.C. performed the statistical analyses and contributed to the writing of the draft of the manuscript.
The authors have no funding or conflicts of interest to disclose.
The complete membership of the author group can be found in the Acknowledgments.
Supplemental digital content is available for this article. Direct URL citations appear in the printed text and are provided in the HTML and PDF versions of this article on the journal’s Web site (www.jaids.com). Correspondence to: Nicola Gianotti, MD, Malattie Infettive, Ospedale
San Raffaele, Via Stamira d’Ancona 20, 20127 Milano, Italy (e-mail: [email protected]).
periods of viral suppression. A CD4+count drop below 200 cells/mL is currently seldom observed during successful ART,14–17 and frequent testing may cause unnecessary anxiety in patients with clinically inconsequential fluctua-tions. Therefore, the utility of their monitoring has become a matter of debate.7,8,17 Indeed, the treatment decision a clinician can take in response to CD4+ monitoring is to start (or restart) prophylaxis of opportunistic infections when counts drop below 200 cells/mL1–4 or, in clinical settings where viral load testing is not routinely implemented, to prescribe viral load testing.18In this context, some guidelines recommend optional or stop monitoring CD4+ cell counts once virological suppressions (VS) are sustained, and the immunological status is stabilized.1,3,18
There are no randomized comparisons of individuals following different CD4+count monitoring strategies as they are difficult to be performed, and although it is well established that CD4+ cells falling below 200 cells/mL occur infrequently while viral load is suppressed,14–17,19 robust estimates of CD4+ cells dropping below 200 cells/mL over long follow-up are limited. Furthermore, relevant differences might emerge when comparing data collected in countries with different organizations of the social health system.
The aim of this analysis was to quantify the probability of a drop in CD4+counts below 200 cells/mL after reaching values .350 cells/mL on ART (or when starting ART with CD4+ count .350 cells/mL) in the absence of virological failure (VF), in a cohort of Italian HIV-infected patients.
METHODS
The ICONA Foundation Study (ICONA) is a multicen-ter prospective observational study of HIV-1–infected adult patients, which was set up in 1997. Eligible patients are those starting ART when they are naive to antiretrovirals, regardless of the reason. The ICONA Foundation Study has been approved by IRB of all the participating centers; sensitive data from patients are seen only in aggregate form. All pa-tients signed a consent form to participate in ICONA, in accordance with the ethical standards of the committee on human experimentation and the Helsinki Declaration (1983 revision). Demographic, clinical and laboratory data, and information on therapy are collected for all participants and recorded using electronic data collection [www.icona.org].
CD4+monitoring in cohort participants is performed at least twice yearly, according to the study protocol and the Italian guidelines.2 Antiretroviral regimens used by the studied patients were not predefined by the study protocol (which is strictly observational) but were prescribed accord-ing to the current Italian guidelines.2
VS was defined as having achieved on 2 consecutive occasions a viral load #50 copies/mL. Participants could be included in this analysis if they belonged to 2 distinct inclusion criteria group:first, participants who started ART with a CD4+ count .350 cells/mL; second, participants who started ART with#350 CD4+/mL, achieved VS on therapy and whose CD4+ count subsequently increased to a value .350 cells/mL. In patients who started ART with .350 CD4+/mL, baseline was defined as the date of VS after at least 6 months since initiation
of ART. In those who started ART with #350 CD4+/mL, baseline was the date of first achieving a CD4+ value .350 CD4+/mL after VS. For both groups, we insisted on people to have at least 1 VL and CD4+count assessed after baseline.
Viral load was assessed in each center according to local procedures. Yearly change in CD4+ cell counts after baseline were estimated byfitting a linear mixed model with random intercept and slope.
The primary end point was the cumulative risk of a confirmed CD4+drop below 200 cells/mL over follow-up, defined as 2 consecutive counts below 200 cells/ml (confirmed drop). We also evaluated a secondary end point defined using a single count below 200 cells/mL (unconfirmed drop). Participants’ time at risk was censored at the date of VF (defined as a confirmed HIV-RNA .50 copies/mL), death, or last clinical visit. The Kaplan–Meier method was used to estimate the cumulative risk of CD4+ dropping below 200 cells/mL over time. The 97.5% upper limit of the confidence interval (CI) was calculated using a normal approximation. All analyses were repeated also using an alternative definition of viral rebound (with a cutoff of 400 copies/mL instead of 50 copies/mL).
All analyses were performed using SAS version 9.4 (SAS Institute, Cary, NC).
RESULTS
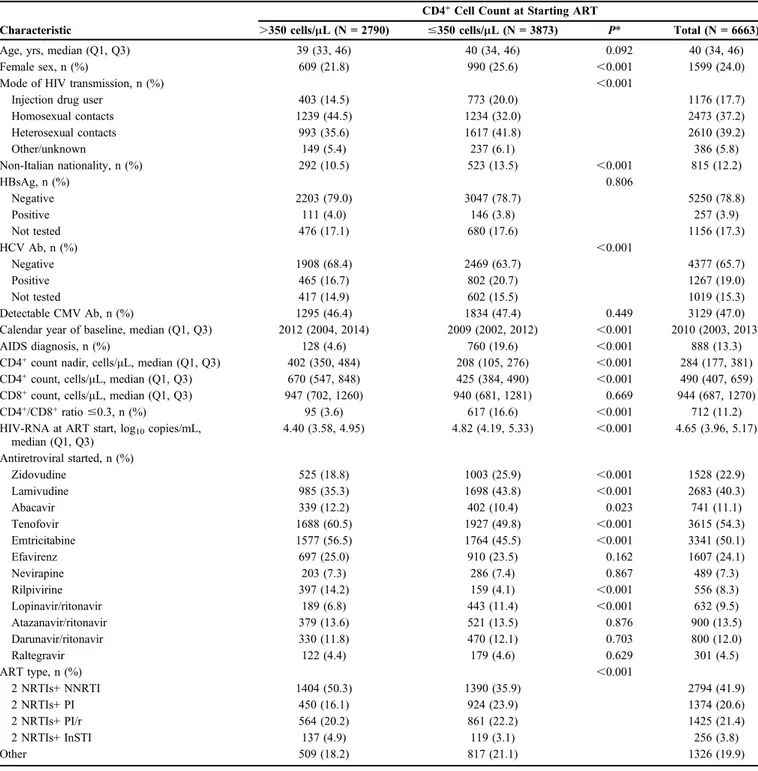
Six thousand six hundred sixty-three adult patients were included in the analysis (Table 1). The main differences between patients who started ART with,350 CD4+/mL and those who started ART with .350 CD4+/mL regarded sex, risk factor, nationality, CD4+ nadir, CD4+/CD8+ ratio, hepatitis C virus co-infection, and HIV-RNA load.
Over a median (Q1, Q3) follow-up of 45 (21, 89) months, new AIDS-defining events occurred in 124 (2%) patients, serious non-AIDS defining20 in 306 (5%), death in 153 (2%; 21 AIDS related, 132 non-AIDS related), and VF in 1796 (27%). The median (Q1, Q3) CD4+count at the time the AIDS-defining events occurred was 458 (228, 671) cells/mL. The median (interquartile range) CD4+measurements over follow-up was 5 (2, 12), for an average of 2.6 (2.0, 3.4) measurements per year, and the median of prospective HIV-RNA measurements was also 5 (2, 11), for 2.6 (2.0, 3.4) measurements per year.
Baseline CD4+ cell count was 646 (611, 682)/mL in patients who started ART with#350 CD4+/mL and 757 (708, 807)/mL in those who started ART with .350 CD4+/mL [difference: 110.9 (95% CI: 50.4 to 171.5) cells/mL; P , 0.001]. Estimated yearly changes in CD4+ cell counts were +27.44 (-18.2, +73.12) cells/mL in patients who started ART with#350 CD4+/mL and +31.99 (-8.83, +72.81) cells/mL in those who started ART with .350 CD4+/mL [difference: +4.55 (-56.5, +65.64) cells/mL; P = 0.884] (Supplemental Digital Content Figure, http://links.lww.com/QAI/B72).
A confirmed CD4+drop below 200 cells/mL was never observed over the time of the study; unconfirmed CD4+drops below 200 cells/mL occurred in 9 patients, and no clinical events were observed at the time of occurrence. The Kaplan– Meier estimate of the cumulative risk of unconfirmed drop
below 200 cells/mL was 0.24% (95% CI: 0.07 to 0.40) by 4 years from baseline; no further events were observed over the following 9 years, and 249 individuals were still at risk by 12 years after baseline. Upper limits of the 97.5% CI of rates of
confirmed CD4+drop below 200 cells/mL were 0.28 and 0.38/ 1000 person-years of follow-up (PYFU) for patients with #350 and .350 CD4+ cells/mL at ART start, respectively. Upper limits of the 97.5% CI of rates of confirmed CD4+drop
TABLE 1. Main Characteristics of Patients at Starting Antiretroviral Therapy, by Baseline CD4+Count Group
Characteristic
CD4+Cell Count at Starting ART
.350 cells/mL (N = 2790) #350 cells/mL (N = 3873) P* Total (N = 6663)
Age, yrs, median (Q1, Q3) 39 (33, 46) 40 (34, 46) 0.092 40 (34, 46)
Female sex, n (%) 609 (21.8) 990 (25.6) ,0.001 1599 (24.0)
Mode of HIV transmission, n (%) ,0.001
Injection drug user 403 (14.5) 773 (20.0) 1176 (17.7)
Homosexual contacts 1239 (44.5) 1234 (32.0) 2473 (37.2) Heterosexual contacts 993 (35.6) 1617 (41.8) 2610 (39.2) Other/unknown 149 (5.4) 237 (6.1) 386 (5.8) Non-Italian nationality, n (%) 292 (10.5) 523 (13.5) ,0.001 815 (12.2) HBsAg, n (%) 0.806 Negative 2203 (79.0) 3047 (78.7) 5250 (78.8) Positive 111 (4.0) 146 (3.8) 257 (3.9) Not tested 476 (17.1) 680 (17.6) 1156 (17.3) HCV Ab, n (%) ,0.001 Negative 1908 (68.4) 2469 (63.7) 4377 (65.7) Positive 465 (16.7) 802 (20.7) 1267 (19.0) Not tested 417 (14.9) 602 (15.5) 1019 (15.3) Detectable CMV Ab, n (%) 1295 (46.4) 1834 (47.4) 0.449 3129 (47.0)
Calendar year of baseline, median (Q1, Q3) 2012 (2004, 2014) 2009 (2002, 2012) ,0.001 2010 (2003, 2013)
AIDS diagnosis, n (%) 128 (4.6) 760 (19.6) ,0.001 888 (13.3)
CD4+count nadir, cells/mL, median (Q1, Q3) 402 (350, 484) 208 (105, 276) ,0.001 284 (177, 381)
CD4+count, cells/mL, median (Q1, Q3) 670 (547, 848) 425 (384, 490) ,0.001 490 (407, 659)
CD8+count, cells/mL, median (Q1, Q3) 947 (702, 1260) 940 (681, 1281) 0.669 944 (687, 1270)
CD4+/CD8+ratio#0.3, n (%) 95 (3.6) 617 (16.6) ,0.001 712 (11.2)
HIV-RNA at ART start, log10copies/mL,
median (Q1, Q3) 4.40 (3.58, 4.95) 4.82 (4.19, 5.33) ,0.001 4.65 (3.96, 5.17) Antiretroviral started, n (%) Zidovudine 525 (18.8) 1003 (25.9) ,0.001 1528 (22.9) Lamivudine 985 (35.3) 1698 (43.8) ,0.001 2683 (40.3) Abacavir 339 (12.2) 402 (10.4) 0.023 741 (11.1) Tenofovir 1688 (60.5) 1927 (49.8) ,0.001 3615 (54.3) Emtricitabine 1577 (56.5) 1764 (45.5) ,0.001 3341 (50.1) Efavirenz 697 (25.0) 910 (23.5) 0.162 1607 (24.1) Nevirapine 203 (7.3) 286 (7.4) 0.867 489 (7.3) Rilpivirine 397 (14.2) 159 (4.1) ,0.001 556 (8.3) Lopinavir/ritonavir 189 (6.8) 443 (11.4) ,0.001 632 (9.5) Atazanavir/ritonavir 379 (13.6) 521 (13.5) 0.876 900 (13.5) Darunavir/ritonavir 330 (11.8) 470 (12.1) 0.703 800 (12.0) Raltegravir 122 (4.4) 179 (4.6) 0.629 301 (4.5) ART type, n (%) ,0.001 2 NRTIs+ NNRTI 1404 (50.3) 1390 (35.9) 2794 (41.9) 2 NRTIs+ PI 450 (16.1) 924 (23.9) 1374 (20.6) 2 NRTIs+ PI/r 564 (20.2) 861 (22.2) 1425 (21.4) 2 NRTIs+ InSTI 137 (4.9) 119 (3.1) 256 (3.8) Other 509 (18.2) 817 (21.1) 1326 (19.9)
*Chi-square or Kruskal–Wallis test as appropriate.
CMV Ab, antibodies anti–cytomegalovirus; HBsAg, hepatitis B surface antigen; HCV Ab, antibodies anti–hepatitis C virus; InSTI, integrase strand transfer inhibitor; NNRTI, nonnucleoside reverse transcriptase inhibitor; NRTI, nucleoside reverse transcriptase inhibitor; PI/r, protease inhibitor boosted with ritonavir; PI, unboosted protease inhibitor.
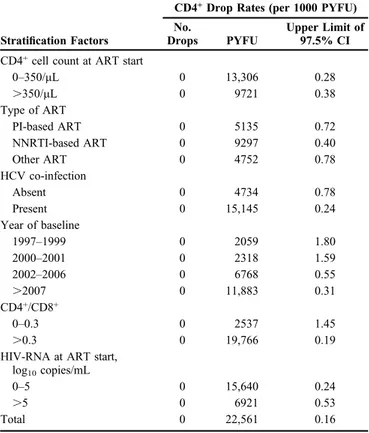
below 200 cells/mL according to type of ART started, hepatitis C virus co-infection, calendar year of baseline, baseline CD4/CD8 .0.3 or #0.3, and time from HIV diagnosis and HIV-RNA at ART start . or #5 log10 copies/mL are shown in Table 2. Of note, all these upper limits were below 2.0 per 1000 PYFU. Only patients with calendar year baseline between 1997 and 2001 and those with a CD4+/CD8+#0.3 at ART start had an upper limit that was .1 per 1000 PYFU. Results were similar when viral rebound was defined using the more conservative threshold of 400 copies/mL for the definition of VF (data not shown).
DISCUSSION
We investigated the risk of CD4+drop below 200 cells/ mL in patients who started ART with .350 CD4+cells/mL or reached .350 CD4+ cells/mL after VS, and no events drop was observed over a median follow-up of approximately 4 years, as long as VS was maintained. Even in the worst case scenario, in which the true value for the incidence is equal to the upper limit of the 97.5% of the CI, this incidence of a drop ,200 cells/mL was between 1 and 2 per 1000 PYFU. This estimate is consistent with that previously found elsewhere. In another analysis of a cohort of 1820 HIV-infected patients, those with HIV-1 RNA ,200 copies/mL and CD4+ counts $300 cells/mL had a 97% probability of maintaining durable
CD4+ counts $200 cells/mL for 4 years.14 Similarly, in the ARTEMIS trial, only 1% of 449 patients with sustained HIV-1 RNA suppression below 400 copies/mL experienced a CD4+ count drop below 200 cells/mL on 2 consecutive visits.15 In 7250 patients in South Africa, after 10 years of ART, 93% of patients with ongoing VS maintained CD4+cell counts continuously above 200 cells/mL.19Furthermore, in an Asian cohort, among 1538 patients virologically suppressed over an unreported duration of follow-up, the rate of a confirmed drop below 200 CD4+/mL was 0.77/100 person-years. There was no significant difference in the time to a confirmed drop below 200 CD4+/mL when comparing people who were monitored biannually vs. those who had annual CD4+measurements.21Finally, in the PISCIS Cohort Study, over a median follow-up of almost 2 years, CD4+cell counts fell to ,200 cells/mL in 7% of 8695 patients.16 However, this estimate was calculated counting also single measurements below 200 CD4+/mL.
It can be argued that experiencing a CD4+ count drop below 200 cells/mL might not be clinically relevant, because clinical events typically occur also with counts of.200 cells/ mL. Of interest, nevertheless, in 39,283 HIV-infected patients with VL,1000 copies/mL or CD4+cell counts$350/mL in the resource-limited setting, the implementation of routine CD4+ cell count monitoring beyond 12 months after ART initiation did not seem to have an impact on long-term mortality rates.13
It needs to be considered that frequent monitoring of CD4+count in the setting of well-controlled viral replication might be only a source of patients’ anxiety as the result of the test is unlikely to trigger treatment decision7,8; reducing the frequency of CD4+monitoring might also reduce the overall costs related to care of HIV-infected patients.8,17However, knowing when CD4+ drop below 200 cells/mL is important, because in these cases (re)starting prophylaxis of opportunis-tic infections is recommended.1–4In the absence of random-ized comparisons of CD4+ count monitoring strategies, our analysis provides solid estimates that should help designing such studies.
Caniglia et al recently tried to emulate a trial comparing the effect of different frequencies of CD4+ cell counts monitoring for clinical outcome using the data of a very large cohort. Most of the 39,029 cohort participants who were eligible for the comparison changed strategy during follow-up (mostly in thefirst 6 months); indeed, less than 1/10 of them did not change the initial strategy and could be maintained in the analysis over 2 years of follow-up, thus largely limiting the power of the study.10
The results of our analysis confirm and expand, over a long follow-up and in a setting where there is universal access to treatment, the results of previous analyses. They also lend support to optional monitoring of CD4+cell counts in patients with satisfactory virological and immunological response to ART.
As participants’ follow-up time was censored at VF, the results of this study are applicable only to the population of HIV-infected individuals with current stable VS. It must be noted that results also do not apply to immunological nonresponders. Indeed, people who started ART with #350
TABLE 2. CD4+Cell Drop Rates (per 1000 PYFU) and
Respective 1-Sided Upper Limit of 97.5% CI
Stratification Factors
CD4+Drop Rates (per 1000 PYFU)
No.
Drops PYFU
Upper Limit of 97.5% CI CD4+cell count at ART start
0–350/mL 0 13,306 0.28 .350/mL 0 9721 0.38 Type of ART PI-based ART 0 5135 0.72 NNRTI-based ART 0 9297 0.40 Other ART 0 4752 0.78 HCV co-infection Absent 0 4734 0.78 Present 0 15,145 0.24 Year of baseline 1997–1999 0 2059 1.80 2000–2001 0 2318 1.59 2002–2006 0 6768 0.55 .2007 0 11,883 0.31 CD4+/CD8+ 0–0.3 0 2537 1.45 .0.3 0 19,766 0.19
HIV-RNA at ART start, log10copies/mL
0–5 0 15,640 0.24
.5 0 6921 0.53
Total 0 22,561 0.16
HCV, hepatitis C virus; NNRTI, nonnucleoside reverse transcriptase inhibitor; PI, protease inhibitor.
CD4+/mL and never attained values .350 cells/mL were excluded from the analysis because less frequent CD4+ cell counts monitoring is not an option in these patients.
The main limitations of this study are the relatively small sample size and the relatively short duration of follow-up; however, all events occurred over thefirst 3 years, so it is unlikely that results will be different by repeating the analysis after waiting for further follow-up to cumulate.
In summary, in patients who started ART in Italy with .350 CD4+ cells/mL, or reached .350 CD4+cells/mL after VS, with a stable controlled viral suppression, a confirmed CD4+drop below 200 cells/mL was never observed over an average of 4 years. The results of this study support optional monitoring of CD4+ cell counts, in a setting in which viral load assessment is easily available and in patients with these characteristics; they are also useful to help designing randomized trials comparing CD4+ count monitoring strate-gies in virologically suppressed populations.
ACKNOWLEDGMENTS
Icona Foundation Study Group: Board of Directors: A d’Arminio Monforte (Vice-President), M Andreoni, G Angarano, A Antinori, F Castelli, R Cauda, G Di Perri, M Galli, R Iardino, G Ippolito, A Lazzarin, CF Perno, F von Schloesser, and P Viale. Scientific Secretary: A d’Arminio Monforte, A Antinori, A Castagna, F Ceccherini-Silberstein, A Cozzi-Lepri, E Girardi, S Lo Caputo, C Mussini, and M Puoti. Steering Committee: M Andreoni, A Ammassari, A Antinori, C Balotta, A Bandera, P Bonfanti, S Bonora, M Borderi, A Calcagno, L Calza, MR Capobianchi, A Castagna, F Ceccherini-Silberstein, A Cingolani, P Cinque, A Cozzi-Lepri, A d’Arminio Monforte, A De Luca, A Di Biagio, E Girardi, N Gianotti, A Gori, G Guaraldi, G Lapadula, M Lichtner, S Lo Caputo, G Madeddu, F Maggiolo, G Marchetti, S Marcotullio, L Monno, C Mussini, S Nozza, M Puoti, E Quiros Roldan, R Rossotti, S Rusconi, MM Santoro, A Saracino, and M Zaccarelli. Statistical and Monitoring Team: A Cozzi-Lepri, I Fanti, L Galli, P Lorenzini, A Rodano, M Shanyinde, and A Tavelli. Biological Bank INMI: F Carletti, S Carrara, A Di Caro, S Graziano, F Petrone, G Prota, S Quartu, and S Truffa. Participating Physicians and Centers: Italy A Giacometti, A Costantini, C Valeriani (Ancona); G Angarano, L Monno, C Santoro (Bari); F Maggiolo, C Suardi (Bergamo); P Viale, V Donati, G Verucchi (Bologna); F Castelli, E Quiros Roldan, C Minardi (Brescia); T Quirino, C Abeli (Busto Arsizio); PE Manconi, P Piano (Cagliari); B Cacopardo, B Celesia (Catania); J Vecchiet, K Falasca (Chieti); L Sighinolfi, D Segala (Fer-rara); F Mazzotta, F Vichi (Firenze); G Cassola, C Viscoli, A Alessandrini, N Bobbio, G Mazzarello (Genova); C Mastroianni, V Belvisi (Latina); P Bonfanti, I Caramma (Lecco); A Chiodera, AP Castelli (Macerata); M Galli, A Lazzarin, G Rizzardini, M Puoti, A d’Arminio Monforte, AL Ridolfo, R Piolini, A Castagna, S Salpietro, L Carenzi, MC Moioli, C Tincati, G Marchetti (Milano); C Mussini, C Puzzolante (Modena); A Gori, G Lapadula (Monza); N Abrescia, A Chirianni, G Borgia, F Di Martino, L Maddaloni, I Gentile, R
Orlando (Napoli); F Baldelli, D Francisci (Perugia); G Parruti, T Ursini (Pescara); G Magnani, MA Ursitti (Reggio Emilia); R Cauda, M Andreoni, A Antinori, V Vullo, A Cristaudo, A Cingolani, G Baldin, S Cicalini, L Gallo, E Nicastri, R Acinapura, M Capozzi, R Libertone, S Savinelli, A Latini (Roma); M Cecchetto, F Viviani (Rovigo); MS Mura, G Madeddu (Sassari); A De Luca, B Rossetti (Siena); P Caramello, G Di Perri, GC Orofino, S Bonora, M Sciandra (Torino); M Bassetti, A Londero (Udine); G Pellizzer, and V Manfrin (Vicenza).
REFERENCES
1. Günthard HF, Saag MS, Benson CA, et al. Antiretroviral drugs for treatment and prevention of HIV infection in adults: 2016 recommen-dations of the international antiviral Society-USA panel. JAMA. 2016; 316:191–210.
2. Antinori A, Di Biagio A, Marcotullio S, et al. Italian guidelines for the use of antiretroviral agents and the diagnostic-clinical management of HIV-1 infected persons. Update 2016. New Microbiol. 2017;40:86–98. 3. Panel on Antiretroviral Guidelines for Adults and Adolescents.
Guide-lines for the Use of Antiretroviral Agents in HIV-1-Infected Adults and Adolescents. Department of Health and Human Services. Available at: http://www.aidsinfo.nih.gov/ContentFiles/AdultandAdolescentGL.pdf. Accessed August 10, 2016.
4. European AIDS Clinical Society (EACS). EACS Guidelines Version, 8.1. 2016. Available at: http://www.eacsociety.org. Accessed November 30, 2016.
5. Egger M, May M, Chene G, et al. Prognosis of HIV-1-infected patients starting highly active antiretroviral therapy: a collaborative analysis of prospective studies. Lancet. 2002;360:119–129.
6. Ledergerber B, Lundgren JD, Walker AS, et al. Predictors of trend in CD4-positive T-cell count and mortality among HIV-1-infected individ-uals with virological failure to all three antiretroviral-drug classes. Lancet. 2004;364:51–62.
7. Sax PE. Editorial commentary: can we break the habit of routine CD4 monitoring in HIV care? Clin Infect Dis. 2013;56:1344–1346. 8. Ford N, Meintjes G, Pozniak A, et al. The future role of CD4 cell
count for monitoring antiretroviral therapy. Lancet Infect Dis. 2015;15: 241–247.
9. Ford N, Stinson K, Gale H, et al. CD4 changes among virologically suppressed patients on antiretroviral therapy: a systematic review and meta-analysis. J Int AIDS Soc. 2015;18:20061.
10. Caniglia EC, Sabin C, Robins JM, et al. When to monitor CD4 cell count and HIV RNA to reduce mortality and AIDS-defining illness in virologically suppressed HIV-positive persons on antiretroviral therapy in high-income countries: a prospective observational study. J Acquir Immune Defic Syndr. 2016;72:214–221.
11. Mussini C, Lorenzini P, Cozzi-Lepri A, et al. CD4/CD8 ratio normal-isation and non-AIDS-related events in individuals with HIV who achieve viral load suppression with antiretroviral therapy: an observa-tional cohort study. Lancet HIV. 2015;2:e98–e106.
12. Bouteloup V, Sabin C, Mocroft A, et al. Reference curves for CD4 T-cell count response to combination antiretroviral therapy in HIV-1-infected treatment-naïve patients. HIV Med. 2017;18:33–44.
13. Shen Z, Zhu Q, Tang Z, et al. Effects of CD4 cell counts and viral load testing on mortality rates in patients with HIV infection receiving antiretroviral treatment: an observational cohort study in rural southwest China. Clin Infect Dis. 2016;63:108–114.
14. Gale HB, Gitterman SR, Hoffman HJ, et al. Is frequent CD4+ T-lymphocyte count monitoring necessary for persons with counts.=300 cells/mL and HIV-1 suppression? Clin Infect Dis. 2013;56:1340–1343. 15. Girard PM, Nelson M, Mohammed P, et al. Can we stop CD4+ testing in
patients with HIV-1 RNA suppression on antiretroviral treatment? AIDS. 2013;27:2759–2763.
16. Nicolás D, Esteve A, Cuadros A, et al. Safe reduction in CD4 cell count monitoring in stable, virally suppressed patients with HIV infection or HIV/Hepatitis C virus coinfection. Clin Infect Dis. 2016;62:1578–1585. 17. Barnett PG, Schmitt SK, Yu W, et al. How will new guidelines affect
18. World Health Organization. Consolidated Guidelines on the Use of Antiretroviral Drugs for Treating and Preventing HIV Infection: Recom-mendations for a Public Health Approach—2nd Ed. 2016. Available at: http://www.who.int/hiv/pub/arv/arv-2016/en/. Accessed July 4, 2017. 19. Ford N, Stinson K, Davies MA, et al. Is it safe to drop CD4+ monitoring
among virologically suppressed patients: a cohort evaluation from Khayelitsha, South Africa. AIDS. 2014;28:2003–2005.
20. INSIGHT START Study Group, Lundgren JD, Babiker AG, et al. Initiation of antiretroviral therapy in early asymptomatic HIV infection. N Engl J Med. 2015;373:795–807.
21. Ahn JY, Boettiger D, Law M, et al. Implementation and operational research: effects of CD4 monitoring frequency on clinical end points in clinically stable HIV-infected patients with viral suppression. J Acquir Immune Defic Syndr. 2015;69:e85–e92.