UNIVERSITY OF PISA
SANT’ANNA SCHOOL OF ADVANCED STUDIES
DOCTORAL SCHOOL IN ‘CROP SCIENCE’
DOTTORATO IN ‘SCIENZE DELLA PRODUZIONE VEGETALE’
Adventitious root formation in flooded tomato plants: insights on auxin and ethylene interaction
Candidate: Maria Laura Vidoz
Advisor: Prof. Pierdomenico Perata
CONTENTS
1 · INTRODUCTION 7
1.1 · Flooding impact 7
1.2 · Flooding sensing and signaling 9
1.3 · Plant adaptations to flooding 19
1.3.1 · Low oxygen escape syndrome 21
1.3.2 · Low oxygen quiescence syndrome 22
1.3.3 · Adventitious roots 23
1.3.4 · Aerenchyma 28
1.3.5 · Radial oxygen loss regulation 29
1.4 · Tomato responses to soil waterlogging 30
2 · MATERIALS AND METHODS 33
2.1 · Plant material and growth conditions 33
2.2 · Submergence and hypoxic conditions 34
2.3 · Inhibitor and ACC treatments 35
2.4 · Grafting experiment 36
2.5 · Sample harvest, RNA isolation and real time PCR 37
2.6 · Ethylene quantification 41
2.8 · Microscopy and photography 43
2.9 · GUS assay 44
3 · RESULTS 47
3.1 · Induction of adventitious roots in flooded tomato plants 47
3.2 · Hypoxia is not sufficient to trigger adventitious root
production 57
3.3 · Ethylene biosynthesis and perception are required
for adventitious root formation 60
3.4 · Auxin transport and perception greatly influence
AR formation 68
4 · DISCUSSION 75
SUMMARY
Soil flooding, which results in a decline in the availability of oxygen for the submerged organs, negatively affects the growth and productivity of most crops. Although tomato (Solanum lycopersicum) is known for its sensitivity to waterlogging, its ability to produce adventitious roots (ARs) increases plant survival when oxygen decreases in the root zone. Ethylene entrapment by water may represent the first warning signal to the plant of waterlogging. Treatment with both the ethylene-biosynthesis inhibitor aminoethoxyvinylglycine (AVG) and 1-naphthylphthalamic acid (NPA), an auxin transport inhibitor, resulted in a reduction of AR formation in waterlogged plants. Ethylene perceived by the Never Ripe receptor stimulated auxin transport. In a process requiring the Diageotropica gene, auxin accumulation in the stem triggers additional ethylene synthesis, which further stimulated a flux of auxin towards the flooded parts of the plant. Auxin accumulating in the base of the plant induces preformed root initials to grow. This response of tomato plants results in a new root system capable of replacing the original one when it has been damaged by submergence.
1 ·
INTRODUCTION
1.1 · Flooding impact
Climate change is likely to increase precipitations in many river basins (Kundzewicz et al., 2007) with rainfall and snowmelt being the main causes of river and urban floods. Frequency of intense precipitation is very likely to increase especially in tropical and high-latitude areas of the world (Bates et al., 2008). So far, the number of flooding events has doubled from 1996 to 2005 respect to the interval between 1950 and 1980, concomitantly with a five-fold increase in economic losses (Kundzewicz et al., 2007). The 3% increase in river discharges during the 20th century has been associated with a reduction in plant transpiration caused by a diminished stomata opening under high CO2 concentrations (Gedney et al., 2006; Betts et al., 2007). At the same time, flood damages have been related to socio-economic factors and changes in land-use. Floods have been the most frequent natural disaster in Africa, Europe and have affected the largest number of people around the world. The Disaster Relief Emergency Fund (DREF) has allocated 43% of funding to operations regarding floods followed by 13% to those regarding cyclones and storms (WDR, 2009).
Economic losses due to flooding include not only damages to buildings and other structures, but also agricultural losses. Indeed, flooding (including soil waterlogging and submergence) is one of the most frequent and extensive abiotic stresses that negatively influence terrestrial plant growth and productivity, affect the composition of plant populations and may result in plant death (Jackson and Colmer, 2005; Voesenek et al., 2006). It has been calculated that approximately 16% of fertile areas in the world are affected by soil waterlogging (Ahsan et al.,
2007). In this sense, it has been estimated that in 2030 yield reduction caused by excessive water in the soil profile would double in the USA (Bates et al., 2008). Moreover, it has been reported that about 1/3 to 1/2 of irrigated land is has drainage problems (Gibbs and Greenway, 2003). This is particularly important considering that some crop species such as rice are particularly tolerant to submergence, whereas many others are highly sensitive to soil waterlogging (Ahsan et al., 2007; Komatsu et al., 2009). In addition, resistance to flooding has not been one of the main objectives in improvement programs of most cultivated plants and therefore, the excess of water in the upper layers of the soil may have dramatic effects on crop productivity (Bailey-Serres and Voesenek, 2008; Komatsu et al., 2009). Several studies involving transcript profiling have demonstrated that numerous genes are differentially expressed under flooding, suggesting that stress response regulation is a very complex process. In fact, hypoxia causes changes in 5 to 10% of the transcriptome but also in the proteome and at the metabolic level (Moldovan et al., 2010) Therefore, more research is required in order to develop crop cultivars able to tolerate this stress (Komatsu et al., 2009).
The primary effect of soil waterlogging is the reduction in gas exchange. The 104-fold decrease in gas diffusion rate in water compared to that in air negatively affects oxygen supply and causes an accumulation of carbon dioxide and ethylene in submerged tissues (Visser and Voesenek, 2004; Jackson et al., 2003). Oxygen is the final electron acceptor in the oxidative phosphorylation pathway that produces most of the ATP required for cell metabolism (Geigenberger, 2003) and is also involved in other important pathways such as haem, sterol and fatty acid biosynthesis. In spite of oxygen significance for plant life, plants do not have an active mechanism to deliver it to internal tissues as animals do (van Dongen et al., 2009). Consequently, its levels in submerged organs decrease due to the rapid consumption and slow diffusion rate through
water. This reduction in oxygen availability probably constitutes one of the first signals that trigger plant responses to waterlogging (Komatsu et al., 2009). The decline in plant growth and development that results from flooding is a consequence of hypoxia-induced effects such as the reduction in cellular energy status and cytoplasmic pH, and the buildup of toxic compounds produced by anaerobic respiration and reactive oxygen species (ROS) during recovery (Liu et al., 2005).
Moreover, plants need CO2 influx to chloroplasts in order to photosynthesize and therefore, when shoots and leaves are submerged, the slow diffusion of the gas towards the plant causes a decline in the photosynthesis rate. In contrast, in flooded roots where no CO2 is consumed to produce carbohydrates, this gas tends to accumulate (Colmer and Voesenek, 2009). In addition, when water accumulates above the soil surface, a reduction in light intensity is observed in submerged stems (Jackson and Colmer, 2005). Finally, besides the energy and carbohydrate crisis that results from the reduction in gas exchange, excess water brings about nutrient solubility and redox potential changes in the soil as well as the accumulation of products from microbial anaerobic metabolism (Jackson and Colmer, 2005; Komatsu et al., 2009).
1.2 · Flooding sensing and signaling
Plants may undergo oxygen deprivation as a consequence of natural variations in their environment when soils are affected by floods causing soil waterlogging and submergence, and in the case of severe rainfall (Bailey-Serres and Chang, 2005). However, flooding is not the only cause of hypoxia in plant tissues. The lack of an operative oxygen transport system compromises its delivery to plant regions with large energy need, and therefore oxygen demand, due to an active metabolism. Consequently, a gradient in oxygen concentration is often found through
dense tissues as well as in developing seeds (van Dongen et al., 2004). In the case of seeds, the oxygen level decreases to below 1% under the seed coat, as it has been demonstrated in pea, broad bean and oil-seed rape, probably because of the presence of cutinized cell layers in the coat (Geigenberger, 2003; van Dongen et al., 2004). Nevertheless, green seeds can still photosynthesize and in this way the internal oxygen concentration increases in the presence of light (Geigenberger, 2003). Other examples of areas in which oxygen provision may not outweigh its consumption are root meristems and phloem tissue. Both tissues are characterized by high energy use but low porosity, and show an oxygen content of 4-10% and 5-6% respectively, that differ from the 21% normally observed in the atmosphere (Geigenberger, 2003; Liu et al., 2005). In addition, it has been observed that bulky storage organs such as bananas, apples and potato tubers also show a decrease in oxygen levels (Geigenberger, 2003). In the case of potato, it has been reported that oxygen concentration varies from 8-10% below the peel to 2-5% in the center of the tuber.
The exact mechanism through which plants sense variations in the oxygen level is not clear yet (Figure 1.1). It may involve a direct perception where proteins or ligands react with or bind to oxygen or an indirect mechanism engaging energy or redox status, or calcium levels (Bailey-Serres and Chang, 2005). The exact function of mitochondria in low oxygen sensing is not well known and more research is needed in order to understand whether they play a passive role or an active one that engages a retrograde signal (Moldovan et al., 2010).
Figure 1.1: Mechanisms involved in sensing oxygen deprivation. Direct sensing would depend on molecules that bind to or consume oxygen, whereas indirect sensing would result from a change in cellular homeostasis. Interaction between sensing pathways is also possible (from Bailey-Serres and Chang, 2005).
Direct oxygen sensing would depend on a molecule with the ability to recognize changes in oxygen levels that would then elicit a signal cascade (Bailey-Serres and Chang, 2005). Non-symbiotic hemoglobins have once been proposed as oxygen sensors. Hemoglobins are found in animal, plants and microorganisms where they have various functions such as oxygen and sulfide transport and storage, and nitric oxide (NO) scavenging (Hunt et al., 2001). In plants it is possible to find both symbiotic and non-symbiotic hemoglobins. The first, which is present in nodules, participates in oxygen transport to the nitrogen-fixing bacteria (Hunt et al., 2002). In contrast, non-symbiotic hemoglobins are induced under very different conditions and have dissimilar functions. Some of them are induced after exposure to hypoxic stress through a mechanism that involves ATP and allows the cells to sustain their energy status under such stress (Dordas et al., 2003b). In fact, it has been demonstrated that roots from alfalfa lines overexpressing this class of hemoglobins are able to maintain higher growth rates than the wild-type when exposed to low
oxygen concentrations (Dordas et al., 2003a). Likewise, increased expression of non-symbiotic hemoglobin has resulted in enhanced survival to severe hypoxia in Arabidopsis transgenic lines (Hunt et al., 2002). Igamberdiev and Hill (2009) have proposed that these hemoglobins react with the NO produced under oxygen deprivation forming nitrate ion and methaemoglobin. NO scavenging prevents cytochrome oxidase from being inhibited by NO, and in this way ATP synthesis via nitrite continues even under hypoxic conditions. Nevertheless, in spite of their role in hypoxia tolerance, it is unlikely that this molecule functions as an oxygen sensor, store or transporter to mitochondria due to its very high affinity for oxygen (Visser and Voesenek, 2004). Indeed, the non-symbiotic hemoglobin dissociation constant is in the range of 2–3 nM, which causes it to remain bound to oxygen at concentrations below those that trigger anaerobic responses (Visser and Voesenek, 2004; Igamberdiev and Hill, 2009). Another piece of evidence that would rule out hemoglobins as oxygen sensors is the fact that hemoglobin-coding genes are induced not only by hypoxia but also by respiratory chain inhibitors (Visser and Voesenek, 2004). As a consequence, oxygen would indirectly influence hemoglobin expression. Indirect oxygen sensing would involve other signal molecules and would be the result of changes in cellular homeostasis (Bailey-Serres and Chang, 2005). One of the possible mechanisms that have been proposed to be involved in oxygen sensing is the change in the ATP/ADP ratio. Independent experiments carried out with pea, bean and Arabidopsis seeds, potato tubers, and Ricinus phloem have shown that the decrease in this ratio and in the adenylate status closely follows the reduction in oxygen availability (Geigenberger, 2003). Consequently, this would indicate the existence of a relationship among oxygen concentration, energy status and respiration, which is inhibited under oxygen deprivation. This change in adenylate status takes place at oxygen
concentrations that are above the Km (O2) of the cytochrome oxidase, being noticeable even at 12% oxygen, long before the onset of fermentation. Therefore, it is necessary to distinguish two different effects of oxygen deprivation, according to the concentration of the gas in the considered environment. In the case of hypoxia, there is an inhibition of respiration (and some biosynthetic processes), which causes a reduction in ATP production (Dat et al., 2004). It is interesting to note that the decrease in the ATP/ADP ratio is independent from an increase in the NADH/NAD ratio, since NAD remains oxidized as long as the oxygen level is kept above 1%. Conversely, as oxygen concentration goes below 1%, there is an increase in glycolytic flux (Geigenberger, 2003). Under anoxia there is a switch from aerobic respiration to anaerobic fermentation, and glycolysis is required to continue ATP production. Glycolysis is much less efficient than respiration since only 2 ATP molecules are produced per each glucose molecule. Moreover, fermentation causes lactate accumulation which in turns produces a reduction in cytosolic pH, another possible sensor of falling oxygen concentrations.
One of the first events that take place upon hypoxia onset is the cytoplasmic acidification. As oxygen concentration decreases, pH goes down in 0.2 to 0.6 units within 15 minutes from the start of the stress and it has been suggested that it would assist in acclimation to the new environmental conditions (Bailey-Serres and Chang, 2005). According to Davies’ hypothesis, the anaerobic metabolism would be regulated in a pH-dependent manner (reviewed by Magneschi and Perata, 2009). Under falling oxygen concentrations, pyruvate furnished by glycolysis would be used to produce lactate by the lactate dehydrogenase. Lactate accumulation would then cause cytoplasm acidification (from pH 7.5 to approximately 7), which would activate pyruvate decarboxylase. In this way, pyruvate could be converted to acetaldehyde that is used by alcohol
dehydrogenase to produce ethanol. Ethanol is able to cross the plasma membrane since it is an uncharged molecule (Bailey-Serres and Chang, 2005). This hypothesis has found some opposition, because the reduction in cytoplasmic pH is not always accompanied by lactate fermentation (Tadege et al., 1999). In contrast, it has been suggested that at the normal cytosolic pH, pyruvate would enter the TCA cycle as the Km of pyruvate dehydrogenase is in the µM range while the Km of pyruvate decarboxilase is in the mM range. Once respiration has been hindered, pyruvate would accumulate until pyruvate decarboxylase increases its activity (Tadege et al., 1999). Another possible cause of this decline in pH could be proton leakage from the vacuole, resulting from hypoxia-induced modifications in the activity of proton-pumping ATPases of the tonoplast (Saint-Ges et al., 1991). In any case, pH regulation is involved in hypoxia and anoxia tolerance, and might indirectly participate in oxygen sensing.
It has been observed that changes in calcium levels inside and in close proximity to mitochondria follow transfer to anoxic conditions. In fact, calcium release from mitochondria is another event that takes place early after the onset of anoxia and would suggest that these organelles are crucial for oxygen sensing. Calcium is then thought to be engaged in signal transduction, participating in early stages of anoxia response. Furthermore, calcium released from mitochondria would be involved in the communication between the cytoplasm/mitochondria and the nucleus under anoxia (reviewed by Subbaiah and Sachs, 2003).
Other molecules that are thought to be involved in oxygen sensing are ROS and RNS. As reviewed by Licausi and Perata (2009), there are two contradictory hypotheses regarding ROS. The oldest one proposes that ROS production decreases under low oxygen conditions, whereas the newest hypothesis based on studies on several plant species sustains that there is ROS production under hypoxia. For example, low oxygen causes
an increase in H2O2 synthesis concomitantly with the increase in ADH induction in Arabidopsis (Baxter-Burrel et al., 2002). NO is another molecule that participates in plant signaling. It is moderately soluble in water and is free to move in the cytoplasm but also can move across cell membranes. Once it has been produced, it is converted into NO2 by reaction with O2 before being degraded to nitrate and nitrite. Therefore, its ability to move from one cell to another and the possibility to be easily removed make it a good signal molecule (Neill et al., 2003). Moreover, NO could be involved in certain processes that take place in the cell in order to regenerate NAD+ and keep glycolysis running under hypoxia (Dordas et al., 2003b). It is interesting to note that NO shares some steps in IAA signal transduction and has been associated to auxin-induced adventitious root development (Li et al., 2009).
In the presence of stress, several signaling molecules become active and, due to the interplay among them, signal transduction is a rather complex process that still needs clarification. Furthermore, the plant response depends on the intensity, length and frequency of the signal cascade (Dat et al., 2004). As a consequence, each adaptive change is the result of the interaction among plant hormones and other members of the signal transduction pathway. Plant responses to oxygen shortage depend on signaling triggered by ethylene, abscisic acid, calcium and other molecules such as ROS and hemoglobin (Mühlenbock et al., 2007).
Ethylene is probably the signal molecule that has been more deeply studied, because it is precisely ethylene production and entrapment that triggers a number of plant responses to flooding and submergence (Jackson, 2002). These responses vary with the plant species and include epinasty, hyponastic growth, shoot elongation, aerenchyma formation and adventitious root development (Jackson, 2002; Visser and Voesenek, 2004; Voesenek et al., 2006; Bailey-Serres and Voesenek, 2008). Through these adaptations, plants may escape from the hypoxic environment or at
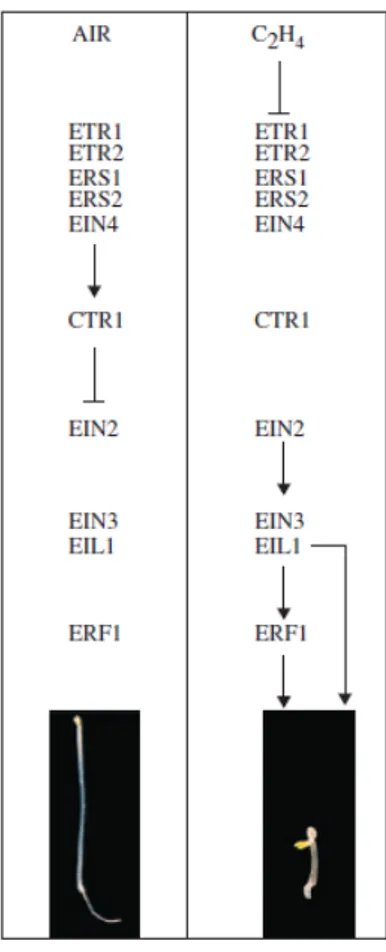
least improve oxygen diffusion to the submerged organs. Sunflower, rice, tomato and many other plant species exhibit an increase in ethylene production within a few hours from the onset of hypoxia (Dat et al., 2004). Since ACC (1-aminocyclopropane-1-carboxylic-acid) conversion to ethylene by ACC oxidase requires oxygen, its production is abolished under anoxia (Peng et al., 2001; Voesenek et al., 2006). However, ACC accumulates in roots in the presence of waterlogging due to an increase in ACC synthase activity and is then transported to the upper part of the plant which is not submerged. In some species such as Rumex palustris, an increase in ACC oxidase concentration has been observed under flooding conditions, which would compensate for the reduction in its activity at low oxygen levels (Vriezen et al., 1999). As a consequence, ACC conversion to ethylene takes place in plant leaves which are in contact with the air. Once there, it triggers leaf epinasty and stem elongation among other plant adaptations to the new environment (Jackson, 2002). In the plant kingdom, ethylene receptors are located in the endoplasmic reticulum. Most studies dealing with ethylene signal cascade have been carried out with the model species Arabidopsis thaliana (Voesenek et al., 2006). Ethylene receptors form a complex with the CONSTITUTIVE TRIPLE RESPONSE (CTR) protein (Figure 1.2). The kinase activity of CTR is activated when CTR is attached to the receptor and inhibits ethylene responses. If the gas binds to the receptor, CTR is inactivated and ethylene responses are no longer repressed. In this way, the positive regulator ETHYLENE INSENSITIVE2 (EIN2) and the transcription factors EIN3 and EIN3-like (EIL) are activated. The first target of EIN3 is the Ethylene Response Factor1 (ERF1) gene, a transcription factor involved in the activation of downstream ethylene-responsive genes (reviewed in Chen et al., 2005). Although it is possible to find some divergences, most elements and mechanisms in ethylene signaling are conserved among many monocots and dicots of agricultural relevance.
Figure 1.2: Ethylene transduction pathway in Arabidopsis thaliana. In air, ethylene responses are repressed whereas in the presence of ethylene CTR is inactivated and EIN2, EIN3 and EIL activate ethylene responsive genes (from Chen et al., 2005).
In spite of all the attention that ethylene has been given, it is not the only phytohormone involved in flooding-induced responses. Abscisic acid (ABA) concentrations have been reported to increase after the start of flooding in several species such as tomato and Phaseolus vulgaris (Dat et al., 2004). In contrast, ABA levels do not change or even decrease under hypoxia in other species. This opposite observations regarding ABA could be explained if ABA acted as a gibberellic acid (GA) inhibitor, as it was observed in rice (Jackson and Ram, 2003; Dat et al., 2004). It is believed that when rice plants are submerged, ethylene levels rise causing a decrease in ABA concentration and an increase in GA level, which leads to internode elongation (Vriezen et al., 2003). Benschop et al. (2005) have demonstrated that ethylene causes a reduction in ABA levels in R.
palustris and R. acetosa by reducing its biosynthesis rate and increasing its degradation, and that this drop in ABA concentration results in GA-induced elongation.
As mentioned before, variations in GA concentration also seem to play an important role in plant responses to hypoxic stress. In species such as rice and R. palustris, GA acts synergistically with ethylene for internode and petiole elongation, respectively (Dat et al., 2005; Benschop et al., 2005). In Callitriche, tobacco and Arabidopsis, GA is also essential for ethylene-mediated adaptations and, at least in deepwater rice, it would not be able to trigger the same responses in the absence of ethylene (Steffens et al., 2006).
Besides GA, indole-3-acetic acid (IAA) is another important hormone that is involved in flooding adaptations such as adventitious root formation. IAA would interact with ethylene in order to induce this response, but the nature of this interplay largely depends on the species under consideration. Whereas in Rumex ethylene would increase the plant sensitivity to auxin (Visser et al., 1996a), in tomato seedlings and tobacco it would modulate auxin transport (Negi et al., 2010; McDonald and Visser, 2003, respectively).
In addition, in a few cases, cytokinins have been proposed to be engaged in waterlogging responses. Since root apical meristems are the site of cytokinin synthesis, excess water in the soil profile would interfere with this process causing a reduction in the cytokinin level, as it was observed in sunflower (Dat et al., 2004). Interestingly, auxin and cytokinins can also induce ethylene synthesis, proving once more the intricate interplay among phytohormones that precedes plant adaptive responses (Chilley et al., 2006).
Another important aspect of calcium participation in signal transduction pathways is its involvement in ethylene biosynthesis. Experiments performed with maize have shown that an increase in calcium levels
occurs as a consequence of hypoxia, resulting in ethylene-induced aerenchyma formation in roots (Peng et al., 2001). Moreover, it is known that cytosolic calcium concentration is part of the signaling pathway that controls gene expression under hypoxia and leads to the activation of ADH in maize and Arabidopsis (Baxter-Burrell et al., 2002). Calcium level changes take place within minutes from the start of the stress and have an important role in post-anoxic plant survival (Subbaiah and Sachs, 2003).
1.3 · Plant adaptations to flooding
During evolution, plants have acquired dissimilar adaptations in order to have better changes of surviving under flooding conditions. These stress responses are found at both cellular and whole plant level, involving metabolic (Figure 1.3) and developmental changes (Bailey Serres and Chang, 2005).
Flooding may occur either continuously or temporarily in different environments (Gibbs and Greenway, 2003). Some ecosystems such as flood plains and marshes undergo soil waterlogging regularly. Wetlands represent approximately 6% of world’s land surface (Ferrati et al., 2005). Two examples of such ecosystems are Florida’s everglades that cover about 1 million hectares (Gibbs and Greenway, 2003) and Iberá wetlands in Argentina. The latter covers a surface of 1.4 million hectares and consists of a combination of marshes, swamps and lakes (Cózar et al., 2005) representing one of the largest freshwater wetlands of South America (Ferrati et al., 2005). Plant species that live in these flooded areas exhibit different levels of adaptation/tolerance to root and shoot submergence (Ferrati et al., 2005) that allow them to survive in the presence of stress in spite of being sessile organisms (Potters et al., 2007). The variety in flooding regimes influences species distribution and
abundance in these environments susceptible to waterlogging (Colmer and Voesenek, 2009). The difference in frequency and intensity of flooding also determines the strategy that plants will adopt to overcome the stress. For example, fast shoot or leaf elongation has proved a successful strategy only when the benefit of improved aeration exceeds the energy cost of supporting a growing organ (Voesenek et al., 2004). Among the adaptations that plants have evolved to survive when exposed to this kind of stress are the physical ‘escape’ from submergence, the increase in stem and root aeration to facilitate oxygen arrival to submerged tissues, anoxia tolerance, and the ability to avoid oxidative damage during re-aeration (Jackson and Colmer, 2005).
Figure 1.3 (previous page): Metabolic adaptations to low oxygen levels. Falling oxygen concentrations cause changes in gene expression patterns in order to trigger metabolic responses that lead to survival or avoidance of anoxia (from Geigenberger, 2003).
1.3.1 · Low oxygen escape syndrome
Some plants are able to avoid submergence conditions by developing anatomical and morphological adaptations (reviewed in Bailey-Serres and Voesenek, 2008). In fact, some genera such as Rumex include species that have evolved the capacity to escape from the adverse environment through the fast elongation of leaves, petioles or stems (Cox et al., 2003). This elongation allows the plant to regain contact with the air but it is energetically costly. As a consequence, it is only advantageous when the plant is able to re-establish contact with the atmosphere before its energy reserves have been completely exhausted (reviewed in Bailey-Serres and Voesenek, 2008). This mechanism is also called Low Oxygen Escape Syndrome (LOES) and is beneficial in cases of shallow and extended flooding. It is accompanied by aerenchyma formation, a decrease in leaf thickness and the orientation of chloroplasts towards the epidermis, all of which facilitates the diffusion of oxygen and carbon dioxide from and into the leaf (Figure 1.4).
Figure 1.4 (previous page): Low Oxygen Escape Syndrome in Rumex. Increased shoot elongation and aerenchyma formation are found in sybmerged plants, as well as a reduction in leaf thickness and the re-orientation of chloroplasts towards the epidermis (From Bailey-Serres and Voesenek, 2008).
1.3.2 · Low oxygen quiescence syndrome
Other plants present what is called Low Oxygen Quiescence Syndrome (LOQS). The LOQS is characterized by a very slow shoot or leaf elongation under submergence or a complete lack of elongation. This slow growth rate allows the plant to preserve its energy resources in order to survive until water levels have decreased (Colmer and Voesenek, 2009). This adaptation is advantageous in short-duration flooding events and has been found in some rice cultivars that are tolerant to short periods of even deep submergence. In this species, it is controlled by the Sub1 polygenic locus. The Sub1A-1 expression is regulated by ethylene and is the responsible of the ability of flood-tolerant rice cultivars to cease elongation until water has receded (Figure 1.5).
Figure 1.5: Rice responses to submergence are controlled by Sub1A. Plants carrying the Sub1A-1 gene reduce ethylene biosynthesis and GA signaling, which results in a decrease in shoot elongation and prevents depletion of energy reserves (From Fukao and Bailey-Serres, 2008).
1.3.3 · Adventitious roots
Besides the oxygen shortage that affects roots directly, soil waterlogging causes the reduction of soil components (Mn2+, Fe2+, S2-). This may result in the death of large parts of the root system if these soil elements accumulate to toxic levels (Colmer and Voesenek, 2009). As a consequence, plant species that are able to develop a new root system have more chances to survive or recover from flooding stress. Adventitious roots (ARs) are roots that arise from either the upper and older part of the taproot, or the base of the stem, where roots would not be formed under normal conditions (Visser and Voesenek, 2004). Experiments carried out with sunflower, tomato and tobacco plants exposed to flooding stress have demonstrated that tobacco, which produces fewer ARs, is also more sensitive to root and partial stem submergence (Kramer, 1951). In contrast, sunflower plants were the first to produce a new root system and proved to be the less sensitive. Tomato plants developed symptoms of injury after 3-4 days from the start of the experiments, but those that produced more ARs were able to recover faster (Kramer, 1951). This correlation between flooding-induced root formation and waterlogging tolerance has been observed in different genera such as Rumex, Pinus and Hordeum (reviewed by Visser and Voesenek, 2004).
Although several factors such as Ca+2, sugars, ROS and polyamines may influence the development of ARs, auxins are undoubtedly the main protagonists in this process (Li et al., 2009). In addition, ethylene, which is responsible of several plant adaptations, is known to participate in this process (Visser and Voesenek, 2004). Nevertheless, the exact role of auxin and ethylene in AR formation seem to show some variation among species. In fact, several experiments conducted with divergent plant species have demonstrated that both phytohormones play a crucial role during AR formation and interact in different ways. Probably, Kramer
(1951) has made the first attempt to explain the role of auxin during AR formation upon flooding. This author hypothesized that the decrease in oxygen levels would lead to a reduction in carbohydrate and auxin transport towards the roots, and auxin would consequently accumulate in the lower stem, around the water surface. This hypothesis was confirmed 13 years later, when Phillips (1964) demonstrated that auxin actually accumulated at the base of sunflower stems as a result of flooding of the root system. Indeed, many of the earliest studies regarding the involvement of auxin and ethylene during root and partial shoot submergence have been conducted with sunflower (Wample and Reid, 1978; 1979). In this species, an increase in auxin content at the hypocotyl level has been shown to be required for AR production upon flooding or main root removal. On the contrary, ethylene seemed to participate indirectly, probably favoring the IAA accumulation at the root formation site (Wample and Reid, 1979). Interestingly, these authors also suggested a possible role of ethylene in hypocotyl hypertrophy, a phenomenon frequently observed in roots upon flooding, which would be related to an increase in porosity as a means to facilitate oxygen diffusion to submerged tissues (Visser et al., 2000). In addition, only 24 hours of flooding were enough to induce the development of ARs from sunflower hypocotyls (Wample and Reid, 1978).
In species such as maize (Drew et al., 1979), rice (Mergemann and Sauter, 2000) and tobacco (McDonald and Visser, 2003) ethylene plays a crucial role during AR emergence from the shoot base of waterlogged plants. Although in maize this hormone would negatively affect the elongation of newly formed roots, it triggers another adaptive response: lysigenous aerenchyma formation. In spite of these similarities regarding the involvement of ethylene, its precise role and interaction with auxin differs from one species to the other. In rice, AR primordia are formed at the nodes during the normal development of the plant (Mergemann and
Sauter, 2000). These primordia elongate slowly but until the onset of flooding they do not grow enough to emerge from the stem tissues. When the stress starts, the ethylene build up causes epidermal cell death in front of the elongating primordia to ease the emergence and prevent any damage to the tips (Mergemann and Sauter, 2000). More recent studies carried out with rice have demonstrated that this programmed cell death is induced by ethylene and mediated by H2O2, indicating a common signaling pathway (Steffens and Sauter, 2009). In addition, this response would be further promoted by gibberellic acid, which acts synergistically with ethylene during the death of specific epidermal cells (Steffens and Sauter, 2005).
Another species in which the role and interplay between auxin and ethylene has been thoroughly studied is R. palustris, a flood-resistant plant found in river flood plains (Voesenek et al., 1993). The use of ethylene and IAA application as well as inhibitors of auxin transport and ethylene biosynthesis have shown that in this species ethylene-induced AR formation requires the presence of auxin, whereas auxin-induced AR development is independent from ethylene (Visser et al., 1996a). Interestingly, ethylene application to non-flooded plants was able to evoke the effect of AR formation during flooding stress (Visser et al., 1996b) while flooded plants treated with an inhibitor of auxin transport showed a dramatic reduction in the number of AR, indicating that ethylene alone is not able to trigger this response. Although Visser et al. (1996a) did not observe and increase in auxin concentration at the AR formation region, a higher number of roots formed in response to flooding. Therefore, based on the fact that ethylene levels increase in waterlogged tissues, these authors proposed that the enhancement in AR production was due to an ethylene-induced increase in auxin sensitivity (Figure 1.6). In this way, the accumulation of IAA at the shoot base was not required to trigger AR development but only a constant basipetal
transport was enough to induce AR formation. Interestingly, although ethylene has a positive effect on AR production in R. palustris, it negatively influences root elongation (Visser et al, 1997).
Figure 1.6: Model explaining the process of adventitious root formation in Rumex palustris (from Visser and Voesenek, 2004).
Some experiments conducted with tomato (Solanum lycopersicon) and S. peruvianum have once more confirmed the correlation between AR formation and plant recovery from flooding stress (McNamara and Mitchell, 1989). In these studies, S. lycopersicon, which produced more ARs, was able to recover faster from root submergence regaining stomatal conductance concomitantly with the development of ARs. In a later work, McNamara and Mitchell (1991) have suggested that auxin would accumulate above the water surface due to the elevated levels of ethylene produced in submerged tissues that would hamper auxin transport towards the roots. In addition, these authors have proposed that ethylene would stimulate root primordia elongation and that these new roots would not derived from pre-formed root initials but would
instead be induced de novo by auxin. In a recent paper, Negi et al. (2010) have studied the function of ethylene during auxin-induced AR formation in tomato seedlings. These authors have observed that AR and lateral root development are differently influenced by ethylene, since the first is stimulated by the hormone whereas the latter is hampered when plants are treated with the ethylene precursor ACC.
Furthermore, McDonald and Visser (2003) have studied ethylene and auxin effect on AR production in tobacco and transgenic tobacco plants that were less sensitive to ethylene. These authors have observed that wild type plants not only grew more than transgenic ones under flooding conditions but also produced more ARs, suggesting that ethylene plays a crucial role in the development of adaptations to waterlogging. Plant treatment with the auxin transport inhibitor caused a reduction in AR formation in wild type plants to a level similar to that of ethylene insensitive plants, which would indicate that ethylene and auxin interaction takes place at the polar auxin transport level (McDonald and Visser, 2003).
Several species belonging to different families and exhibiting different growth habits form ARs after the onset of flooding, but the precise mechanism behind this response has not been clarified yet. For example, in Lepidium latifolium, a perennial herbaceous plant, a negative correlation has been observed between ethylene evolution in roots and the number of ARs produced in waterlogging conditions (Chen et al., 2002). Similarly, in some trees such as Fraxinus mandshurica and Acer negundo, the requirement of ethylene and auxin during flooding-induced AR formation has been observed, but the exact role and interaction between the two phytohormones remains elusive (Yamamoto et al., 1995).
1.3.4 · Aerenchyma
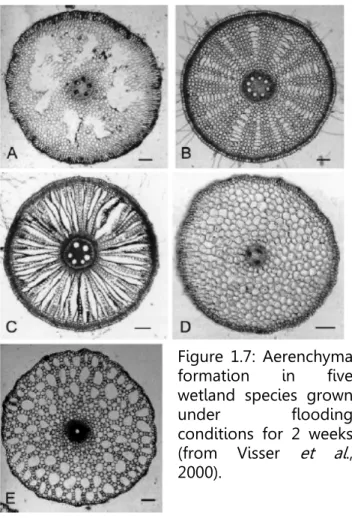
ARs are usually characterized by their larger diameter and lack of branching. Those emerging from wetland plants often present wider intercellular spaces that allow better oxygen diffusion towards the submerged parts of the plant (Figure 1.7). The higher tolerance of wetland plants to flooding conditions has been attributed to this increased ability to conduce oxygen through the lower stem and roots (McDonald et al., 2001). Many studies regarding aerenchyma formation in adventitious roots have been conducted in maize, due to the abundant production of roots that this species shows under waterlogging and the diameter of these new roots that facilitates microscopic studies. Drew et al. (1979) have conducted several experiments with maize and have observed that exogenously applied ethylene as well as ethylene accumulated inside the tissues enhanced both AR emergence and lysigenous aerenchyma formation in those roots. Even dissimilar plant species seem to form aerenchyma as a result of flooding stress. Some of these include Luffa cylindrica (Shimamura et al., 2007), Glycine max (Thomas et al., 2005), Trifolium subterraneum (Aschi-Smiti et al., 2003) and Oryza sativa (Colmer, 2003a).
Another positive effect of aerenchyma has been revealed in experiments conducted with several genera presenting wetland and non-wetland species. These studies have shown that aerenchyma formation in wetland plants promotes longitudinal ventilation and reduces the accumulation of ethylene in submerged root tissues, decreasing the negative effects that ethylene has on root growth (Visser and Pierik, 2007).
Figure 1.7: Aerenchyma formation in five wetland species grown under flooding conditions for 2 weeks (from Visser et al., 2000).
1.3.5 · Radial oxygen loss regulation
Although aerenchyma allows oxygen to arrive to plant organs under water, the amount of oxygen that actually reaches the root tips may be reduced because of oxygen use by stem tissues and oxygen loss to the soil (Visser et al., 2000). Therefore, besides the lysigenous or schyzogenous aerenchyma found in ARs, many wetland species have a reduced radial oxygen loss (ROL) that increases the efficiency in oxygen diffusion towards the submerged part of the plant (McDonald et al., 2001; 2002). This kind of barrier to oxygen loss may be located in the epidermal
or subepidermal layers (Visser et al., 2000). The deposits of lignin and suberin, frequently found in the outer cell layers of wetland plant roots, would contribute to this reduction in oxygen loss towards the rhizosphere. In rice, this kind of barrier increases root aeration in several upland, paddy and deep-water genotypes and reduces oxygen loss to the soil (Colmer, 2003a). Other species in which ROL has been studied are Phragmites australis, Hordeum marinum, R. palustris, Phalaris aquatica, Triticum aestivum and Hordeum vulgare (reviewed by Colmer, 2003b).
1.4 · Tomato responses to soil waterlogging
Tomato is the second vegetable crop in market importance after potato, and fresh tomato trade has increased in 45% in the last 5 years (www.fao.org/nr/water/cropinfo_tomato.html). For several decades, its economical significance has made tomato the center of extensive physiological, biochemical and genetic studies, some of which refer to plant response under waterlogging stress. More recently, it has been the target of molecular research, proteomic analyses and genome sequencing as well (Ahsan et al., 2007; Fei et al., 2006). However, tomato plants are still highly sensitive to flooding (Else et al., 2009), due to a lack of improvement programs that target waterlogging and submergence resistance. In addition, a decrease in ascorbate and lycopene and a sharp increase in ammonium content were observed in fruits when root hypoxia was applied to hydroponically grown plants at first flower anthesis (Horchani et al., 2008).
Two of the most typical tomato plant responses to flooding are epinasty and AR formation. The first one has been explained as the result of a positive message from the roots. Ethylene precursor 1-aminocyclopropane-1-carbooxylic acid (ACC) accumulates in flooded roots, it is then transported through the transpiration stream and, once in
the aerial part of the plant, oxygen presence allows its conversion into ethylene, triggering petiole epinasty (Jackson, 2002).
The second type of response is AR formation. As mentioned before, ARs have been long known to participate in tomato plant recovery from waterlogging (Kramer, 1951). Indeed, newly formed roots have allowed the recommencement of shoot growth after the onset of flooding and caused a reduction in leaf epinasty (Jackson, 1955). McNamara and Mitchell (1991) have made an attempt to unveil the role of auxin and ethylene during AR formation in tomato. These authors have observed that auxin is required to stimulate the formation of root initials that are not present in hypocotyls before flooding treatment and have proposed that ethylene would promote root elongation. On the contrary, Jackson (1985) has suggested that submergence would induce the development of preformed root initials in hypocotyls. As previously mentioned, a recent study regarding ethylene function during auxin-induced AR formation has revealed that the mechanism behind this process differs from lateral root initiation (Negi et al., 2010). More particularly, ethylene would hamper the development of lateral roots while it would stimulate AR production in seedlings and would interact with IAA by modulating polar auxin transport.
In tomato, as well as in Arabidopsis, ethylene and auxin insensitive mutants are available, rendering it easier to conduct physiological and molecular experiments to better understand the mechanism through which these hormones regulate plant responses. Two such tomato mutants are Never ripe (Nr) and diageotropica (dgt). Plants carrying the Nr mutation are insensitive to ethylene due to a defective receptor protein and, as a consequence, exhibit less AR production from cuttings in comparison to wild-type plants (Clark et al., 1999). In the case of the dgt mutation there is a lower sensitivity to auxin and plants are characterized by several conspicuous phenotypes including lack of lateral
roots, reduced gravitropic response, hyponastic leaves and reduced apical dominance (Nebenfuhr et al., 2000).
The main objective of this work was to study AR formation in tomato plants under flooding conditions in order to better understand the involvement of ethylene and auxin and their possible interaction during this process. For this purpose, the above described mutants and chemical inhibitors of perception/transport of auxin and ethylene were used in different experiments. A deeper knowledge in this topic would be valuable in improvement programs and would aid in the selection of cultivars adapted to flood-prone areas.
2
·MATERIALS AND METHODS
2.1 · Plant material and growth conditions
Tomato (Solanum lycopersicon) plants cv. Ailsa Craig (AC) were used as WT for all experiments, except for those involving ethylene and auxin perception mutants. The ethylene-insensitive mutant Never ripe (Nr) and its WT cv. Gimar were provided by Dr. G.P. Soressi (University of Tuscia, Viterbo, Italy). Seeds from transgenic plants containing the IAA-inducible promoter of the Agrobacterium tumefaciens gene 5 (p5) fused to the GUS reporter in Chico III background were also provided by Dr. G.P. Soressi (University of Tuscia, Viterbo, Italy). The auxin-resistant diageotropica (dgt) in AC background was provided by Dr. M.G. Ivanchenko (Oregon State University, Corvallis, USA). Seeds were germinated on moist filter paper in petri dishes and, after one week, plantlets were transferred to 250-ml pots containing peat-based substrate (Hawita Flor, Vechta, Germany, http://www.hawita-gruppe.de). Plants were grown at 26ºC under a 15-h-day/9-h-night cycle and 250 µmol m-2 sec-1 of irradiance provided by high pressure sodium lamps, and were watered with a nutrient solution (12 mM NO3, 0.5 mM N-NH4, 1.30 mM P; 8 mM K; 4 mM Ca; 1.19 mM Mg; 9 mM Na; 1.59 mM S-SO4; 9.87 mM Cl; 19.5 mM Fe; 28.6 mM B; 3.6 mM Cu; 4.5 mM Zn; 10.9 mM Mn and 0.2 mM Mo) as needed for three weeks before being used in the experiments. The electric conductivity of the nutrient solution was of 2.84 mS cm-1 and the pH was adjusted to 5.8. To prepare this solution, a 200-fold concentrated stock solution was made by dissolving the following compounds in 10 litres of water: 1.079 Kg Ca(NO3)2, 1.317 Kg KNO3, 14 g Fe-EDDHA, 0.212 Kg MgSO4, 0.354 Kg KH2PO4, 36 g K2SO4, 30 g Chelamix 5 WG, 3 g H3BO3.
Four-week-old plants were used in most experiments but behavior of three-week old plants was also assessed. Unless stated otherwise, each treatment consisted of twelve plants and experiments were repeated three times. Root number was recorded in all experiments.
2.2 · Submergence and hypoxic conditions
For experiments involving plant submergence, glass tanks (25 cm x 30 cm x 49 cm) were used. Four-week-old plants still growing in the organic potting mix were placed inside the tanks and were flooded with tap water. In preliminary experiments, different water levels were used so that plant response to root, root and shoot and complete submergence was observed. Subsequently, all experiments involved submergence up to the first node above the cotyledonary one, since this condition resulted in abundant AR production (Figure 2.1). For control treatments, plants were put inside the tanks and kept at field capacity. In all cases, plants were allowed to acclimatize for two days in the containers before the start of treatments. The light intensity at the plant level inside the tanks was between 60 and 80 µmol m-2 s-1 photosynthetically active radiation. Flooding treatments were always initiated at 9 am. Hypoxic treatments were performed using a transparent acrylic airtight chamber into which 1% oxygen was insufflated (Figure 2.2).
Figure 2.1: Four-week old plant showing the water level used for flooding experiments. Hypocotyls (H) were below the water level while epicotyls (E) were above the water surface.
Figure 2.2: Hypoxic chamber used to treat plants with 1% oxygen.
2.3 · Inhibitor and ACC treatments
Plants were treated with either the ethylene biosynthesis inhibitor aminoethoxyvinylglycine (AVG) (32999, Fluka, Sigma-Aldrich, http://www.sigmaaldrich.com) or the auxin transport inhibitor 1-naphthylphthalamic acid (NPA) (33371, Fluka, Sigma Aldrich). The aerial part of the plants was sprayed with 500 µM AVG or 1 mM NPA 12 h before the start of flooding and at the beginning of the light phase for
the first three days. NPA was diluted in small amounts of DMSO so that the final concentration in the solution was 0.004%. Instead, AVG was diluted in distilled water. Inhibitors were applied in aqueous solutions containing 0.1% Tween 20® to improve the adhesion of the chemical to the leaves. Control plants were sprayed with aqueous solutions containing 0.1% Tween 20® alone or 0.1% Tween 20® + 0.004% DMSO in experiments regarding AVG and NPA, respectively.
With the aim of assessing ACS3 and ACS7 induction after ACC treatment, one-week old plantlets were placed in a 6-well plate and treated with an aqueous solution of 10 µM ACC for 24 h. Two plantlets were set in each well in contact with the solution and hypoxia was prevented by placing the plates in a shaker. Experiments were repeated three times.
2.4 · Grafting experiment
Three-week-old plants corresponding to the ethylene insensitive Nr mutant and its WT parental cv. Gimar were used. Plants of both genotypes were grafted in all four possible combinations using the cleft graft method. Stems were transversally sectioned approximately 2 cm above the cotyledonar node so that the wound did not affect the hypocotyl. As a result, some plants carried Nr as rootstock and WT (cv. Gimar) as scion, whereas others carried the opposite arrangement. Plants in which the Nr and WT were grafted on the same genotype were also produced. These two combinations provided a control for the graft wounding effect. The graft area was covered with a piece of cotton and both parts were held together using a clothespin for one week (Figure 2.3). Ten plants were obtained per combination. Submergence treatments began two weeks after grafting, when plants were five weeks old. Water
levels completely covered hypocotyls but did not reach the grafting point (Figure 2.4).
Figure 2.3: Grafting experiment involving the ethylene insensitive mutant Nr and its WT (Gimar): grafted plant before the removal of the clothespin.
Figure 2.4: Detail of grafting area showing the scion and rootstock. The arrow indicates the water level.
2.5 · Sample harvest, RNA isolation and real time PCR
Samples from roots, hypocotyls, and epicotyls were collected at different times from the beginning of treatments, immediately frozen in liquid nitrogen and kept at -80ºC until used for RNA extraction. Total RNA from different tissues was extracted using a previously described method (Perata et al., 1997) including a minor modification (omission of aurintricarboxylic acid) to make the protocol compatible with subsequent
PCR procedures. 1% agarose gel electrophoresis was carried out with all RNA samples to check for RNA integrity, followed by spectrophotometric quantification. Contaminating DNA was removed using a TURBO DNA-free kit (Ambion, Austin, TX, USA, http://www.ambion.com/). RNA was then reverse-transcribed using a High-Capacity cDNA Archive kit (Applied Biosystems, Foster City, CA, USA, http://www3.appliedbiosystems.com). Expression analyses of genes LeADH2 (Lycopersicon esculentum ALCOHOL DEHYDROGENASE 2), LeACS1A (Lycopersicon esculentum AMINOCYCLOPROPANE-CARBOXYLIC ACID SYNTHASE 1A), LeACS1B (Lycopersicon esculentum 1-AMINOCYCLOPROPANE-1-CARBOXYLIC ACID SYNTHASE 1B), LeACS2 (Lycopersicon esculentum 1-AMINOCYCLOPROPANE-1-CARBOXYLIC ACID SYNTHASE 2), LeACS3 (Lycopersicon esculentum 1-AMINOCYCLOPROPANE-1-CARBOXYLIC ACID SYNTHASE 3), LeACS4 (Lycopersicon esculentum 1-AMINOCYCLOPROPANE-1-CARBOXYLIC ACID SYNTHASE 4), LeACS5 (Lycopersicon esculentum 1-AMINOCYCLOPROPANE-1-CARBOXYLIC ACID SYNTHASE 5), LeACS6 (Lycopersicon esculentum 1-AMINOCYCLOPROPANE-1-CARBOXYLIC ACID SYNTHASE 6), LeACS7 (Lycopersicon esculentum 1-AMINOCYCLOPROPANE-1-CARBOXYLIC ACID SYNTHASE 7), LeNR (Lycopersicon esculentum Never-ripe ethylene receptor), LeEF1a (Lycopersicon esculentum ELONGATION FACTOR 1-ALPHA) and LeACT7 (Lycopersicon esculentum ACTIN 7) were performed by real time PCR. Specific primers were designed using Primer 3 software, in order to make them suitable for SYBR Green. Each pair of primers was then checked with the NetPrimer software to avoid pairs that would form secondary structures. Subsequently, BLAST function from NCBI was used to confirm that each primer was specific for the gene of interest, after which PCR amplification was carried out using the following conditions: 94°C for 3 min followed by 35 cycles of denaturing at 94°C for 30 sec, annealing at
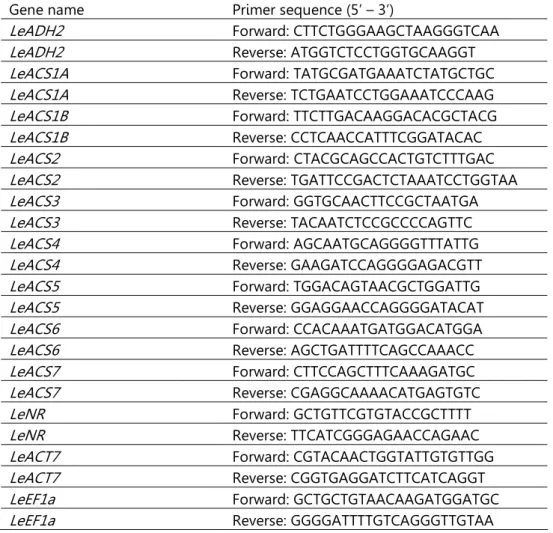
60°C for 1 min and extension at 72°C for 30 sec. Finally, 10 min of extension at 72°C were allowed to complete primer extension. After this, the presence of a unique band was assessed by electrophoresis. Finally, primers were tested in a real time PCR in which amplification and dissociation curves were checked. The specific primers are listed in Table 2.1.
Table 2.1: Specific primers used for real time RT-PCR (SYBR® Green).
Gene name Primer sequence (5’ – 3’)
LeADH2 Forward: CTTCTGGGAAGCTAAGGGTCAA
LeADH2 Reverse: ATGGTCTCCTGGTGCAAGGT
LeACS1A Forward: TATGCGATGAAATCTATGCTGC
LeACS1A Reverse: TCTGAATCCTGGAAATCCCAAG
LeACS1B Forward: TTCTTGACAAGGACACGCTACG
LeACS1B Reverse: CCTCAACCATTTCGGATACAC
LeACS2 Forward:CTACGCAGCCACTGTCTTTGAC
LeACS2 Reverse: TGATTCCGACTCTAAATCCTGGTAA
LeACS3 Forward: GGTGCAACTTCCGCTAATGA
LeACS3 Reverse: TACAATCTCCGCCCCAGTTC
LeACS4 Forward: AGCAATGCAGGGGTTTATTG
LeACS4 Reverse: GAAGATCCAGGGGAGACGTT
LeACS5 Forward: TGGACAGTAACGCTGGATTG
LeACS5 Reverse: GGAGGAACCAGGGGATACAT
LeACS6 Forward: CCACAAATGATGGACATGGA
LeACS6 Reverse: AGCTGATTTTCAGCCAAACC
LeACS7 Forward: CTTCCAGCTTTCAAAGATGC
LeACS7 Reverse: CGAGGCAAAACATGAGTGTC
LeNR Forward: GCTGTTCGTGTACCGCTTTT
LeNR Reverse: TTCATCGGGAGAACCAGAAC
LeACT7 Forward: CGTACAACTGGTATTGTGTTGG
LeACT7 Reverse: CGGTGAGGATCTTCATCAGGT
LeEF1a Forward: GCTGCTGTAACAAGATGGATGC
Each sample consisted of a pool from four plants and experiments were repeated three times. Real time PCR was performed using the ABI Prism 7000 Sequence Detection System (Applied Biosystems). Quantitative PCR was carried out using 50 ng of cDNA and Power SYBR®
Green PCR Master Mix (Applied Biosystems), following the manufacturer’s instructions (Table 2.2 and Figure 2.5). LeEF1A and LeACT7 expressions were used as endogenous controls. Relative expression levels were calculated using Genorm (http://medgen.ugent.be/~jvdesomp/genorm/).
Table 2.2: Master mix composition used for SYBR® Green real time RT-PCR.
Figure 2.5: Amplification cycle settings: upper rectangles indicate the temperature, whereas the lower ones indicate the duration of each temperature.
Sybr Green RT-PCR Vol 2X Power Sybr Green Mix 7.5µl
Forward primer 10µM 0.45µl Reverse primer 10µM 0.45µl Sigma Water 1.6µl
cDNA10ng/µl 5
2.6 · Ethylene quantification
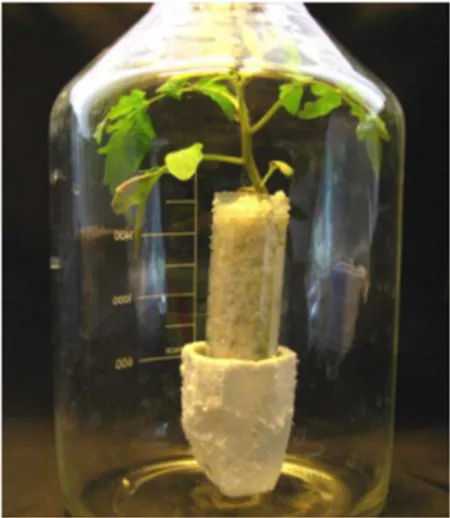
Ethylene production was measured in different tissues harvested 24 h after the onset of flooding or hypoxic treatments, as well as in material collected from the control plants. Each treatment was applied to five plants and experiments were repeated 3 times. Samples consisted of leaves (first young fully expanded leaf), epicotyls (pieces of stem ~2 cm long taken 1 cm above the water level) and hypocotyls (pieces of submerged stem under the cotyledonary node) from AC. Once excised, tissues were immediately weighed and placed in 10 ml or 30 ml flasks for stem parts and leaves, respectively, and incubated for 1h. In addition, whole AC, dgt, Gimar and Nr plants were grown in a sterile substrate (perlite) for four weeks and placed inside 2-litre glass bottles for flooding treatment (Figure 2.6). After 24 h, the water was removed, bottles were sealed and gas samples were taken after 1 h incubation. Ethylene was therefore measured as “de-submergence-induced ethylene”, which is a good indicator of ethylene production/ACS accumulation during flooding and would reflect the full potential of the ethylene biosynthetic machinery (Geisler-Lee et al., 2010). All glass containers had holed plastic caps with rubber septa underneath through which 1-ml samples were collected from the head space using a hypodermic syringe. Ethylene concentrations were determined with a gas chromatograph (GC) (Hewlett-Packard 6890; Hewlett-Packard, Palo Alto, CA, USA, http://www.hp.com) equipped with a dual flame ionization detector and a metal column (150 x 0.4 cm ID) packed with alumina (70-230 mesh). The column and detector temperatures were 70ºC and 350ºC, respectively. N2 was used as a carrier at a flow rate of 30 ml min-1. Ethylene identification was performed by comparison with a pure standard. Quantification was achieved using the external standard
technique. Ethylene production was calculated on the basis of the fresh weight (FW) of samples and expressed as nl g-1 h-1.
Figure 2.6: Detail of four-week old plant grown hydroponically and placed inside a 2-litre bottle for the 24-h flooding treatment and subsequent ethylene quantification.
2.7 · Auxin quantification
Plant material (~500 mg) from flooded and control plants was collected. Samples consisted of epicotyls and hypocotyls (similar to those for ethylene quantification) from AC, Gimar and Nr plants. Each sample was the result of pooling material from five plants. Tissues were ground and extracted with 70% (v/v) aqueous acetone (5 ml). The homogenate was shaken for 3 h and then centrifuged at 2500 g for 10 min. A supernatant was collected and another 5 ml acetone was added to the pellet. Shaking and centrifugation were repeated three more times, one of which consisted in an overnight shaking. Supernatants were then pooled and acetone was evaporated using a rotating evaporator (Rotavapor R114, Büchi, Flawil, Switzerland, http://www.buchi.com) and a water bath at 35ºC (Waterbath B480, Büchi, Flawil, Switzerland). The remaining aqueous solution was then acidified to pH 2.8 with HCl, shaken three times with
equivalent volumes of ether for 30 sec, and the supernatant collected each time was pooled. Subsequently, samples were dried under N2 and methylated with 200 µl diazomethane. Samples were diluted using TBS buffer, which was prepared by dissolving 3.03 g Trizma base, 5.84 g sodium chloride, 0.20 g magnesium chloride hexahydrate and 0.20 g sodium azide in 800 ml distilled water. Following, pH was adjusted to 7.5 and volume was adjusted to 1 liter. A quantitative determination of Indole-3-acetic Acid (IAA) was carried out by competitive ELISA (Phytodetek® IAA Test Kit, Agdia, http://www.agdia.com). A stock solution was prepared by dissolving methylated IAA in absolute methanol in order have a final concentration of 10 µmole IAA/ml. Standards were prepared by diluting this solution with TBS buffer. Standard concentration went from 5000 picomoles IAA/ml to 78 picomoles IAA/ml, as indicated by the kit manufacturer. A control consisting of only TBS buffer was also used. Standards and samples were run in duplicate and experiments were repeated three times. Optical density at 405 was determined by an ELISA microplate reader.
2.8 · Microscopy and photography
Microscopic observations were performed using a Nikon TMS-F microscope or a Nikon SMZ-2T stereomicroscope (Nikon, http://www.nikon.com). Photos of hypocotyl or root sections under different treatments and at different times after the start of flooding were taken with a DS-U2 Nikon digital sight camera (Nikon, Tokyo, Japan). The NIS-elements F2.20 imaging software (Laboratory Imaging, Nikon, Tokyo, Japan) was used for capturing the image.
Viability staining in stem sections of four-week-old tomato plants was performed according to the protocol reported by Lombardi et al. (2007).
Hypocotyl cross sections were stained with fluorescein diacetate (FDA, 2 µg ml-1 in 20 mM CaCl2, Sigma) for 15 min followed by N-(3-triethylammoniumpropyl)-4- 6-(4-(diethylamino) phenyl)-hexatrienyl) pyridinium dibromide (Synaptored, 20 µM in 20 mM CaCl2, Sigma) for 3 min. Nucella were observed under a Leica DMLB microscope and images were captured by a Leica DC 300F CCD camera. An argon and a krypton laser were used for visualization of the FDA (λex 488 nm, λem 502–540) and Synaptored (λex 515, λem 625) signals, respectively.
Hypocotyl integrity was also assessed with a cryo-SEM. Hypocotyls were excised from control and flooded plants (after 14 days of flooding treatment) and immediately placed in liquid N2. Frozen-hydrated samples were then moved to a cryo-preparation chamber in which they were freeze-fractured by microtome at -120°C. Water from each sample surface was allowed to evaporate for approximately 5 min at -80°C under high vacuum, and then samples were sputter-coated with 10-20nm of gold in an argon atmosphere. Subsequently, samples were transferred to a cryostage at -180°C inside the scanning electron microscope (SEM 515, Philips, The Netherlands). Slow-scan images were digitized at 768×576 pixels (256 grey levels) and analyzed with the AnalySIS 2.1 (Soft-Imaging Software GmbH, Germany).
2.9 · GUS assay
GUS activity was analyzed after staining hypocotyl sections for 40 min at 37ºC. The staining solution was made up of 1mM X-glucuronide, a 100 mM phosphate buffer pH 7, 10 mM EDTA, 0.01% Triton X-100, and 500 µM each of K3FeCN6 and K4FeCN6. Samples were de-stained with several changes of 95% ethanol at room temperature and subsequently placed in 70% ethanol. Pictures were then taken using a Nikon SMZ-2T
stereomicroscope. Three-week-old transgenic plants containing the IAA-inducible promoter as well as their WT (Chico III) were submerged for 24 h before cross sections were made.
3 · RESULTS
3.1 · Induction of adventitious roots in flooded tomato plants
Tomato plants normally form AR primordia during their development. However, these primordia do not elongate unless some exogenous stimulus triggers this growth. In order to observe the behavior of Ailsa Craig cultivar under different water levels, four-week old plants were exposed to three flooding conditions. Figure 3.1 shows the effect of waterlogging and submersion for up to one week. When submergence comprised only roots, epinasty was milder than in the case of half plant submergence. Complete plant submergence resulted in plant death after 10 days, probably due to the fact that plants did not elongate to reach the air or were not able to go into quiescence as tolerant plants do.
Figure 3.1: Root, half plant and complete submergence in four-week old WT tomato plants at the start, after 72 h and after 7 days of treatment.
In this experiment, it was possible to observe that AR formation was limited to the root neck when only roots were submerged whereas they developed along the submerged stem in the case of half plant submergence (Figure 3.2). Since the purpose of the research was to study AR formation, in the subsequent experiments plants were submerged up to the first node above the cotyledonary one, which made it possible to unequivocally discriminate between adventitious and lateral roots. When plants were completely submerged, few ARs started to develop at the base of the stem after 72 h of treatment, but they did not grow as much as those in partial stem or root submergence.
Figure 3.2 (previous page): Detail of the lower stem in four-week old WT plants showing AR formation after exposure to different flooding treatments. The yellow arrow indicates the site of emergence of some ARs.
When root and partial shoot submergence were applied to three-week old plants, they did not produce abundant ARs as four-week old plants. The few new roots that plants were able to produce emerged at the base of the stem and were very short even after one week of treatment (Figure 3.3). This might be due to the fact that most root initials may develop when plants are older than three weeks, whereas many of them may already be present in four-week old plants, allowing them to respond fast after the onset of the stress. As a consequence, the following experiments were carried out with plants that were four weeks old.
Figure 3.3: Reduced AR formation in three-week old WT plants after one week of submergence up to the first node above the cotyledonary one. On the left: a control plant showing no AR production. On the right: flooded plant with few new ARs.
In order to study the timing of AR production, the hypocotyl area was closely observed after 4 h, 8 h, 12 h, 24 h, 48 h, 72 h and 7 days from the start of the flooding treatment. There were no visible changes in the hypocotyl region for 24 h from the onset of flooding treatment (Figure 3.4). After 48 h a low number of primordia could be noticed, although they still did not emerge from the stem tissues. Interestingly, after 72 h of submergence, AR primordia were visible on the hypocotyl surface and a