DOI 10.1140/epjc/s10052-015-3706-0 Regular Article - Experimental Physics
Measurements of the ZZ production cross sections in the 2l2ν
channel in proton–proton collisions at √s = 7 and 8 TeV
and combined constraints on triple gauge couplings
CMS Collaboration∗
CERN, 1211 Geneva 23, Switzerland
Received: 18 March 2015 / Accepted: 25 September 2015 / Published online: 29 October 2015
© CERN for the benefit of the CMS collaboration 2015. This article is published with open access at Springerlink.com
Abstract Measurements of the ZZ production cross sec-tions in proton–proton collisions at center-of-mass energies of 7 and 8 TeV are presented. Candidate events for the lep-tonic decay mode ZZ→ 2l2ν, where l denotes an electron or a muon, are reconstructed and selected from data cor-responding to an integrated luminosity of 5.1 (19.6) fb−1at 7 (8) TeV collected with the CMS experiment. The measured cross sections, σ (pp → ZZ) = 5.1+1.5−1.4(stat)+1.4−1.1(syst)± 0.1 (lumi) pb at 7 TeV, and 7.2+0.8−0.8(stat)+1.9−1.5(syst) ± 0.2 (lumi) pb at 8 TeV, are in good agreement with the stan-dard model predictions with next-to-leading-order accuracy. The selected data are analyzed to search for anomalous triple gauge couplings involving the ZZ final state. In the absence of any deviation from the standard model predictions, lim-its are set on the relevant parameters. These limlim-its are then combined with the previously published CMS results for ZZ in 4l final states, yielding the most stringent constraints on the anomalous couplings.
1 Introduction
The production of pairs of Z bosons in proton–proton col-lisions is a rare diboson process in the Standard Model (SM). The measurement of the cross section and proper-ties of this process probe the self-interaction of electroweak gauge bosons. The ZZ final state is also an important back-ground in searches for other interesting processes beyond the SM, such as the production of high-mass Higgs bosons and their subsequent decay to pairs of bosons [1] or super-symmetry [2]. Because of the non-Abelian structure of the electroweak gauge theory, vector bosons can interact among themselves and can couple in triplets (e.g. WWZ) or quartets (e.g. WWZZ). All couplings involving only bosons without electric charge are expected to be null at tree level, leading to the absence of triple gauge couplings for Zγ γ , ZZγ , and ∗e-mail: [email protected]
ZZZ. An enhancement in the measured rate of ZZ production compared to the expectation from the SM could indicate the existence of anomalous boson couplings.
This paper presents measurements of the ZZ production cross sections in proton–proton collisions at the LHC at two different center-of-mass energies, 7 and 8 TeV, in the decay channel with two charged leptons, electrons (ee) or muons (µµ), and a neutrino-antineutrino pair of any fla-vor (ν¯ν). The data were collected with the CMS detector at 7 (8) TeV, corresponding to 5.1 (19.6) fb−1 of integrated luminosity.
At tree level, ZZ pairs are primarily produced in the SM via the t- and u-channels, following the annihilation of a quark–antiquark pair in proton–proton collisions. Because of the high gluon–gluon parton luminosity, the gg → ZZ contribution has to be included. The production cross sec-tion calculated up to next-to-leading-order (NLO) accuracy in strong coupling constant (αS) is expected to be 6.46+0.30−0.21 (7.92+0.37−0.24) pb at 7 (8) TeV [3], where the uncertainties refer only to the missing higher orders in the computation. These cross sections include a leading-order (LO) computation of the gg → ZZ contribution, which is formally a next-to-next-to-leading-order (NNLO) correction. Recently, com-plete NNLO cross sections for ZZ production accompanied by jets have also been computed [4], leading to a further small increase in cross section compared to Ref. [3]. How-ever, higher-order QCD corrections have been shown to be reduced significantly when vetoing events where the diboson system is produced in association with jets [5,6], as done in the present analysis. The NNLO QCD corrections apart from the LO gg → ZZ contribution are thus neglected in our simulations and in the reference cross sections to which our measurements are compared. Complete one-loop elec-troweak (EW) corrections to massive vector boson pair pro-duction [7,8] have also been published. The consequences of the EW corrections for ZZ production are that the transverse momentum ( pT) spectrum of the Z bosons falls more rapidly
and, in addition, the overall cross section decreases by about 4 % at LHC center-of-mass energies.
The production of ZZ pairs has been studied at the LHC by the ATLAS experiment, which analyzed the decay modes 2l2l′ and 2l2ν (l, l′ = e, µ) at 7 TeV [9], and by the CMS experiment, which considered 2l2l′final states (l= e, µ and l′= e, µ, τ) at 7 TeV [10] and 8 TeV [11]. Both experiments measured ZZ production cross sections in good agreement with the SM predictions and set limits on anomalous triple gauge couplings (ATGCs).
The branching fraction for the 2l2ν decay mode (where l denotes only e and µ) is approximately six times larger than that of the four-charged-lepton final state, and the sig-nal purity is enhanced at large values of the boson pT, where there is the greatest sensitivity to ATGC effects. For this rea-son, the 2l2ν channel has a sensitivity comparable to that of the 4l channel to ATGC. The characteristic signature is an overall imbalance in the transverse momentum of the event between the initial and the final states, which consequently appears as missing transverse energy (ETmiss) in the final state. Although the branching fraction is large, this channel is rather challenging due to the large contamination from background processes, in particular the Drell–Yan (DY) process, which has a cross section nearly five orders of magnitude larger than the signal. If the Z boson or the hadrons recoiling against it are not reconstructed correctly, then an apparent ETmissresults and these events can resemble the signal. Other important sources of background are diboson processes, WW and WZ, with fully leptonic decays, and t¯t production.
This paper presents a measurement of the ZZ produc-tion cross secproduc-tion in the 2l2ν channel as a funcproduc-tion of the transverse momentum ( pT) of the charged lepton pair. The distribution of the dilepton pT is sensitive to the presence of ATGCs. Limits are computed and finally combined with existing results from CMS in the four-charged-lepton final state.
2 CMS detector
The central feature of the CMS apparatus is a superconduct-ing solenoid of 6 m internal diameter, providsuperconduct-ing a magnetic field of 3.8 T. Within the superconducting solenoid volume are a silicon pixel and strip tracker, a lead tungstate crystal electromagnetic calorimeter (ECAL), and a brass and scintil-lator hadron calorimeter (HCAL), each composed of a barrel and two endcap sections. The silicon tracking system is used to measure the momentum of charged particles and covers the pseudorapidity range|η| < 2.5, where η = − ln (tan (θ/2)), and θ is the polar angle of the trajectory of the particle with respect to the counterclockwise-beam direction. The ECAL and HCAL extend to a pseudorapidity range of|η| < 3.0. A steel/quartz-fiber Cherenkov forward detector extends the
calorimetric coverage to |η| < 5.0. Muons are measured in gas-ionization detectors embedded in the steel flux-return yoke outside the solenoid.
The EmissT is defined as the magnitude of the missing trans-verse momentum or momentum imbalance, pmiss
T , which is the negative vector sum of the momenta in the plane trans-verse to the beam of all reconstructed particles (photons, elec-trons, muons, charged and neutral hadrons) in the event.
A more detailed description of the CMS detector, together with a definition of the coordinate system used and the rele-vant kinematic variables, can be found in Ref. [12]. 3 Simulation
Several Monte Carlo (MC) event generators are used to sim-ulate the signal and background processes. The ZZ→ 2l2ν signal and the WW → 2l2ν and WZ → 3lν background processes are simulated using MadGraph 5 [13], as well as Z+ jets, W + jets, and t¯t + jets processes. Single top-quark processes are simulated with powheg [14]. In the simulation, vector bosons are allowed to decay to leptons of any flavor (e, µ, τ ), since τ leptons can contribute to dielectron and dimuon final states through τ → e and τ → µ decays. For all these processes, the parton showering is simulated with pythia 6 [15] with the Z2 (Z2*) tune for 7 (8) TeV simulations [16]. The cross section of the ZZ signal is computed with the NLO generator mcfm [3], which includes contributions from gluon–gluon initial states. Since the present cross section measurement and ATGC analysis rely on the pT distribu-tion of Z bosons, a precise predicdistribu-tion of this distribudistribu-tion is required. The charged dilepton pTspectrum of ZZ→ 2l2ν, generated with MadGraph and interfaced with pythia for parton showering, is found to be in good agreement with the corresponding spectrum computed at NLO in QCD with mcfm and therefore no differential correction for NLO QCD effects is applied to the MadGraph simulated sample. In addition, the effect of NLO EW corrections [7,8] is taken into account by reweighting the ZZ and the WZ events as a function of the partonic kinematic variables, and applying weights derived from the calculations described in Ref. [7]. These corrections yield an overall reduction of 4.1 % of the ZZ cross section, as well as a softening of the boson pT spec-tra that results in a reduction of the differential cross section of about 20 % at Z pTof 300 GeV.
Simulated samples of the ZZ→ 2l2ν process that include contributions from ATGCs (see Sect.8) are produced using the LO generator sherpa [17]. These samples are based on a LO matrix-element simulation including up to two additional jets, matched to parton showers.
The parton distribution functions (PDF) are modeled with the CTEQ6L [18] parametrization in samples generated with MadGraph, and the CT10 parametrization [19] in samples
generated with powheg and sherpa. The detector response to the simulated events is modeled with Geant4 [12,20]. 4 Event selection
The signal consists of two Z bosons, one decaying into a pair of oppositely charged leptons and the other to two neutrinos that escape direct detection. The final state is thus character-ized by: a pair of oppositely charged, isolated electrons or muons, with an invariant mass within a Z-boson mass win-dow, no additional leptons, and large Emiss
T .
Events are selected using triggers that require the presence of two electrons or two muons, with minimum pTthresholds on each lepton that depend on the dataset. The trigger thresh-olds in the 8 TeV dataset are 17 and 8 GeV for the leptons with higher and lower pT, respectively. The thresholds for the 7 TeV data samples are the same or lower. The 8 TeV data sample also includes events that satisfy a single isolated muon trigger to ensure the highest efficiency. For events with two identified and isolated leptons having invariant mass between 83.5 and 98.5 GeV and dilepton pT > 45 GeV, the trigger efficiency is higher than 98 % in the dielectron channel and varies from 94 to 98 % in the dimuon channel. In addition, single-photon triggers or electron-muon triggers are used to select control samples for the background determinations.
Electrons are selected inside the fiducial region of ECAL. The electron candidates must have a minimum pTof 20 GeV, and satisfy standard identification criteria, based on shower shape, track quality, cluster track matching, in order to reject misidentified hadrons [21].
The muons are selected inside the fiducial region of the muon spectrometer, with a minimum pTof 20 GeV, and sat-isfy standard identification criteria based on track informa-tion and isolainforma-tion [22].
Events are selected if they include a pair of same-flavor, oppositely charged leptons that pass the identification and isolation criteria. In order to suppress backgrounds that do not include a Z boson, the lepton pair is required to have an invari-ant mass compatible with the Z-boson mass, between 83.5 and 98.5 GeV. The pTof the dilepton pair is required to be greater than 45 GeV. This requirement is particularly effec-tive at reducing the DY background because the Z bosons produced in ZZ events have, on average, larger pTthan those from single Z-boson production.
Since the ZZ pair is produced in the collision of two hadrons, the event might have jets from initial-state radia-tion. We use jets reconstructed from particle-flow (PF) candi-dates, using the anti-kTalgorithm [23] with a distance param-eter of 0.5. The jet transverse energy is corrected using the CMS standard prescriptions for jet energy scale (JES) cal-ibration [24]. Only jets with a corrected pT greater than 10 GeV and reconstructed within|η| < 5 are used in this
analysis. Further corrections are applied to reduce the effect of secondary proton–proton collisions overlapping with the primary interaction (pileup). An extra correction is applied to jets in the MC samples to match the resolution observed in data. In order to reject jets dominated by instrumental and beam-related noise, loose identification criteria are applied, based on the multiplicity and energy fraction of charged and neutral particles.
In order to suppress background coming from top quarks, events are vetoed if they have a jet identified as a b-quark jet (b-tagged). A requirement based on a combined secondary vertex discriminator [25] is applied to b-tagged jets with
pT >20 GeV within the tracker fiducial region (|η| < 2.4). The misidentification probability for light-parton jets is about 10 %, whereas the efficiency for b-jets is more than 80 %. To further reduce top-quark and other backgrounds with hadronic activity, events are rejected if they contain any jet with pT>30 GeV.
A good Emiss
T measurement is critical for the extraction of the ZZ → 2l2ν signal given that the ETmiss distinguishes this process from the DY background. Since the average
Emiss
T of the signal is moderate (∼50 GeV), we cannot simply require a high ETmiss. We follow the approach of construct-ing a “reduced Emiss
T ” variable, as done in the D0 [26,27] and OPAL [28] experiments. The concept behind a reduced
ETmissis to reduce the instrumental contribution to mismea-sured Emiss
T by considering possible contributions to fake
Emiss
T . In each event, pmissT and jet momenta are decomposed along an orthogonal set of axes in the transverse plane of the detector. One of the axes is defined by the pTof the charged dilepton system, the other perpendicular to it. We define the recoil of the l+l−system in two different ways: (1) the clus-tered recoil (Rc) is the vectorial sum of the momenta of the PF jets reconstructed in the event, and (2) the unclustered recoil (Ru) is the vectorial sum of the transverse momenta of all PF candidates in the event, with the exception of the two leptons. On each axis (i = parallel/orthogonal to the dilepton system pT), the reduced ETmissprojection is defined as reduced ETmissi = −pTll,i− Rc/ui ,
where Ri
c/urepresents the choice of Rcor Ruthat minimizes the absolute value of that reduced ETmisscomponent, and pll,iT is a projection of the transverse momentum of the Z boson. The presence of genuine Emiss
T in the recoil of the charged dilepton system is expected to be evident in the parallel pro-jection, while the component perpendicular to the l+l− sys-tem is mostly dominated by jet and Emiss
T resolution. The absolute reduced EmissT variable is the sum in quadrature of the two components. The reduced Emiss
T shows better DY background suppression than the standard PF Emiss
T at the same signal efficiency. It is also found to be more stable than the PF Emiss
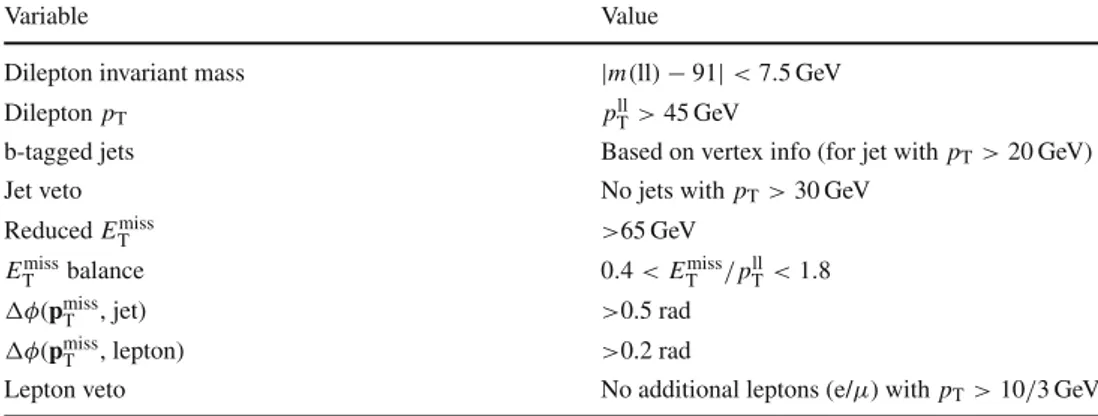
Table 1 Summary of the
optimal signal selection Variable Value
Dilepton invariant mass |m(ll) − 91| < 7.5 GeV
Dilepton pT pTll>45 GeV
b-tagged jets Based on vertex info (for jet with pT>20 GeV)
Jet veto No jets with pT>30 GeV
Reduced Emiss T >65 GeV Emiss T balance 0.4 < ETmiss/pllT<1.8 (φ(pmiss T , jet) >0.5 rad (φ(pmiss T , lepton) >0.2 rad
Lepton veto No additional leptons (e/µ) with pT>10/3 GeV
The Emiss
T balance variable is defined as the ratio between the PF EmissT and the transverse momentum of the leptonically decaying Z boson, namely Emiss
T /pllT. Values of this variable far from unity identify events in which the leptonic Z-boson candidate is not well balanced by genuine EmissT from neu-trinos, but recoils against mismeasured jets or leptons. The selected sample can still be contaminated by events with jets with pTbelow the veto threshold.
A mismeasurement of the jet energy can produce mis-measured pmiss
T aligned with the jet direction in the trans-verse plane. These events are characterized by a small azimuthal angle between the pmiss
T vector and the clos-est jet, (φ(pmiss
T , jet). This distribution is used to reject Z+ jets events that have a small (φ angle. The mismea-surement of a lepton pTcan also produce mismeasured EmissT . Although this effect is usually negligible, given the good lep-ton momentum resolution in CMS, events are found where a large Emiss
T value (>60 GeV) is accompanied by a small angle between the pmiss
T and the pTof a lepton. Events with
Emiss
T >60 GeV and (φ(pmissT ,lepton) <0.2 rad are there-fore rejected.
In order to suppress the WZ background, with both bosons decaying leptonically, events are required to have no addi-tional leptons. To improve the rejection power, the pT thresh-old is lowered to 3 GeV for additional muons, and 10 GeV for electrons. Furthermore, these muons and electrons are selected with looser criteria than those used to reconstruct the Z-boson candidate.
The variables described above are used to extract the sig-nal sample for the cross section measurement. We optimize the requirements in the final selection in order to minimize the total uncertainty in the measured cross section at 8 TeV (see Sect.7). The same selection is applied to the 7 TeV data. For this purpose, we scan a series of possible analysis selec-tions, in which we vary the dilepton mass window and pT threshold, the minimum pTof jets used in the computation of the reduced Emiss
T variable, and the reduced ETmiss require-ment. We optimize the selection using MC estimates of the background processes, or using predictions based on
con-trol samples in data from the DY, top-quark, and WW back-grounds, as described in Sect.5, and we find similar results for the optimal requirements and for the measured cross section. For the final optimization we choose the selection obtained using background estimates from data. The requirements are summarized in Table1. With this selection, the acceptance for ZZ → 2e2ν and ZZ → 2µ2ν events is about 10 % for both channels, at 7 and 8 TeV.
5 Background estimation
Although the DY process does not include genuine ETmiss from neutrinos, the tail of the reduced Emiss
T distribution can be contaminated by these events due to detector energy res-olution, jet energy mismeasurements, pileup energy fluctua-tions, and instrumental noise. Given that the simulation may not fully reproduce detector and pileup effects on the reduced
ETmissdistribution, especially in the tails, and that the simula-tion is limited in statistical precision, we build a model of DY background from control samples in data. For this purpose we use a process that has similar jet multiplicity, underly-ing event, and pileup conditions as the DY process for the region of interest at high boson pT: the production of prompt isolated photons in association with jets (γ + jets) [29]. We expect that an accurate description of the Emiss
T distribution and other related kinematic variables can be obtained from this photon + jets sample. However, some corrections must be applied to the photon + jets sample to ensure a good mod-eling of the DY process. The yield of photon events is scaled to the observed charged dilepton system yield as a function of the boson pTafter applying the jet veto to both samples. This accounts for the differences in the selection efficiency of the dilepton and photon candidates and corrects for the trigger prescales, which are applied to the low- pT photon triggers.
Only photons in the barrel region are used because the purity and resolution are better than in other regions. Fol-lowing Ref. [1], the selection of photon events is based on
shower shape, isolation in the tracker, and energy deposits in ECAL, and HCAL. After this selection, several processes with instrumental Emiss
T contribute to the photon sample: sin-gle γ events, double γ events where one photon escapes detection or fails the identification, and QCD events with a jet misidentified as a photon. Processes with genuine Emiss
T can also contaminate this sample: W/Z+γ with the W/Z boson decaying to lν/νν, or W+ jets with the W boson decaying to eν and the electron misreconstructed as a photon. Although these processes have generally lower cross sections, they are characterized by large Emiss
T values, and thus contribute to the tails of the distribution, where it is most important to measure the residual instrumental background. In order to reduce these background contributions, specific selections are applied. The event must have exactly one photon and no leptons. Only jets with (R=!((φ)2+ ((η)2>0.4 from the photon are used for all the jet-related selections (jet veto, reduced ETmiss, etc.). To avoid misreconstruction of the pho-ton energy, a conversion veto is applied using the number of missing expected tracker hits and the distance of closest approach between the reconstructed conversion tracks.
The remaining contribution from W+ γ and W/Z + γ events after this selection is estimated from simulation and subtracted from the photon data model. For this purpose, a set of simulated photon samples is used that includes γ + jets, QCD events with a jet misidentified as a photon (generated with pythia), W+ γ → lνγ , and Z + γ → ννγ (generated with MadGraph). These samples are normalized to their respective cross sections computed at NLO in QCD. The full set of MC samples is reweighted and corrected following the same procedure as that used for the photon data sample. Finally, the photon data are corrected as a function of Emiss
T by multiplying them by unity minus the fraction of electroweak processes in the simulation.
We apply a different data-based method to estimate the total number of background events from processes that do not involve a Z boson: i.e. WW and top-quark production. We denote these events as nonresonant background (NRB). In order to measure this contribution, a control sample based on eµ candidate events is selected by applying the same requirements as in the main analysis. The NRB yields in the same-flavor channels (ee and µµ) are obtained by scal-ing the number of events in the control sample. The rescalscal-ing is done by means of correction factors, measured from the sidebands (SB) of the Z-boson mass peak, i.e. in the regions 55–70 and 110–200 GeV. The scale factors are measured in a looser selection region in order to improve the statistical precision. We require the reduced Emiss
T >65 GeV in order to suppress the DY contribution from τ+τ−. We also require at least one b-tagged jet with pT>20 GeV, to further reduce DY and other backgrounds, and increase the fraction of top-quark events. The scale factors are defined as follows:
αee/µµ= Nee/µµSB /NeµSB, (1)
and the NRB contamination in the Z-peak region is:
Nee/µµpeak = αee/µµNeµpeak. (2) The validity of the method is tested in simulation by com-paring the predicted background to the expected number of WW and top-quark events.
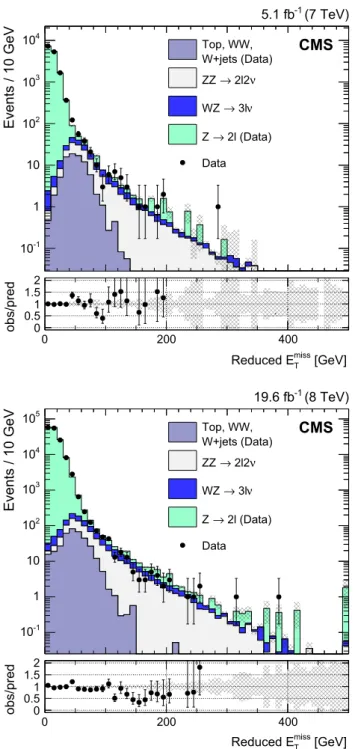
Figure1shows the reduced ETmissdistributions in dilep-ton data and simulation, using the phodilep-ton model to describe the DY background and the data-driven estimation for NRB. A good agreement is found in the region dominated by the DY process, up to about 80 GeV, while the higher part of the spectrum is dominated by diboson production. The error bands shown in Fig. 1 represent the statistical uncertainty in the predicted yields. A systematic uncertainty in the final DY event yield estimated with this method is computed as the relative difference between dilepton yields in data and sim-ulation, in a control region with Emiss
T <60 GeV, and it has been found to be 25 % (40 %) at 7 (8) TeV. This systematic uncertainty is not shown in Fig.1.
6 Systematic uncertainties
Different sources of systematic uncertainty are associated with the expected yields and distributions of signal and back-ground processes and of the data. The uncertainties reported in the following paragraphs affect the final event yields of the relevant processes.
6.1 Statistical uncertainty of the simulated and control samples
For the processes estimated from simulation, ZZ and WZ, the limited size of the MC sample affects the precision of the modeling, and is therefore taken as a systematic uncer-tainty in the shape of the kinematic distributions used in the cross section measurement and ATGC limit setting. Simi-larly, the backgrounds estimated from data are limited by the size of the control samples described in Sect.5: the eµ sam-ple for nonresonant backgrounds and the γ+ jets sample for DY background. These uncertainties are treated in the same way as those backgrounds that are estimated from simulation. This systematic uncertainty has been computed in different reduced Emiss
T bins or different pTbins and is used as shape errors in the fit.
6.2 Cross sections of ZZ and WZ
The cross sections for pp → ZZ + X → 2l2ν + X and
Events / 10 GeV -1 10 1 10 2 10 3 10 4 10 (7 TeV) -1 5.1 fb CMS W+jets (Data) Top, WW, ν 2l2 → ZZ ν 3l → WZ 2l (Data) → Z Data [GeV] miss T Reduced E [GeV] miss T Reduced E 0 200 400 obs/pred 0.50 1 1.52 Events / 10 GeV -1 10 1 10 2 10 3 10 4 10 5 10 (8 TeV) -1 19.6 fb CMS W+jets (Data) Top, WW, ν 2l2 → ZZ ν 3l → WZ 2l (Data) → Z Data 0 200 400 obs/pred 0.50 1 1.52
Fig. 1 Reduced Emiss
T spectrum in the inclusive ll (l= e, µ) channel
at 7 TeV (top) and 8 TeV (bottom), using the photon model to describe the DY contribution and NRB modeling for WW, W + jets, and top-quark production, after selections on the dilepton invariant mass and pT, jet veto, b-tagged jet veto, third lepton veto, and (φ(pmissT , jet),
as described in Sect.4. The gray error band represents the statistical uncertainty in the predicted yields
using mcfm version 6.2 [3], and using PDFs from the Les Houches accord PDF (lhapdf) program, version 5.8.7 [30]. The PDF+ αSuncertainty in the WZ cross section is evalu-ated as the maximum spread of the cross sections computed
at µR= µF = mZwith three PDF sets, including the
corre-sponding uncertainties from one standard deviation variation of the PDF parameters and the αS value [31]. It is found to be 3.1 % (4.2 %) at 7 (8) TeV.
The uncertainty from the renormalization and factoriza-tion scales is evaluated as the maximum difference between the central value of the cross section at µR= µF = mZand the central values computed at µR= µF = mZ/2 and 2 mZ, using each of the three PDFs recommended in Ref. [31]. An uncertainty of 5.9 % (5.4 %) at 7 (8) TeV is found for the WZ background. For the ZZ signal, we evaluate this theoretical uncertainty in the case of the exclusive produc-tion with 0 jets, to take into account the jet-veto applied in the signal selection, following the prescription described in Refs. [32,33]. The exclusive cross section for ZZ+ 0 jets is σ0 j = σ≥0 j−σ≥1 j, where σ≥njis the inclusive cross section of ZZ+ at least n jets, where n = 0, 1. According to Ref. [32], σ≥0 j and σ≥1 j are essentially uncorrelated, thus the uncertainty in σ0 jcan be computed as ϵ0 j =
"
ϵ2≥0 j+ ϵ2≥1 j, where ϵ≥0 j and ϵ≥1 j are the uncertainties in σ≥0 jand σ≥1 j, respectively. The cross sections are computed with mcfm, including the acceptance requirements on lepton pT and η, charged dilepton mass, and Emiss
T , as well as the jet veto, when relevant. The cross section uncertainties are estimated by varying the renormalization and factorization scales, as explained above. Since the charged dilepton pT spectrum is the observable from which limits on ATGCs are derived, the uncertainty in σ0 j is computed in different intervals of charged dilepton pT.
The uncertainty in the NLO EW correction to ZZ pro-duction, corresponding to missing higher-order terms in the computation, is estimated as the product of the NLO QCD and EW corrections [7]. The uncertainty in the EW correction to WZ production is estimated as 100 % of the correction, to account for the poorly known fraction of photon+ quark-induced events [8] passing the jet veto.
6.3 Acceptance
The kinematic acceptance for the signal is computed using mcfm. Kinematic requirements, based on those used in the signal selection, are applied to the charged leptons and neu-trinos at the generator level. The acceptance is determined by comparing the cross sections with and without the kine-matic requirements. The systekine-matic uncertainty is evaluated as the variation in the acceptance resulting from varying the renormalization and factorization scales from mZ to mZ/2 and 2 mZ, summed in quadrature with the variation obtained from using different PDF sets and from varying the PDF parameters and the αSvalue by one standard deviation. The result is 2.8 % at both 7 and 8 TeV.
6.4 Luminosity
The uncertainty in the luminosity measurement is 2.2 % in 2011, and 2.6 % in 2012 [34].
6.5 Lepton trigger and identification efficiency
Lepton trigger and identification efficiencies are determined from data, using the tag-and-probe technique with Z → ll events [35], and used to correct the simulated samples. The total uncertainty in the lepton efficiency amounts to about 3 % for ee events, and 4 % for µµ events.
6.6 Lepton momentum scale
The systematic uncertainty in the lepton momentum scale is computed by shifting the nominal momenta by ±1σ and propagating the variations to the reduced Emiss
T . We assume an uncertainty of 2 % (3.5 %) in the energy of electrons reconstructed in the ECAL barrel (endcap), and 1 % in the muon momentum. The resulting variations of the final yields are 2.5 % for the ee channel, and 1.0 % for the µµ channel and they are treated as a shape uncer-tainty.
6.7 Jet energy scale and resolution
The uncertainty in the calibration of the jet energy scale directly affects the jet veto, the calculation of reduced Emiss
T , and the selection of the balance variable. The JES uncer-tainty is estimated by shifting the jet energies by±1σ and propagating the variations to the reduced Emiss
T and all the other relevant observables. Uncertainties in the final yields of 3–4 (7–8) % are found for both the ee and µµ final states at 7 (8) TeV.
Similarly, a systematic uncertainty in jet energy resolu-tion (JER) is computed. As explained above, the energy of jets in simulation is corrected to reproduce the resolu-tion observed in data. Such correcresolu-tions are varied accord-ing to their uncertainties and these variations are propa-gated to all the observables and selections dependent on jet energy. An uncertainty in the final yields of less than 1 % is found in both ee and µµ final states: 0.4 % (0.8 %) at 7 (8) TeV.
Since the shapes of the distributions are expected to be affected by variations in the JES and the JER, these sources are treated as shape uncertainties in the extraction of the cross section.
6.8 b-jet veto
The b-tagging efficiency is taken from Ref. [36]. In simula-tion, the nominal working point for this b-tagger is shifted to
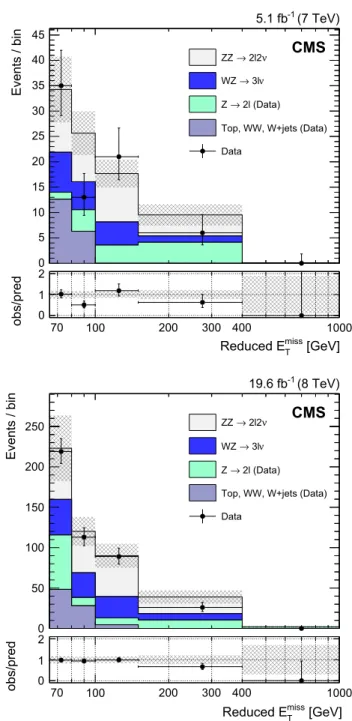
Events / bin 0 5 10 15 20 25 30 35 40 45 ν 2l2 → ZZ ν 3l → WZ 2l (Data) → Z
Top, WW, W+jets (Data) Data (7 TeV) -1 5.1 fb CMS [GeV] miss T Reduced E 70 100 200 300 400 1000 obs/pred 0 1 2 Events / bin 0 50 100 150 200 250 ZZ→ 2l2ν ν 3l → WZ 2l (Data) → Z
Top, WW, W+jets (Data) Data (8 TeV) -1 19.6 fb CMS [GeV] miss T Reduced E 70 100 200 300 400 1000 obs/pred 0 1 2
Fig. 2 Reduced Emiss
T distribution in ll (l= e, µ) channels, after the
full selection, at 7 TeV (top) and 8 TeV (bottom). The DY and WW, W+ jets, and top backgrounds are estimated with data-driven methods. The gray error band includes statistical and systematic uncertainties in the predicted yields. In the bottom plots, vertical error bars and bands are relative to the total predicted yields. In all plots, horizontal error barsindicate the bin width
reproduce the efficiency observed in data. The uncertainty in the measured efficiency is propagated to the event yields of the processes estimated from simulation by applying further shifts to the discriminator threshold. A very small uncertainty in the final yields of the MC samples is found: 0.1–0.15 % at both 7 and 8 TeV.
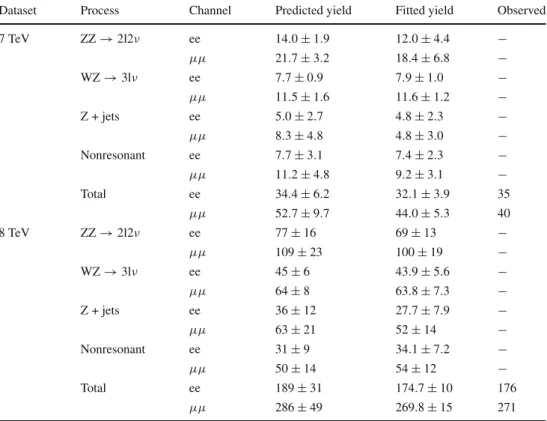
Table 2 Predicted signal and background yields at 7 and 8 TeV, and corresponding values obtained from the combined maximum likelihood fit to the ee and µµ channels. The uncertainties include both the statistical and systematic components
Dataset Process Channel Predicted yield Fitted yield Observed
7 TeV ZZ→ 2l2ν ee 14.0± 1.9 12.0± 4.4 − µµ 21.7± 3.2 18.4± 6.8 − WZ→ 3lν ee 7.7± 0.9 7.9± 1.0 − µµ 11.5± 1.6 11.6± 1.2 − Z + jets ee 5.0± 2.7 4.8± 2.3 − µµ 8.3± 4.8 4.8± 3.0 − Nonresonant ee 7.7± 3.1 7.4± 2.3 − µµ 11.2± 4.8 9.2± 3.1 − Total ee 34.4± 6.2 32.1± 3.9 35 µµ 52.7± 9.7 44.0± 5.3 40 8 TeV ZZ→ 2l2ν ee 77± 16 69± 13 − µµ 109± 23 100± 19 − WZ→ 3lν ee 45± 6 43.9± 5.6 − µµ 64± 8 63.8± 7.3 − Z + jets ee 36± 12 27.7± 7.9 − µµ 63± 21 52± 14 − Nonresonant ee 31± 9 34.1± 7.2 − µµ 50± 14 54± 12 − Total ee 189± 31 174.7± 10 176 µµ 286± 49 269.8± 15 271 6.9 Pileup
Simulated samples are reweighted to reproduce the pileup conditions observed in data. To compute the uncertainty related to this procedure, we shift the number of interac-tions by 8 % when reweighting the simulated samples. The variation of the final yields induced by this procedure is less than 1 % in ZZ and WZ processes. However, the shapes of the kinematic distributions can vary in this procedure, so the var-ied distributions are used as shape uncertainties in the cross section fit.
6.10 Drell–Yan
The uncertainty in the DY contribution is propagated from the uncertainty in the reweighted photon spectrum that is used in the estimate of DY background from data, and is dominated by the subtraction of backgrounds due to EW processes. As explained in Sect.5, the DY background estimate is assigned an uncertainty of 25 % (40 %) at 7 (8) TeV, evaluated from the relative difference between dilepton yields in data and simulation in a control region.
6.11 Top-quark and WW backgrounds
The uncertainty in the estimate of the NRB is derived from the statistical uncertainties in the scale factors in Eq. (1), and
from a closure test of the data-driven method for the mea-surement of this background performed on simulated data. It is found to be about 20 % at both 7 and 8 TeV.
7 Measurement of the ZZ production cross section We extract the ZZ production cross section using a profile likelihood fit [37] to the reduced-Emiss
T distribution, shown in Fig.2. The fit takes into account the expectations for the different background processes and the ZZ signal. Each sys-tematic uncertainty is introduced in the fit as a nuisance parameter with a log-normal prior. For the signal we con-sider a further multiplicative factor, which is the ratio of the cross section measured in data to the expected theoretical value, i.e. the signal strength µ = σ/σth. Maximizing the profile likelihood, we obtain the ZZ production cross sec-tion from the signal strength parameter, as well as optimal fits of the background yields by varying nuisance parameters within their constraints. Table2shows the expected signal and background yields, and the corresponding values after the combined fit to the ee and µµ channels. The uncertain-ties include both the statistical and systematic components.
The cross sections are extracted from individual fits to the ee and µµ channels and from a simultaneous fit to both channels. Table3reports the measured pp → ZZ → 2l2ν exclusive cross section, i.e. the production cross section of ZZ
Table 3 Cross sections (fb) for process pp → ZZ → 2l2ν (where l denotes a charged lepton of a given flavor, ν a neutrino of any flavor) at 7 and 8 TeV, with both Z boson masses in the range 60–120 GeV, measured in the ee and µµ channels and the two channels combined
Channel √s= 7 TeV √s= 8 TeV
ee 98+35−31(stat)+27−22(syst)± 2 (lumi) 83+17−16(stat)+26−19(syst)± 2 (lumi) µµ 47+24−21(stat)+20−19(syst)± 1 (lumi) 98+14−14(stat)+29−22(syst)± 3 (lumi) Combined 66+20−18(stat)+18−14(syst)± 1 (lumi) 92+11−10(stat)+25−19(syst)± 2 (lumi)
Theory 79+4−3(theo) 97+4−3(theo)
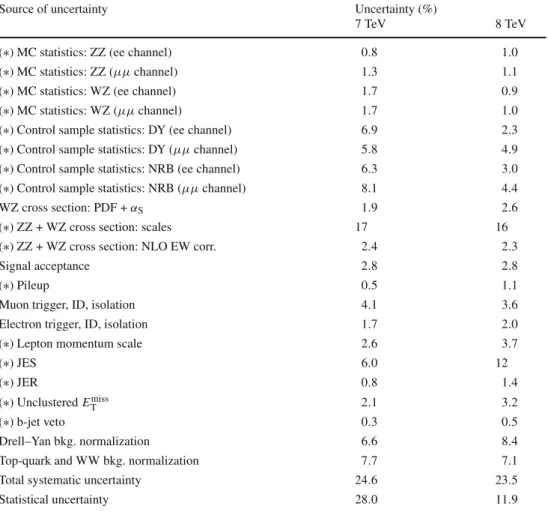
Table 4 Systematic uncertainties in the cross sections due to each source separately, after the maximum likelihood fit to extract the ZZ cross section. The uncertainties marked with an asterisk (∗) are used as shape uncertainties in the fit
Source of uncertainty Uncertainty (%)
7 TeV 8 TeV
(∗) MC statistics: ZZ (ee channel) 0.8 1.0
(∗) MC statistics: ZZ (µµ channel) 1.3 1.1
(∗) MC statistics: WZ (ee channel) 1.7 0.9
(∗) MC statistics: WZ (µµ channel) 1.7 1.0
(∗) Control sample statistics: DY (ee channel) 6.9 2.3
(∗) Control sample statistics: DY (µµ channel) 5.8 4.9
(∗) Control sample statistics: NRB (ee channel) 6.3 3.0 (∗) Control sample statistics: NRB (µµ channel) 8.1 4.4
WZ cross section: PDF + αS 1.9 2.6
(∗) ZZ + WZ cross section: scales 17 16
(∗) ZZ + WZ cross section: NLO EW corr. 2.4 2.3
Signal acceptance 2.8 2.8
(∗) Pileup 0.5 1.1
Muon trigger, ID, isolation 4.1 3.6
Electron trigger, ID, isolation 1.7 2.0
(∗) Lepton momentum scale 2.6 3.7
(∗) JES 6.0 12 (∗) JER 0.8 1.4 (∗) Unclustered Emiss T 2.1 3.2 (∗) b-jet veto 0.3 0.5 Drell–Yan bkg. normalization 6.6 8.4
Top-quark and WW bkg. normalization 7.7 7.1
Total systematic uncertainty 24.6 23.5
Statistical uncertainty 28.0 11.9
pairs with mass 60 < MZ<120 GeV, with no restrictions on lepton acceptance nor jet number, times the branching frac-tion to final states with two charged leptons of a given flavor and two neutrinos of any flavor. This is obtained by rescaling the theoretical prediction for the exclusive cross section in the same kinematic range by the fitted signal strength. These theoretical predictions are computed at NLO in QCD with mcfm and corrected for NLO EW effects: 79+4−3(97+4−3) fb at 7 (8) TeV.
The measured inclusive ZZ cross section is obtained by rescaling the theoretical inclusive cross section computed in the zero-width approximation [3] and corrected for NLO EW
effects [7] (see Sect.1), by the same fitted signal strength. This procedure properly accounts for the contribution of vir-tual photon decays to the charged-lepton pair production, and yields a measured cross section that can be compared directly with theoretical calculations of inclusive pure ZZ production in the zero-width approximation. The results are:
7 TeV:
σ (pp→ ZZ)=5.1+1.5−1.4(stat)+1.4−1.1(syst)± 0.1 (lumi) pb, 8 TeV:
This is the first cross section measurement in the 2l2ν channel at 8 TeV. The measurements are less than one stan-dard deviation from the SM predictions at both 7 and 8 TeV. The uncertainties are approximately twice as large as those from the CMS measurement in the 4ℓ channel [10,11], and the channels agree within uncertainties.
The p-values of the simultaneous fit to the ee and µµ chan-nels are 0.335 (0.569) at 7 (8) TeV. The data are also consis-tent with the reduced Emiss
T spectra uncorrected for NLO EW effects, but with slightly smaller p-values of 0.322 (0.477) at 7 (8) TeV. The application of EW corrections thus improves the modeling of the diboson processes and leads to a better agreement between the simulated and observed spectra.
Table4 shows a summary of the sources of systematic uncertainty described in Sect.6, with the corresponding con-tributions to the total systematic uncertainty in the cross sec-tions.
8 Anomalous couplings
The existence of neutral trilinear gauge couplings is forbid-den at the tree level, but allowed in some extensions of the SM [38]. The ZZ production process provides a way to probe the existence of such anomalous couplings at the ZZZ and γZZ vertices.
Neutral couplings V(∗)ZZ (V = Z, γ ) can be described using the following effective Lagrangian [39]:
LVZZ= − e MZ2 # [ fγ 4(∂µFµα)+ f4Z(∂µZµα)]Zβ(∂βZα) −[ fγ 5(∂µFµα)+ f5Z(∂µZµα)] ˜ZαβZβ $ , (3)
where Z represents the Z boson and Fµαrepresents the elec-tromagnetic field tensor. The coefficients fγ
i and fiZ
cor-respond to couplings γ(∗)ZZ and Z(∗)ZZ, respectively. All the operators in Eq. (3) are Lorentz-invariant and U(1)EM gauge-invariant, but not invariant under SU(2)L× U(1)Y gauge symmetry. The terms corresponding to fV
4 parame-ters violate the CP symmetry, while the terms corresponding to fV
5 parameters conserve CP.
To avoid unitarity violation at energies above the scale (.) of new physics, the Lagrangian of Eq. (3) can be modified with form factors of the type 1/%1+ ˆs/.&n, where√ˆs is the effective center-of-mass energy of the collision. No form-factor scaling is used in this analysis. This allows to provide results without any bias that can arise due to a particular choice of the form-factor energy dependence.
Previous studies of neutral anomalous triple gauge cou-plings were performed at LEP2 [40], Tevatron [41], and LHC [9–11]. No deviation from the SM expectation has been observed so far, and the best limits were set by the LHC
< Events / GeV > -5 10 -4 10 -3 10 -2 10 -1 10 1 10 2 10 ZZ→ 2l2ν Z→ 2l (Data)
Top, WW, W+jets (Data) WZ→ 3lν
=0.005 Z 4 f ν 2l2 → ZZ Z=0.01 4 f ν 2l2 → ZZ =0.02 Z 4 f ν 2l2 → ZZ Data (7 TeV) -1 5.1 fb CMS [GeV] T Dilepton p 50 60 100 200 300 400 1000 obs/pred 0 1 2 < Events / GeV > -3 10 -2 10 -1 10 1 10 2 10 3 10 ZZ→ 2l2ν Z→ 2l (Data)
Top, WW, W+jets (Data) WZ→ 3lν
=0.002 Z 4 f ν 2l2 → ZZ Z=0.005 4 f ν 2l2 → ZZ =0.01 Z 4 f ν 2l2 → ZZ Z=0.02 4 f ν 2l2 → ZZ Data (8 TeV) -1 19.6 fb CMS [GeV] T Dilepton p 50 60 100 200 300 400 1000 obs/pred 0 1 2
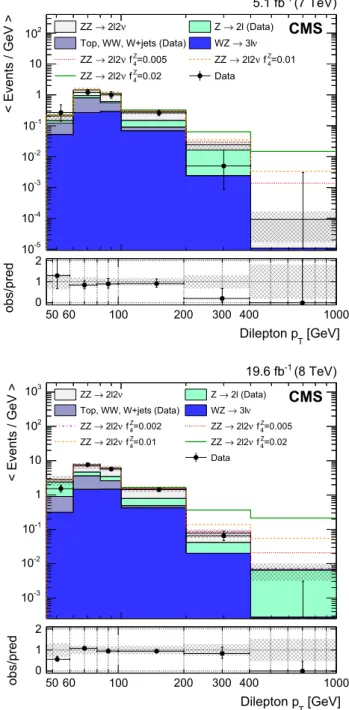
Fig. 3 Dilepton (l = e, µ) transverse momentum distributions at 7 TeV (top) and 8 TeV (bottom). The DY and WW, W+ jets, and top backgrounds are estimated from control samples in data. The gray error bandincludes statistical and systematic uncertainties in the pre-dicted yields. In the bottom plots, vertical error bars and bands are relative to the total predicted yields. In all plots, horizontal error bars indicate the bin width
measurements based on integrated luminosities of about 5 (19.6) fb−1at 7 (8) TeV.
8.1 Limits from the ZZ→ 2l2ν channel
In the following, we extract limits on the neutral triple gauge couplings V(∗)ZZ with the same datasets at 7 and 8 TeV as
Table 5 Summary of 95 % CL intervals for the neutral ATGC coefficients, set by the 2l2ν final states using the 7 and 8 TeV CMS datasets. The expected 95 % CL intervals obtained using the 7 and 8 TeV simulated samples are also shown. No form factor is used
Dataset fZ
4 f4γ f5Z f5γ
7 TeV [−0.010; 0.011] [−0.012; 0.013] [−0.010; 0.010] [−0.013; 0.013]
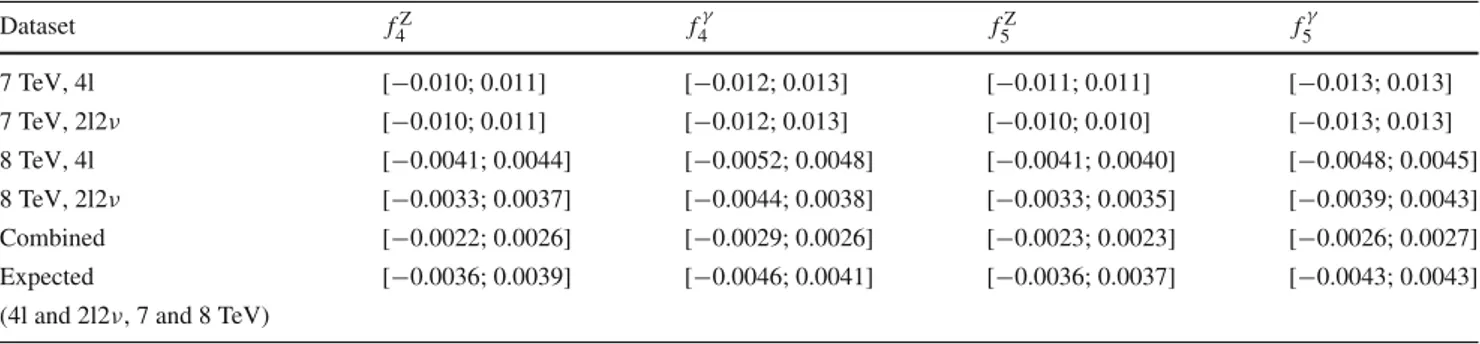
8 TeV [−0.0033; 0.0037] [−0.0044; 0.0038] [−0.0033; 0.0035] [−0.0039; 0.0043] Combined [−0.0028; 0.0032] [−0.0037; 0.0033] [−0.0029; 0.0031] [−0.0033; 0.0037] Expected (7 and 8 TeV) [−0.0048; 0.0051] [−0.0060; 0.0053] [−0.0048; 0.0050] [−0.0057; 0.0062] Table 6 Summary of 95 % CL intervals for the neutral ATGC
coef-ficients, set by the combined analysis of 4l and 2l2ν final states. The intervals obtained separately by the two analyses using the 7 and 8 TeV
CMS data sets are shown, as well as their combination. The expected 95 % CL intervals obtained using the 7 and 8 TeV simulated samples of both analyses are also shown. No form factor is used
Dataset f4Z fγ 4 f5Z f5γ 7 TeV, 4l [−0.010; 0.011] [−0.012; 0.013] [−0.011; 0.011] [−0.013; 0.013] 7 TeV, 2l2ν [−0.010; 0.011] [−0.012; 0.013] [−0.010; 0.010] [−0.013; 0.013] 8 TeV, 4l [−0.0041; 0.0044] [−0.0052; 0.0048] [−0.0041; 0.0040] [−0.0048; 0.0045] 8 TeV, 2l2ν [−0.0033; 0.0037] [−0.0044; 0.0038] [−0.0033; 0.0035] [−0.0039; 0.0043] Combined [−0.0022; 0.0026] [−0.0029; 0.0026] [−0.0023; 0.0023] [−0.0026; 0.0027] Expected [−0.0036; 0.0039] [−0.0046; 0.0041] [−0.0036; 0.0037] [−0.0043; 0.0043] (4l and 2l2ν, 7 and 8 TeV)
used for the ZZ cross section measurement described in the previous section. Limits on the four fV
i parameters are set
by comparing the data with theoretical predictions.
Figure3shows the charged dilepton pTdistribution after the full selection described in Table1, in data and simulation, including sherpa samples with different values of the fZ 4 parameter. The contribution from the anomalous couplings enhances the high- pTregion of the distribution. The charged dilepton pTis thus a good observable to probe for the pres-ence of ATGCs. The DY and nonresonant backgrounds are estimated from data as described above. The SM ZZ process is simulated here using the MadGraph sample described in Sect.2, with NLO QCD corrections computed with mcfm and NLO EW corrections from Ref. [7]. The contribution of the ATGCs is obtained from the sherpa samples men-tioned above, by subtracting the SM sherpa contribution to the charged dilepton pT, and is summed to the MadGraph ZZ distribution. The interference of the ATGC signal and the SM ZZ production is included, except for pT(Z) < 200 GeV, which has a negligible impact on the limits. The expected sig-nal yields in each pTbin are interpolated between different values of the ATGC coupling parameters using a second-degree polynomial, since the signal cross section depends quadratically on such parameters.
The limits are calculated with a profile likelihood method. We set one-dimensional limits on the four parameters, i.e. varying independently a single parameter at a time, while fixing the other three to zero. The 95 % CL one-dimensional limits on the four parameters are reported in Table5for 7 TeV, 8 TeV, and combined datasets. The observed exclusion limits are about one standard deviation tighter than the expected
ones, which is attributed primarily to the observed deficit of events in the highest bin of dilepton pT. The limits set are of comparable sensitivity to those previously obtained by CMS in the 4l channel [10,11].
8.2 Combined limits from the ZZ→ 4l and → 2l2ν channels
We proceed with the combination of the results of the pre-viously published ZZ → 4l analyses [10,11] with the present results. In doing this, the published analysis of the 4l (l = e, µ) channel is unchanged, except that NLO EW corrections to the SM ZZ → 4l background are included in the same way as in the present analysis. We use a profile likelihood method to calculate the 95 % CL one-dimensional intervals for the four parameters, combining the data in the 4l and 2l2ν channels, at 7 and 8 TeV. The systematic uncer-tainties in the signal and diboson background cross sections, in the integrated luminosity, and in the lepton efficiencies are treated as fully correlated between the two channels. Table6 shows the intervals obtained by combining the four separate data sets. The combined analysis improves the sensitivity of the two separate channels, and the limits are more stringent than all the results published to date.
9 Summary
We have measured the ZZ production cross section in the 2l2ν channel in proton–proton collisions at center-of-mass energies of 7 and 8 TeV. The data samples selected for
the study correspond to an integrated luminosity of 5.1 (19.6) fb−1at 7 (8) TeV. We have measured
σ (pp→ ZZ) = 5.1+1.5−1.4(stat)+1.4−1.1(syst)± 0.1 (lumi) pb at 7 TeV, and
σ (pp→ ZZ) = 7.2+0.8−0.8(stat)+1.9−1.5(syst)± 0.2 (lumi) pb at 8 TeV, in agreement with theory calculations, 6.2+0.3−0.2pb (7.6+0.4−0.3pb) at 7 (8) TeV, which include NLO QCD correc-tions [3] and NLO EW corrections [7,8]. The selected data have also been analyzed to search for ATGCs involving the ZZ final state. In the absence of any observation of new physics, we have set the most stringent limits to date on the relevant ATGC parameters. In addition, by combining the selected data with the CMS data for the four-charged-lepton final state we have set even tighter constraints.
Acknowledgments We wish to thank our theoretician colleague Tobias Kasprzik for providing the numerical calculations of the next-to-leading-order electroweak corrections to the ZZ and WZ processes. We congratulate our colleagues in the CERN accelerator departments for the excellent performance of the LHC and thank the technical and adminis-trative staffs at CERN and at other CMS institutes for their contributions to the success of the CMS effort. In addition, we gratefully acknowledge the computing centers and personnel of the Worldwide LHC Computing Grid for delivering so effectively the computing infrastructure essential to our analyses. Finally, we acknowledge the enduring support for the construction and operation of the LHC and the CMS detector provided by the following funding agencies: the Austrian Federal Ministry of Sci-ence, Research and Economy and the Austrian Science Fund; the Bel-gian Fonds de la Recherche Scientifique, and Fonds voor Wetenschap-pelijk Onderzoek; the Brazilian Funding Agencies (CNPq, CAPES, FAPERJ, and FAPESP); the Bulgarian Ministry of Education and Sci-ence; CERN; the Chinese Academy of Sciences, Ministry of Science and Technology, and National Natural Science Foundation of China; the Colombian Funding Agency (COLCIENCIAS); the Croatian Ministry of Science, Education and Sport, and the Croatian Science Foundation; the Research Promotion Foundation, Cyprus; the Ministry of Education and Research, Estonian Research Council via 4 and IUT23-6 and European Regional Development Fund, Estonia; the Academy of Finland, Finnish Ministry of Education and Culture, and Helsinki Institute of Physics; the Institut National de Physique Nucléaire et de Physique des Particules/CNRS, and Commissariat à l’Énergie Atom-ique et aux Énergies Alternatives/CEA, France; the Bundesministerium für Bildung und Forschung, Deutsche Forschungsgemeinschaft, and Helmholtz-Gemeinschaft Deutscher Forschungszentren, Germany; the General Secretariat for Research and Technology, Greece; the National Scientific Research Foundation, and National Innovation Office, Hun-gary; the Department of Atomic Energy and the Department of Science and Technology, India; the Institute for Studies in Theoretical Physics and Mathematics, Iran; the Science Foundation, Ireland; the Istituto Nazionale di Fisica Nucleare, Italy; the Ministry of Science, ICT and Future Planning, and National Research Foundation (NRF), Republic of Korea; the Lithuanian Academy of Sciences; the Ministry of Educa-tion, and University of Malaya (Malaysia); the Mexican Funding Agen-cies (CINVESTAV, CONACYT, SEP, and UASLP-FAI); the Ministry of Business, Innovation and Employment, New Zealand; the Pakistan Atomic Energy Commission; the Ministry of Science and Higher Edu-cation and the National Science Centre, Poland; the Fundação para a Ciência e a Tecnologia, Portugal; JINR, Dubna; the Ministry of Edu-cation and Science of the Russian Federation, the Federal Agency of
Atomic Energy of the Russian Federation, Russian Academy of Sci-ences, and the Russian Foundation for Basic Research; the Ministry of Education, Science and Technological Development of Serbia; the Secretaría de Estado de Investigación, Desarrollo e Innovación and Pro-grama Consolider-Ingenio 2010, Spain; the Swiss Funding Agencies (ETH Board, ETH Zurich, PSI, SNF, UniZH, Canton Zurich, and SER); the Ministry of Science and Technology, Taipei; the Thailand Center of Excellence in Physics, the Institute for the Promotion of Teaching Science and Technology of Thailand, Special Task Force for Activat-ing Research and the National Science and Technology Development Agency of Thailand; the Scientific and Technical Research Council of Turkey, and Turkish Atomic Energy Authority; the National Academy of Sciences of Ukraine, and State Fund for Fundamental Researches, Ukraine; the Science and Technology Facilities Council, UK; the US Department of Energy, and the US National Science Foundation. Indi-viduals have received support from the Marie-Curie program and the European Research Council and EPLANET (European Union); the Lev-entis Foundation; the A. P. Sloan Foundation; the Alexander von Hum-boldt Foundation; the Belgian Federal Science Policy Office; the Fonds pour la Formation à la Recherche dans l’Industrie et dans l’Agriculture (FRIA-Belgium); the Agentschap voor Innovatie door Wetenschap en Technologie (IWT-Belgium); the Ministry of Education, Youth and Sports (MEYS) of the Czech Republic; the Council of Science and Industrial Research, India; the HOMING PLUS program of Foundation for Polish Science, cofinanced from European Union, Regional Devel-opment Fund; the Compagnia di San Paolo (Torino); the Consorzio per la Fisica (Trieste); MIUR Project 20108T4XTM (Italy); the Thalis and Aristeia programs cofinanced by EU-ESF and the Greek NSRF; and the National Priorities Research Program by Qatar National Research Fund.
Open Access This article is distributed under the terms of the Creative Commons Attribution 4.0 International License (http://creativecomm
ons.org/licenses/by/4.0/), which permits unrestricted use, distribution,
and reproduction in any medium, provided you give appropriate credit to the original author(s) and the source, provide a link to the Creative Commons license, and indicate if changes were made.
Funded by SCOAP3.
References
1. CMS Collaboration, Search for the standard model Higgs boson in the H → Z Z → 2ℓ2ν channel in pp collisions at√s= 7 TeV. JHEP 03, 040 (2012). doi:10.1007/JHEP03(2012)040
2. J.D. Hobbs, M.S. Neubauer, S. Willenbrock, Tests of the standard electroweak model at the energy frontier. Rev. Mod. Phys. (2010).
doi:10.1103/RevModPhys.84.1477.arXiv:1003.5733
3. J.M. Campbell, R.K. Ellis, C. Williams, Vector boson pair production at the LHC. JHEP 07, 018 (2011). doi:10.1007/
JHEP07(2011)018.arXiv:1105.0020
4. F. Cascioli et al., ZZ production at hadron colliders in NNLO QCD. Phys. Lett. B 735, 311 (2014). doi:10.1016/j.physletb.2014.06.056. arXiv:1405.2219
5. L.J. Dixon, Z. Kunszt, A. Signer, Vector boson pair production in hadronic collisions at order αS: lepton correlations and
anoma-lous couplings. Phys. Rev. D 60, 114037 (1999). doi:10.1103/
PhysRevD.60.114037.arXiv:hep-ph/9907305
6. T. Binoth et al., NLO QCD corrections to ZZ+jet production at hadron colliders. Phys. Lett. B 683, 154 (2010). doi:10.1016/j.
physletb.2009.12.013.arXiv:0911.3181
7. A. Bierweiler, T. Kasprzik, J.H. Kuhn, Vector-boson pair produc-tion at the LHC to (α3)accuracy. JHEP 12, 071 (2013). doi:10.
8. J. Baglio, L.D. Ninh, M.M. Weber, Massive gauge boson pair production at the LHC: a next-to-leading order story. Phys. Rev. D 88, 113005 (2013). doi:10.1103/PhysRevD.88.113005. arXiv:1307.4331
9. ATLAS Collaboration, Measurement of ZZ production in pp col-lisions at √s = 7 TeV and limits on anomalous ZZZ and Z Zγ
with the ATLAS detector. JHEP 03, 128 (2012). doi:10.1007/
JHEP03(2013)128.arXiv:1211.6096
10. CMS Collaboration, Measurement of the ZZ production cross sec-tion and search for anomalous couplings in 2ℓ2ℓ′final states in
pp collisions at √s= 7 TeV. JHEP 01, 063 (2013). doi:10.1007/
JHEP01(2013)063.arXiv:1211.4890
11. CMS Collaboration, Measurement of the pp to ZZ production cross section and constraints on anomalous triple gauge couplings in four-lepton final states at √s = 8 TeV. Phys. Lett. B 740, 250 (2015). doi:10.1016/j.physletb.2014.11.059.arXiv:1406.0113 12. CMS Collaboration, The CMS experiment at the CERN LHC.
JINST 3, S08004 (2008). doi:10.1088/1748-0221/3/08/S08004 13. J. Alwall et al., MadGraph 5: going beyond. JHEP 06, 128 (2011).
doi:10.1007/JHEP06(2011)128.arXiv:1106.0522
14. S. Alioli, P. Nason, C. Oleari, E. Re, A general framework for implementing NLO calculations in shower Monte Carlo pro-grams: the POWHEG BOX. JHEP 06, 043 (2010). doi:10.1007/
JHEP06(2010)043.arXiv:1002.2581
15. T. Sjöstrand, S. Mrenna, P. Skands, PYTHIA 6.4 physics and man-ual. JHEP 05, 026 (2006). doi:10.1088/1126-6708/2006/05/026. arXiv:hep-ph/0603175
16. R. Field, Early LHC underlying event data – findings and surprises. In 22nd Hadron Collider Physics Symposium (HCP 2010), ed. by W. Trischuk (Toronto, 2010).arXiv:1010.3558
17. T. Gleisberg et al., Event generation with SHERPA 1.1. JHEP 02, 007 (2009). doi:10.1088/1126-6708/2009/02/007. arXiv:0811.4622
18. H.-L. Lai et al., Uncertainty induced by QCD coupling in the CTEQ global analysis of parton distributions. Phys. Rev. D 82, 054021 (2010). doi:10.1103/PhysRevD.82.054021.arXiv:1004.4624 19. H.-L. Lai et al., New parton distributions for collider physics. Phys.
Rev. D 82, 074024 (2010). doi:10.1103/PhysRevD.82.074024. arXiv:1007.2241
20. GEANT4 Collaboration, GEANT4 – a simulation toolkit. Nucl. Instrum. Methods A 506, 250 (2003). doi:10.1016/ S0168-9002(03)01368-8
21. CMS Collaboration, Performance of electron reconstruction and selection with the CMS detector in proton–proton collisions at √s= 8 TeV. JINST 10, P06005 (2015). doi:10.1088/1748-0221/
10/06/P06005.arXiv:1502.02701
22. CMS Collaboration, Performance of CMS muon reconstruction in pp collision events at √s= 7 TeV. JINST 7, P10002 (2012). doi:10.
1088/1748-0221/7/10/P10002.arXiv:1206.4071
23. M. Cacciari, G.P. Salam, G. Soyez, The anti-ktjet clustering
algo-rithm. JHEP 04, 063 (2008). doi:10.1088/1126-6708/2008/04/063. arXiv:0802.1189
24. G.J. Gounaris, J. Layssac, F.M. Renard, Determination of jet energy calibration and transverse momentum resolution in CMS. JINST 6, 11002 (2011). doi:10.1088/1748-0221/6/11/P11002. arXiv:1107.4277
25. CMS Collaboration, Identification of b-quark jets with the CMS experiment. JINST 8, P04013 (2013). doi:10.1088/1748-0221/8/
04/P04013.arXiv:1211.4462
26. D0 Collaboration, ZZ√ → ℓ+ℓ−ν¯ν production in pp collisions at s = 1.96 TeV. Phys. Rev. D 78, 072002 (2008). doi:10.1103/
PhysRevD.78.072002.arXiv:0808.0269
27. DO Collaboration, Measurement of the WZ and ZZ production cross sections using leptonic final states in 8.6 fb−1 of p¯p
colli-sions. Phys. Rev. D 85, 112005 (2012). doi:10.1103/PhysRevD.85.
112005.arXiv:1201.5652
28. OPAL Collaboration, Search for anomalous production of dilepton events with missing transverse momentum in e+e−collisions at
√s = 161 GeV and 172 GeV. Eur. Phys. J. C 4, 047 (1998).
doi:10.1007/PL00021655.arXiv:hep-ex/9710010
29. CMS Collaboration, Rapidity distributions in exclusive Z + jet and γ + jet events in pp collisions at √s = 7 TeV. Phys. Rev. D 88, 112009 (2013). doi:10.1103/PhysRevD.88.112009
30. M.R. Whalley, D. Bourilkov, R.C. Group, The Les Houches accord PDFs (LHAPDF) and LHAGLUE (2005).arXiv:hep-ph/0508110 31. M. Botje et al., The PDF4LHC working group interim
recommen-dations (2011).arXiv:1101.0538
32. I.W. Stewart, F.J. Tackmann, Theory uncertainties for Higgs and other searches using jet bins. Phys. Rev. D 85, 034011 (2012).
doi:10.1103/PhysRevD.85.034011.arXiv:1107.2117
33. ATLAS and CMS Collaborations, Procedure for the LHC Higgs boson search combination in Summer 2011. CMS NOTE/ATL-PHYS-PUB CMS NOTE-2011/005; ATL-NOTE/ATL-PHYS-PUB-2011-11 (2012)
34. CMS Collaboration, CMS luminosity based on pixel cluster count-ing – summer 2013 update. Technical Report CMS-PAS-LUM-13-001 (CERN, Geneva, 2013)
35. CMS Collaboration, Measurements of inclusive W and Z cross sections in pp collisions at √s = 7 TeV. JHEP 01, 080 (2011).
doi:10.1007/JHEP01(2011)080
36. CMS collaboration, Results on b-tagging identification in 8 TeV pp collisions. DPS CMS-DP-2013-005 (2013)
37. Particle Data Group, K.A. Olive et al., Review of particle physics. Chin. Phys. C 38, 090001 (2014). doi:10.1088/1674-1137/38/9/ 090001
38. G.J. Gounaris, J. Layssac, F.M. Renard, New and standard physics contributions to anomalous Z and γ self-couplings. Phys. Rev. D 62, 073013 (2000). doi:10.1103/PhysRevD.62.073013. arXiv:hep-ph/0003143
39. K. Hagiwara, R.D. Peccei, D. Zeppenfeld, K. Hikasa, Probing the weak boson sector in e+e−→ W+W−. Nucl. Phys. B 282, 253
(1987). doi:10.1016/0550-3213(87)90685-7
40. ALEPH Collaboration, DELPHI Collaboration, L3 Collaboration, OPAL Collaboration, and the LEP Electroweak Working Group, A combination of preliminary electroweak measurements and con-straints on the standard model (2006).arXiv:hep-ex/0612034 41. D0 Collaboration, Search for Z Z and Z∗
γ production in p¯p
col-lisions at √s = 1.96 TeV and limits on anomalous ZZZ and Z Z∗
γcouplings. Phys. Rev. Lett. 100, 131801 (2008). doi:10.1103/
CMS Collaboration
Yerevan Physics Institute, Yerevan, Armenia V. Khachatryan, A. M. Sirunyan, A. Tumasyan
Institut für Hochenergiephysik der OeAW, Vienna, Austria
W. Adam, T. Bergauer, M. Dragicevic, J. Erö, M. Friedl, R. Frühwirth1, V. M. Ghete, C. Hartl, N. Hörmann, J. Hrubec, M. Jeitler1, W. Kiesenhofer, V. Knünz, M. Krammer1, I. Krätschmer, D. Liko, I. Mikulec, D. Rabady2, B. Rahbaran, H. Rohringer, R. Schöfbeck, J. Strauss, W. Treberer-Treberspurg, W. Waltenberger, C.-E. Wulz1
National Centre for Particle and High Energy Physics, Minsk, Belarus V. Mossolov, N. Shumeiko, J. Suarez Gonzalez
Universiteit Antwerpen, Antwerpen, Belgium
S. Alderweireldt, S. Bansal, T. Cornelis, E. A. De Wolf, X. Janssen, A. Knutsson, J. Lauwers, S. Luyckx, S. Ochesanu, R. Rougny, M. Van De Klundert, H. Van Haevermaet, P. Van Mechelen, N. Van Remortel, A. Van Spilbeeck
Vrije Universiteit Brussel, Brussels, Belgium
F. Blekman, S. Blyweert, J. D’Hondt, N. Daci, N. Heracleous, J. Keaveney, S. Lowette, M. Maes, A. Olbrechts, Q. Python, D. Strom, S. Tavernier, W. Van Doninck, P. Van Mulders, G. P. Van Onsem, I. Villella
Université Libre de Bruxelles, Brussels, Belgium
C. Caillol, B. Clerbaux, G. De Lentdecker, D. Dobur, L. Favart, A. P. R. Gay, A. Grebenyuk, A. Léonard, A. Mohammadi, L. Perniè2, A. Randle-conde, T. Reis, T. Seva, L. Thomas, C. Vander Velde, P. Vanlaer, J. Wang, F. Zenoni
Ghent University, Ghent, Belgium
V. Adler, K. Beernaert, L. Benucci, A. Cimmino, S. Costantini, S. Crucy, S. Dildick, A. Fagot, G. Garcia, J. Mccartin, A. A. Ocampo Rios, D. Ryckbosch, S. Salva Diblen, M. Sigamani, N. Strobbe, F. Thyssen, M. Tytgat, E. Yazgan, N. Zaganidis
Université Catholique de Louvain, Louvain-la-Neuve, Belgium
S. Basegmez, C. Beluffi3, G. Bruno, R. Castello, A. Caudron, L. Ceard, G. G. Da Silveira, C. Delaere, T. du Pree, D. Favart, L. Forthomme, A. Giammanco4, J. Hollar, A. Jafari, P. Jez, M. Komm, V. Lemaitre, C. Nuttens, D. Pagano, L. Perrini, A. Pin, K. Piotrzkowski, A. Popov5, L. Quertenmont, M. Selvaggi, M. Vidal Marono, J. M. Vizan Garcia Université de Mons, Mons, Belgium
N. Beliy, T. Caebergs, E. Daubie, G. H. Hammad
Centro Brasileiro de Pesquisas Fisicas, Rio de Janeiro, Brazil
W. L. Aldá Júnior, G. A. Alves, L. Brito, M. Correa Martins Junior, T. Dos Reis Martins, C. Mora Herrera, M. E. Pol, P. Rebello Teles
Universidade do Estado do Rio de Janeiro, Rio de Janeiro, Brazil
W. Carvalho, J. Chinellato6, A. Custódio, E. M. Da Costa, D. De Jesus Damiao, C. De Oliveira Martins,
S. Fonseca De Souza, H. Malbouisson, D. Matos Figueiredo, L. Mundim, H. Nogima, W. L. Prado Da Silva, J. Santaolalla, A. Santoro, A. Sznajder, E. J. Tonelli Manganote6, A. Vilela Pereira
Universidade Estadual Paulistaa, Universidade Federal do ABCb, São Paulo, Brazil
C. A. Bernardesb, S. Dograa, T. R. Fernandez Perez Tomeia, E. M. Gregoresb, P. G. Mercadanteb, S. F. Novaesa,
Sandra S. Padulaa
Institute for Nuclear Research and Nuclear Energy, Sofia, Bulgaria
A. Aleksandrov, V. Genchev2, R. Hadjiiska, P. Iaydjiev, A. Marinov, S. Piperov, M. Rodozov, G. Sultanov, M. Vutova University of Sofia, Sofia, Bulgaria
A. Dimitrov, I. Glushkov, L. Litov, B. Pavlov, P. Petkov Institute of High Energy Physics, Beijing, China
State Key Laboratory of Nuclear Physics and Technology, Peking University, Beijing, China C. Asawatangtrakuldee, Y. Ban, Q. Li, S. Liu, Y. Mao, S. J. Qian, D. Wang, Z. Xu, W. Zou Universidad de Los Andes, Bogotá, Colombia
C. Avila, A. Cabrera, L. F. Chaparro Sierra, C. Florez, J. P. Gomez, B. Gomez Moreno, J. C. Sanabria
Faculty of Electrical Engineering, Mechanical Engineering and Naval Architecture, University of Split, Split, Croatia N. Godinovic, D. Lelas, D. Polic, I. Puljak
Faculty of Science, University of Split, Split, Croatia Z. Antunovic, M. Kovac
Institute Rudjer Boskovic, Zagreb, Croatia
V. Brigljevic, K. Kadija, J. Luetic, D. Mekterovic, L. Sudic University of Cyprus, Nicosia, Cyprus
A. Attikis, G. Mavromanolakis, J. Mousa, C. Nicolaou, F. Ptochos, P. A. Razis Charles University, Prague, Czech Republic
M. Bodlak, M. Finger, M. Finger Jr.8
Academy of Scientific Research and Technology of the Arab Republic of Egypt, Egyptian Network of High Energy Physics, Cairo, Egypt
Y. Assran9, A. Ellithi Kamel10, M. A. Mahmoud11, A. Radi12,13
National Institute of Chemical Physics and Biophysics, Tallinn, Estonia M. Kadastik, M. Murumaa, M. Raidal, A. Tiko
Department of Physics, University of Helsinki, Helsinki, Finland P. Eerola, G. Fedi, M. Voutilainen
Helsinki Institute of Physics, Helsinki, Finland
J. Härkönen, V. Karimäki, R. Kinnunen, M. J. Kortelainen, T. Lampén, K. Lassila-Perini, S. Lehti, T. Lindén, P. Luukka, T. Mäenpää, T. Peltola, E. Tuominen, J. Tuominiemi, E. Tuovinen, L. Wendland
Lappeenranta University of Technology, Lappeenranta, Finland J. Talvitie, T. Tuuva
DSM/IRFU, CEA/Saclay, Gif-sur-Yvette, France
M. Besancon, F. Couderc, M. Dejardin, D. Denegri, B. Fabbro, J. L. Faure, C. Favaro, F. Ferri, S. Ganjour, A. Givernaud, P. Gras, G. Hamel de Monchenault, P. Jarry, E. Locci, J. Malcles, J. Rander, A. Rosowsky, M. Titov
Laboratoire Leprince-Ringuet, Ecole Polytechnique, IN2P3-CNRS, Palaiseau, France
S. Baffioni, F. Beaudette, P. Busson, C. Charlot, T. Dahms, M. Dalchenko, L. Dobrzynski, N. Filipovic, A. Florent, R. Granier de Cassagnac, L. Mastrolorenzo, P. Miné, C. Mironov, I. N. Naranjo, M. Nguyen, C. Ochando, G. Ortona, P. Paganini, S. Regnard, R. Salerno, J. B. Sauvan, Y. Sirois, C. Veelken, Y. Yilmaz, A. Zabi
Institut Pluridisciplinaire Hubert Curien, Université de Strasbourg, Université de Haute Alsace Mulhouse, CNRS/IN2P3, Strasbourg, France
J.-L. Agram14, J. Andrea, A. Aubin, D. Bloch, J.-M. Brom, E. C. Chabert, C. Collard, E. Conte14, J.-C. Fontaine14, D. Gelé, U. Goerlach, C. Goetzmann, A.-C. Le Bihan, K. Skovpen, P. Van Hove
Centre de Calcul de l’Institut National de Physique Nucleaire et de Physique des Particules, CNRS/IN2P3, Villeurbanne, France
S. Gadrat
Institut de Physique Nucléaire de Lyon, Université de Lyon, Université Claude Bernard Lyon 1, CNRS-IN2P3, Villeurbanne, France
S. Beauceron, N. Beaupere, C. Bernet7, G. Boudoul2, E. Bouvier, S. Brochet, C. A. Carrillo Montoya, J. Chasserat, R. Chierici, D. Contardo2, P. Depasse, H. El Mamouni, J. Fan, J. Fay, S. Gascon, M. Gouzevitch, B. Ille,T. Kurca,