R E S E A R C H A R T I C L E
Open Access
Surviving in a toxic world: transcriptomics and
gene expression profiling in response to
environmental pollution in the critically
endangered European eel
Jose Martin Pujolar
1*†, Ilaria AM Marino
1†, Massimo Milan
2, Alessandro Coppe
1, Gregory E Maes
3,
Fabrizio Capoccioni
4, Eleonora Ciccotti
4, Lieven Bervoets
5, Adrian Covaci
5,6, Claude Belpaire
7, Gordon Cramb
8,
Tomaso Patarnello
2, Luca Bargelloni
2, Stefania Bortoluzzi
1and Lorenzo Zane
1Abstract
Background: Genomic and transcriptomic approaches have the potential for unveiling the genome-wide response to environmental perturbations. The abundance of the catadromous European eel (Anguilla anguilla) stock has been declining since the 1980s probably due to a combination of anthropogenic and climatic factors. In this paper, we explore the transcriptomic dynamics between individuals from high (river Tiber, Italy) and low pollution (lake Bolsena, Italy) environments, which were measured for 36 PCBs, several organochlorine pesticides and brominated flame retardants and nine metals.
Results: To this end, we first (i) updated the European eel transcriptome using deep sequencing data with a total of 640,040 reads assembled into 44,896 contigs (Eeelbase release 2.0), and (ii) developed a transcriptomic platform for global gene expression profiling in the critically endangered European eel of about 15,000 annotated contigs, which was applied to detect differentially expressed genes between polluted sites. Several detoxification genes related to metabolism of pollutants were upregulated in the highly polluted site, including genes that take part in phase I of the xenobiotic metabolism (CYP3A), phase II (glutathione-S-transferase) and oxidative stress (glutathione peroxidase). In addition, key genes in the mitochondrial respiratory chain and oxidative phosphorylation were down-regulated at the Tiber site relative to the Bolsena site.
Conclusions: Together with the induced high expression of detoxification genes, the suggested lowered expression of genes supposedly involved in metabolism suggests that pollution may also be associated with decreased respiratory and energy production.
Keywords: Anguilla anguilla, European eel, Transcriptome, Microarrays, Pollution Background
The incorporation of genomic and transcriptomic approaches into ecological and evolutionary studies enables to further explore how natural populations re-spond to environmental change and anthropogenic pressures [1-4]. Genome-scale approaches have the po-tential for identifying genes and genetic networks that underlie ecologically important traits, such as those
linked to adaptation to cold temperatures [5], defense mechanisms [6] or response to pollutants [7,8]. Changes in gene expression can be linked to phenotypic and en-vironmental variation, hence advancing our understand-ing of the adaptive importance of gene functions and their ecological and evolutionary consequences [9]. The resilience of a species depends on its vulnerability in the face of environmental changes, which is determined by genetic composition and physiological tolerance [10]. Changes in environmental conditions can rapidly lead to phenotypic change, involving either genetic (local adaptation) or plastic (physiological plasticity) changes. * Correspondence:[email protected]
†Equal contributors
1Department of Biology, University of Padova, I-35131 Padova, Italy
Full list of author information is available at the end of the article
© 2012 Pujolar et al.; licensee BioMed Central Ltd. This is an Open Access article distributed under the terms of the Creative Commons Attribution License (http://creativecommons.org/licenses/by/2.0), which permits unrestricted use, distribution, and reproduction in any medium, provided the original work is properly cited.
In the well-established model species Fundulus hetero-clitus, the species has evolved both highly plastic and locally adapted phenotypes within different selective contexts [11]. While plasticity has allowed the species to cope with environment variability, some F. hetero-clitus populations have evolved pollution tolerance allowing them to survive concentrations of organic con-taminants that are lethal to populations from clean habitats [12], in a response that is not plastic but adap-tive and heritable [11].
While the evolutionary consequences of pollutants have been well explored in natural populations of fresh-water fish using genomic and transcriptomic approaches (reviewed in [8]), less attention has been paid to diadro-mous fish species that complete their life-cycle through ontogenic shifts between freshwater and marine habitats (e.g. salmonids, anguillids). The study of diadromous species is particularly relevant as they represent a natural model to understand the combined impact of continen-tal anthropogenic and oceanic climate stressors. Unlike other model fish species, very little is known about the ecological and evolutionary consequences in species with a catadromous life-strategy, such as the European eel Anguilla anguilla, which illustrates an example of a fish species designated by the IUCN as “critically endan-gered” and potentially strongly affected by human stres-sors throughout its life cycle.
The European eel is a facultative catadromous species with a particularly complex life cycle that includes an oceanic and a continental phase. After spawning in the Sargasso Sea, larvae cross the Atlantic Ocean following the prevailing currents and metamorphose into glass eels upon reaching the edge of the continental shelf off Europe and North Africa. Glass eels complete the migration into riverine, estuarine and coastal feeding habitats as yellow eels, and after a highly variable feed-ing period, they metamorphose into silver eels that mi-grate back to the Sargasso Sea utilizing their high fat reserves, where they reproduce once and die [13]. Homing to a single spawning ground explains the lack of genetic differentiation between geographic areas across Europe, suggestive of a panmictic population [14-16], while a large variance in parental reproductive success associated with fluctuating ocean conditions explains the pattern of genetic patchiness (significant genetic differences among samples lacking a clear geo-graphical trend or pattern) found at local scale [17,18].
There has been a continuous decline of continental yellow eel recruitment since the 1950s and marked dec-adal reductions in glass eel recruitment since the early 1980s [19]. Over the last 5 years glass eel recruitment has been exceptionally low, averaging between less than 1% (continental North Sea) and 5% (elsewhere in Europe) of the 1960–1979 levels [19]. Several causes
have been put forward to explain the decline of the eel stock including anthropogenic factors such as overfish-ing, pollution, habitat degradation and man-introduced parasites and diseases [13], as well as environmental factors such as climate and ocean current change [20-22]. Recent genetic data suggest that the demographic decline did not entail a genetic decline of the same magnitude, as evidenced by the observation of a moder-ate to high level of genetic diversity, no signatures of a bottleneck episode and comparable values of short- and long-term effective population size [23].
While eels are regarded as fairly resilient, often inha-biting unproductive waters and polluted habitats, they are prone to bioaccumulation of lipophilic contaminants due to their particular ecology (benthic feeding) and physiology (high fat content) [24]. Evidence has been presented that different kinds of chemical compounds such as polychlorinated biphenyls (PCBs), pesticides and toxic metals could have a serious impact on the health of the European eel [for a review see 25,26]. Maes et al. [27] observed a significant negative correlation between heavy metal pollution load and condition, as well as a reduced genetic variability in highly polluted eels origin-ating from three Belgian river basins. It has been hypothesized that the accumulation of contaminants in the fat tissue of eels during the feeding stage could im-pair the quality of spawners [13,28]. In this sense, a considerable decrease in condition and lipid energy stores might be responsible for migrating adults fail-ing to swim the 6,000 km distance to the Sargasso Sea [29], while mobilization of lipids and lipophilic contaminants to the gonads during the transoceanic migration might compromise production of good quality eggs and normal development of early larval stages [30].
Understanding the impact of pollutants at the genomic and transcriptomic level is a critical point in order to safe-guard the evolutionary adaptive potential of the European eel. Several experimental studies on gene expression have shown genetic responses to pollutants in eel [31-36]. However, large-scale transcriptomic approaches in the European eel have been limited to the study of osmoregu-lation [37] and comparative gene expression analysis be-tween sympatric European and American eel larvae in the Sargasso Sea [38]. Using the same microarray comprising about 6,000 anonymous probes, Kalujnaia et al. [37] iden-tified 229 differentially expressed genes with a putative role in migration between freshwater and marine environ-ments, while Bernatchez et al. [38] identified 146 genes showing different timing of expression between the two Atlantic eels. In this paper we first describe the develop-ment of an eel-specific microarray of about 15,000 anno-tated cDNAs based on a large collection of existing and novel high-throughput transcriptomic sequences. Our
approach aims at identifying genes involved in the re-sponse to pollutants by means of a comparative analysis of gene expression between environments with a varying level of pollution. As such, we aim at assessing the poten-tial fitness consequences of bioaccumulation levels in indi-vidual eels and pinpoint the metabolic pathways most influenced by such stressors.
Results
Transcriptome assembly and analysis
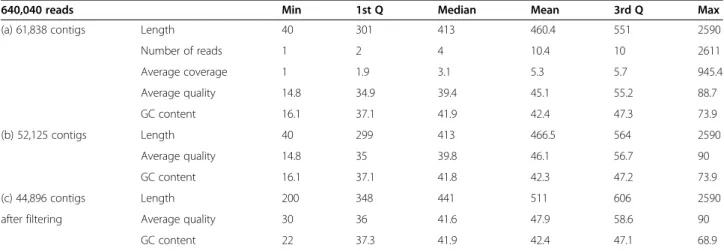
A total of 640,040 reads were assembled into contigs using MIRA 3 (Table 1). A first run of assembly produced
61,838 contigs with a mean length of 460.4 bp, ranging from 40 to 2,590 bp. On average, transcripts included 10.4 reads 181 (from 1 to 2,611, median value of 4), with a read cover-182 age of 5.3 (from 1 to 945.4, me-dian value of 3.1). A second run conducted using the previously obtained contigs as input produced 52,125 contigs. Average length was similar to the first run (466.5 bp), but average quality increased from a mean of 45.1 (about 1 in 32,000 bp error rate) to 46.1 (about 1 in 41,000 bp error rate). A further quality check was conducted for the final set of putative transcripts by fil-tering sequences by length (minimum 200 bp) and
Table 1 Statistics describing the distributions of different properties of contig sequences (a) obtained by the first run of assembly, (b) second run of assembly and (c) final set after filtering for minimum sequence length and average quality
640,040 reads Min 1st Q Median Mean 3rd Q Max
(a) 61,838 contigs Length 40 301 413 460.4 551 2590
Number of reads 1 2 4 10.4 10 2611 Average coverage 1 1.9 3.1 5.3 5.7 945.4 Average quality 14.8 34.9 39.4 45.1 55.2 88.7 GC content 16.1 37.1 41.9 42.4 47.3 73.9 (b) 52,125 contigs Length 40 299 413 466.5 564 2590 Average quality 14.8 35 39.8 46.1 56.7 90 GC content 16.1 37.1 41.8 42.3 47.2 73.9 (c) 44,896 contigs Length 200 348 441 511 606 2590
after filtering Average quality 30 36 41.6 47.9 58.6 90
GC content 22 37.3 41.9 42.4 47.1 68.9
average sequence quality (minimum of 30). A total of 44,896 contigs were obtained, with a mean length of 511 bp and an average sequence quality of 47.9 (cor-responding to an average error rate of 1 in 62,000 bp).
Among all transcripts, 14,574 (28%) showed BLAST matches. Eukaryotes accounted for 96% of all BLAST hits, with vertebrates accounting for most (87.2%) of the hits (Figure 1). Among vertebrates, fish represented 73.1% of all hits, followed by mammals (11.6%). The most represented fish species was zebrafish Danio rerio (42.3%), followed by salmon Salmo salar (19.6%) and pufferfish Takigufu rubripes (10%). Anguillids repre-sented less than 5% of hits among fish, including Japa-nese eel A. japonica (2%), European eel A. anguilla (1.6%) and American eel A. rostrata (0.3%).
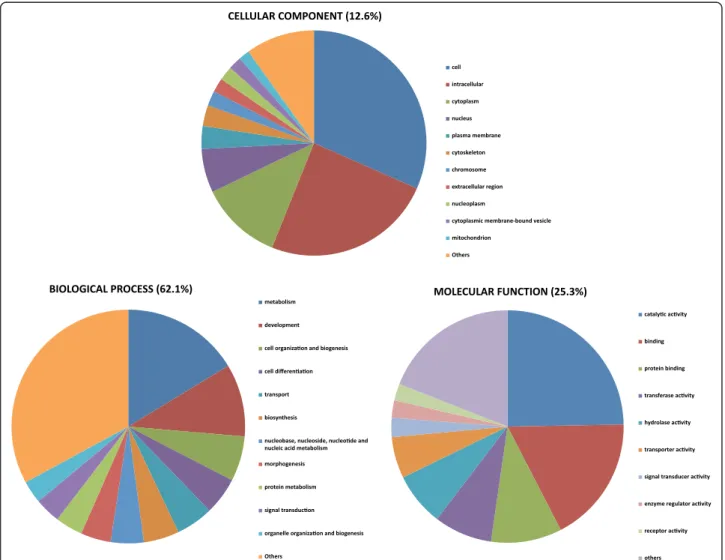
Functional annotation using the Blast2Go suite showed 10,920 of the contigs (20.95%) associated to GO terms, for a total of 76,158 term occurrences. Using the webtool CateGOrizer, GO classes were grouped in a
total of 112 Go-Slim terms including biological process (62.1%), molecular function (25.3%) and cellular compo-nent (12.6%) ontologies (Figure 2). Catalytic activity and binding represented the majority of molecular functions. Key processes such as metabolism and development were present among biological processes.
All contig sequences are available at Eeelbase release 2.0, a dedicated database implemented using the MySQL and Django web framework and freely available at: http://compgen.bio.unipd.it/eeelbase. The database is queryable by keywords and BLAST using nucleotide or protein sequences. For each contig (identified by Eeel-base ID) the FASTA sequence is provided together with the list of all reads belonging to the contig, BLAST results and associated GO Terms. The web site also allows to perform alignments with reference genomes using on the fly BLAT search against the latest releases of the zebrafish and stickleback genomes in the UCSC Genome Browser.
Figure 2 Functional annotation of European eel contigs associated to GO terms. GO classes were grouped into 112 GO-slim terms for biological process (BP), molecular function (MF) and cellular component (CC) ontologies.
Pollution analysis
Comparison of pollutants between the Tiber (N = 30) and Bolsena (N = 6) sites pointed to strong differences in pollution load between sites, with concentration of all pollutants measured being consistently higher in the tis-sues of silver male eels at the Tiber site than in those from the Bolsena site (Table 2), despite a high individual variability. Concentrations of PCBs were 6–7 times higher at the Tiber site but not significantly so using univariate ANOVA. The sum of the 7 main PCB conge-ners (IUPAC No. 28, 52, 101, 118, 138, 153 and 180) in tissue collected at the Tiber site (214.4 ng/g ww) was also above the Italian limit for consumption (75 ng/g ww), while at the Bolsena site this value was below the limit (37.6 ng/g ww). The value of Sum 7 PCBs at Tiber was comparable to the value reported in Miniero et al. [39] on eels collected from the urban tract of the river Tiber in Rome (167–372 ng/g ww). Organochlorine pes-ticides (OCPs) were twofold higher in the tissues of sil-ver male eels at the Tiber site with significant differences for pp-DDE (p = 0.038) and pp-DDT (p = 0.007). Bromi-nated flame retardants (BFRs) were 6 to 8 times higher at the Tiber site than at the Bolsena site, with both poly-brominated diphenyl ethers (PBDEs) and hexabromocy-clododecane (HBCD) isomers being highly significant (p < 0.001). The tissues collected at the river Tiber site also exhibited the highest concentrations for all nine
metals measured but differences were not statistically significant due to the high individual variability. How-ever, a multivariate ANOVA conducted on a set of all pollutants combined (Sum 36 PCBs, HCB, DDE, pp-DDT, Sum 10 PBDEs, Sum 3 HBCDs and nine metals) indicated statistically significant differences (F = 2.7; df =
20; p = 0.022).
Gene expression analysis
A European eel-specific microarray of 14,913 cDNAs was generated and used to identify genes involved in re-sponse to pollutants by comparing the expression pro-files of 23 individuals from heavily-polluted (Tiber, 8 males) and lowly-polluted (Bolsena, 7 males and 8 females) environments. Mean concentrations of pollu-tants were consistently higher at the Tiber site, but not all individual measurements. Across all 23 microarray experiments, only 99 probes (0.6%) did not show a signal higher than the background, while 14,274 (95.7%) were successful (flag value equal to 1) in at least 16 out of 23 experiments.
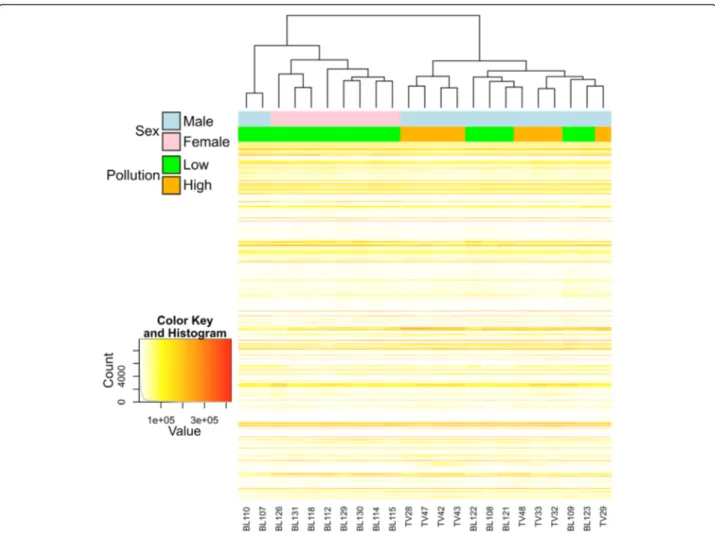
Prior to the analysis of differentially expressed genes, a Pearson correlation-based heatmap using a subset of 2,000 genes only partially grouped individuals according to sampling site (Figure 3), which is suggestive of similar environmental conditions. All females were from the same site (Bolsena) and clustered together, which is
Table 2 Average concentration of pollutants in European eel silver males from the Tiber (N = 30) and Bolsena (N = 6) sites
Tiber Bolsena
Mean Min Max SD Mean Min Max SD p
Sum 36 PCBs 489.08 64.19 3836.97 650.59 73.63 14.68 245.01 86.99 0.132 Sum 7 PCBs 214.38 27.24 1442.19 242.09 37.63 6.01 120.32 43.00 0.087 HCB 6.99 2.60 13.99 2.31 4.35 1.35 16.76 6.12 0.071 pp-DDE 45.33 15.10 84.46 16.85 29.29 12.21 54.20 15.14 0.038* pp-DDT 12.97 4.03 27.11 6.02 5.45 0.75 14.36 5.15 0.007* Sum 10 PBDEs 44.00 11.42 86.49 18.31 6.68 1.54 25.82 9.43 <0.001* Sum 3 HBCDs 53.16 3.03 101.63 21.93 6.42 0.55 31.72 12.42 <0.001* Ag 0.021 DL 0.047 0.012 0.011 0.006 0.017 0.005 0.320 As 0.393 0.161 0.920 0.153 0.353 0.244 0.572 0.116 0.550 Cd 0.026 DL 0.352 0.074 DL DL DL DL 0.401 Co 0.050 0.007 0.274 0.049 0.018 0.006 0.030 0.008 0.124 Cr 0.129 0.033 0.394 0.088 0.095 0.047 0.229 0.068 0.379 Cu 1.742 0.71 4.08 0.681 1.564 1.08 2.54 0.517 0.550 Ni 0.040 0.006 0.147 0.039 0.028 0.016 0.057 0.015 0.467 Pb 0.092 0.006 0.430 0.084 0.049 0.017 0.087 0.023 0.227 Zn 66.135 27.1 155.0 25.857 59.393 41.0 96.4 19.617 0.551 (All Pollutants) F = 2.7 df = 20 0.022*
Univariate and multivariate ANOVAs for equal pollutant bioaccumulation are presented. A Multivariate ANOVA was also conducted on a set of all pollutants combined (Sum 36 PCBs, HCB, pp-DDE, pp-DDT, Sum 10 PBDEs, Sum 3 HBCDs and nine metals). Concentration of PCBs, OCPs and BFRs is expressed in ng/g of wet weight. Metal concentration is expressed inμg/g of dry weight. DL = below detection limit. * = statistically significant.
scarcely informative. However, males and females were well separated. Since differences in the expression of sex-linked genes could interfere with the identification of genes involved in response to pollutants, two separate analyses were conducted in parallel (1) considering only males and (2) with both males and females included.
A two-unpaired class Significance Analysis of Micro-array (SAM) test was conducted on normalized data be-tween individuals from the Tiber (N = 8 males) and Bolsena (N = 7 males) sites. Enforcing a stringent 0% false discovery rate (FDR), a total of 168 transcripts were differentially expressed in the samples from Tiber in comparison with the samples from Bolsena, 30 upregu-lated and 138 downreguupregu-lated. With a less restrictive 5% FDR, a list of 1,171 probes were differentially expressed in the Tiber individuals in comparison with the Bolsena individuals, 406 over-expressed and 775 under-expressed.
A more systematic functional interpretation of the set of differentially expressed genes between sites was
obtained by an enrichment analysis in DAVID. Using the list of transcripts obtained with the 5% FDR corre-sponding to 709 unique transcripts, a putative match with zebrafish was found for 563 transcripts. Enrich-ment analysis showed a total of 23 terms, all signifi-cantly over-represented in the heavily-polluted Tiber site compared to the Bolsena site (Table 3), including 7 KEGG pathway terms, 5 MF-GO terms, 3 BP-GO terms, 3 SP-PIR (a database of protein superfamilies) keywords and 5 InterPro (a database of protein fam-ilies). The genes assigned to the above 23 terms are mostly known to be involved in drug metabolism (Table 4). Those included genes encoding several members of the cytochrome P450 superfamily of enzymes (CYP2J23, CYP3A65, CYP46A1) that catalyze the oxidation of xenobiotic substances such as pollu-tants, drugs and toxic elements. A higher number of terms were under-expressed in the individuals from the Tiber site in comparison with the individuals from the Bolsena site (Table 5). The assigned genes are Figure 3 Pearson-correlation based heatmap using the 2,000 genes with higher expression and variability across samples. Individuals are colour-coded according to sex (pink, females; blue, males) and pollution (green, low; orange, high).
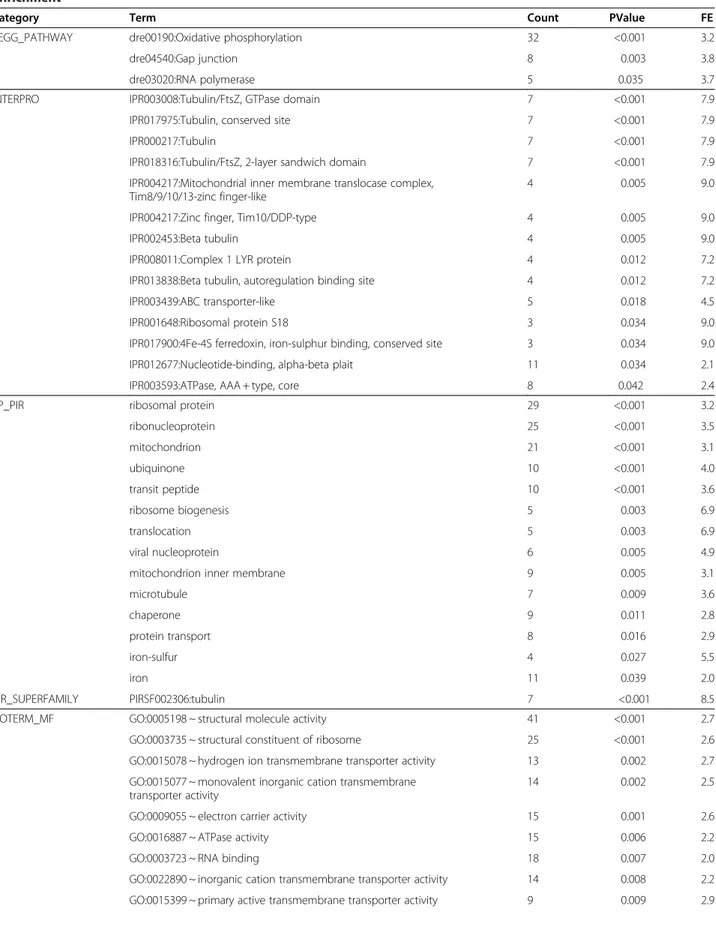
mostly known to be involved in energetic metabolism (Table 6). Three KEGG pathways were significantly enriched, namely oxidative phosphorylation (32 genes; Figure 4), gap junction (8 genes; Figure 5) and RNA polymerase (5 genes; Figure 6).
When repeating the analysis with females from Bol-sena also included (total N = 23 individuals), 1,135 tran-scripts were differentially expressed in the Tiber samples in comparison with the Bolsena samples using a 5% FDR, 552 transcripts over-expressed and 583 transcripts under-expressed. Enrichment analysis using DAVID con-firmed the results obtained with the males dataset and all key genes over-expressed (genes involved in drug me-tabolism) and under-expressed (genes involved in energy metabolism) in the individuals from Tiber were also sig-nificantly enriched when females were added to the ana-lysis. Unlike gene expression profiles, which were strongly affected by sexes, enrichment analyses did not vary when including females, which suggests that the differentially expressed genes between Tiber and Bolsena were under-represented among the sub-set of 2,000 genes used in the Pearson correlation-based heatmap.
When correlating gene expression and individual mea-sures of pollutants in SAM, a total of 14 transcripts were
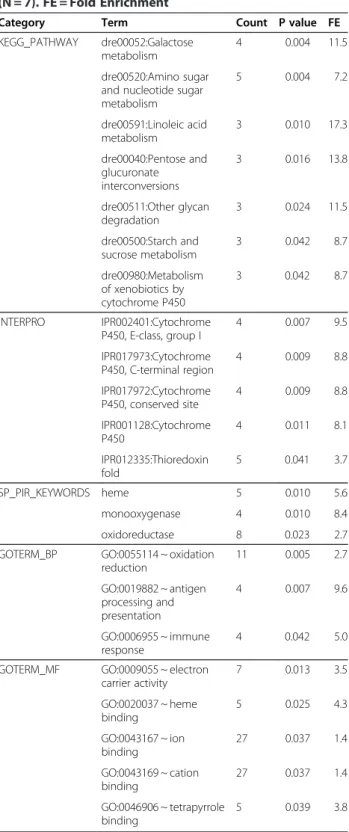
Table 3 Functional Annotation Enrichment analysis of statistically-significant over-expressed genes in European eel silver males from the river Tiber site (N = 8) in comparison with silver males from the lake Bolsena site (N = 7). FE = Fold Enrichment
Category Term Count P value FE
KEGG_PATHWAY dre00052:Galactose metabolism
4 0.004 11.5
dre00520:Amino sugar and nucleotide sugar metabolism 5 0.004 7.2 dre00591:Linoleic acid metabolism 3 0.010 17.3 dre00040:Pentose and glucuronate interconversions 3 0.016 13.8 dre00511:Other glycan degradation 3 0.024 11.5 dre00500:Starch and sucrose metabolism 3 0.042 8.7 dre00980:Metabolism of xenobiotics by cytochrome P450 3 0.042 8.7 INTERPRO IPR002401:Cytochrome P450, E-class, group I 4 0.007 9.5 IPR017973:Cytochrome P450, C-terminal region 4 0.009 8.8 IPR017972:Cytochrome P450, conserved site 4 0.009 8.8 IPR001128:Cytochrome P450 4 0.011 8.1 IPR012335:Thioredoxin fold 5 0.041 3.7 SP_PIR_KEYWORDS heme 5 0.010 5.6 monooxygenase 4 0.010 8.4 oxidoreductase 8 0.023 2.7 GOTERM_BP GO:0055114 ~ oxidation
reduction 11 0.005 2.7 GO:0019882 ~ antigen processing and presentation 4 0.007 9.6 GO:0006955 ~ immune response 4 0.042 5.0
GOTERM_MF GO:0009055 ~ electron carrier activity 7 0.013 3.5 GO:0020037 ~ heme binding 5 0.025 4.3 GO:0043167 ~ ion binding 27 0.037 1.4 GO:0043169 ~ cation binding 27 0.037 1.4 GO:0046906 ~ tetrapyrrole binding 5 0.039 3.8
Table 4 Functional Annotation Clustering of statistically-significant over-expressed genes in European eel silver males from the river Tiber site (N = 8) in comparison with silver males from the lake Bolsena site (N = 7)
Annotation Cluster Gene
Annotation Cluster 1 Cytochrome c oxidase subunit 1 (Enrichment Score: 1.81) Cytochrome P450, family 2 subfamily J,
polypeptide 23 (CYP2J23)
Cytochrome P450, family 3 subfamily A, polypeptide 65 (CYP3A65)
Cytochrome P450, family 46 subfamily A, polypeptide 61 (CYP46A1)
Glutamate dehydrogenase 1a Glutathione peroxidase 1a Retinol saturase (all-trans-retinol 13,14-reductase)
SH3 domain binding glutamic acid-rich protein like 3 Sulfide quinone reductase-like Transferrin-a, Rho-class gluthatione S-transferase
Annotation Cluster 2 Pi-class glutathione-S-transferase (Enrichment Score: 1.53) Glutathione peroxidase 1a
SH3 domain binding glutamic acid-rich protein like 3 Transferrin receptor 1a Transferrin -a: Rho-class glutathione-S-transferase
Table 5 Functional Annotation Enrichment analysis of statistically-significant under-expressed genes in European eel silver males from the river Tiber site (N = 8) in comparison with silver males from the lake Bolsena site (N = 7). FE = Fold Enrichment
Category Term Count PValue FE
KEGG_PATHWAY dre00190:Oxidative phosphorylation 32 <0.001 3.2
dre04540:Gap junction 8 0.003 3.8
dre03020:RNA polymerase 5 0.035 3.7
INTERPRO IPR003008:Tubulin/FtsZ, GTPase domain 7 <0.001 7.9
IPR017975:Tubulin, conserved site 7 <0.001 7.9
IPR000217:Tubulin 7 <0.001 7.9
IPR018316:Tubulin/FtsZ, 2-layer sandwich domain 7 <0.001 7.9 IPR004217:Mitochondrial inner membrane translocase complex,
Tim8/9/10/13-zinc finger-like
4 0.005 9.0
IPR004217:Zinc finger, Tim10/DDP-type 4 0.005 9.0
IPR002453:Beta tubulin 4 0.005 9.0
IPR008011:Complex 1 LYR protein 4 0.012 7.2
IPR013838:Beta tubulin, autoregulation binding site 4 0.012 7.2
IPR003439:ABC transporter-like 5 0.018 4.5
IPR001648:Ribosomal protein S18 3 0.034 9.0
IPR017900:4Fe-4S ferredoxin, iron-sulphur binding, conserved site 3 0.034 9.0
IPR012677:Nucleotide-binding, alpha-beta plait 11 0.034 2.1
IPR003593:ATPase, AAA + type, core 8 0.042 2.4
SP_PIR ribosomal protein 29 <0.001 3.2
ribonucleoprotein 25 <0.001 3.5 mitochondrion 21 <0.001 3.1 ubiquinone 10 <0.001 4.0 transit peptide 10 <0.001 3.6 ribosome biogenesis 5 0.003 6.9 translocation 5 0.003 6.9 viral nucleoprotein 6 0.005 4.9
mitochondrion inner membrane 9 0.005 3.1
microtubule 7 0.009 3.6 chaperone 9 0.011 2.8 protein transport 8 0.016 2.9 iron-sulfur 4 0.027 5.5 iron 11 0.039 2.0 PIR_SUPERFAMILY PIRSF002306:tubulin 7 <0.001 8.5
GOTERM_MF GO:0005198 ~ structural molecule activity 41 <0.001 2.7
GO:0003735 ~ structural constituent of ribosome 25 <0.001 2.6 GO:0015078 ~ hydrogen ion transmembrane transporter activity 13 0.002 2.7 GO:0015077 ~ monovalent inorganic cation transmembrane
transporter activity
14 0.002 2.5
GO:0009055 ~ electron carrier activity 15 0.001 2.6
GO:0016887 ~ ATPase activity 15 0.006 2.2
GO:0003723 ~ RNA binding 18 0.007 2.0
GO:0022890 ~ inorganic cation transmembrane transporter activity 14 0.008 2.2 GO:0015399 ~ primary active transmembrane transporter activity 9 0.009 2.9
Table 5 Functional Annotation Enrichment analysis of statistically-significant under-expressed genes in European eel silver males from the river Tiber site (N = 8) in comparison with silver males from the lake Bolsena site (N = 7). FE = Fold Enrichment (Continued)
GO:0015405 ~ P-P-bond-hydrolysis-driven transmembrane transporter activity
9 0.009 2.9
GO:0051536 ~ iron-sulfur cluster binding 6 0.012 4.0
GO:0051540 ~ metal cluster binding 6 0.012 4.0
GO:0016651 ~ oxidoreductase activity, acting on NADH or NADPH 7 0.020 3.1 GO:0046961 ~ proton-transporting ATPase activity, rotational mechanism 5 0.024 4.2
GO:0051537 ~ 2 iron, 2 sulfur cluster binding 3 0.032 9.2
GO:0003899 ~ DNA-directed RNA polymerase activity 5 0.032 3.9
GO:0034062 ~ RNA polymerase activity 5 0.032 3.9
GO:0008135 ~ translation factor activity, nucleic acid binding 9 0.032 2.3 GO:0003743 ~ translation initiation factor activity 7 0.037 2.7
GO:0003924 ~ GTPase activity 7 0.037 2.7
GOTERM_CC GO:0005739 ~ mitochondrion 43 <0.001 2.6
GO:0030529 ~ ribonucleoprotein complex 46 <0.001 2.3
GO:0044429 ~ mitochondrial part 31 <0.001 3.0
GO:0005740 ~ mitochondrial envelope 24 <0.001 2.8
GO:0005840 ~ ribosome 34 <0.001 2.2
GO:0043228 ~ non-membrane-bounded organelle 61 <0.001 1.6 GO:0043232 ~ intracellular non-membrane-bounded organelle 61 <0.001 1.6
GO:0005743 ~ mitochondrial inner membrane 19 <0.001 2.8
GO:0019866 ~ organelle inner membrane 19 <0.001 2.7
GO:0031966 ~ mitochondrial membrane 20 <0.001 2.6
GO:0031967 ~ organelle envelope 24 <0.001 2.3
GO:0031975 ~ envelope 24 <0.001 2.3
GO:0031090 ~ organelle membrane 24 0.001 1.9
GO:0031974 ~ membrane-enclosed lumen 22 0.002 1.9
GO:0005758 ~ mitochondrial intermembrane space 6 0.005 4.5
GO:0031970 ~ organelle envelope lumen 6 0.005 4.5
GO:0015934 ~ large ribosomal subunit 6 0.009 4.1
GO:0042719 ~ mitochondrial intermembrane space protein transporter complex
4 0.011 6.8
GO:0031980 ~ mitochondrial lumen 6 0.014 3.7
GO:0005759 ~ mitochondrial matrix 6 0.014 3.7
GO:0044455 ~ mitochondrial membrane part 6 0.021 3.4
GO:0033279 ~ ribosomal subunit 7 0.037 2.6
GO:0005874 ~ microtubule 7 0.037 2.6
GOTERM_BP GO:0006412 ~ translation 36 <0.001 2.5
GO:0042254 ~ ribosome biogenesis 10 <0.001 5.1
GO:0022613 ~ ribonucleoprotein complex biogenesis 10 <0.001 4.6
GO:0051258 ~ protein polymerization 7 <0.001 5.9
GO:0070585 ~ protein localization in mitochondrion 5 <0.001 9.2 GO:0006626 ~ protein targeting to mitochondrion 5 <0.001 9.2
GO:0007005 ~ mitochondrion organization 5 <0.001 9.2
positively correlated (1 with PCB and the rest with metals) and a total of 27 transcripts were negatively correlated (2 with PCB, 7 with OCPs, 13 with BFRs and 5 with metals). In both cases, the same associa-tions were obtained using either a 0, 1 or 5% FDR. Using the list of positively and negatively correlated transcripts, a putative match with zebrafish was found for 20 transcripts to be used in DAVID. A total of 11 terms were enriched (all negatively correlated with in-dividual measures of pollutants), but only one term
was statistically significant (p = 0.015; Table 7), cor-responding to NADH-ubiquinone oxidoreductase chain 2 and 5 genes. No functional annotation clusters or KEGG pathways were enriched.
Estimation of evolutionary distance of CYP3A genes
Our study shows one CYP3A isozyme over-expressed in the Tiber samples, with a positive BLAST hit with zebra-fish Danio rerio CYP3A65 [40], one of the key enzymes involved in the detoxification of xenobiotic substances.
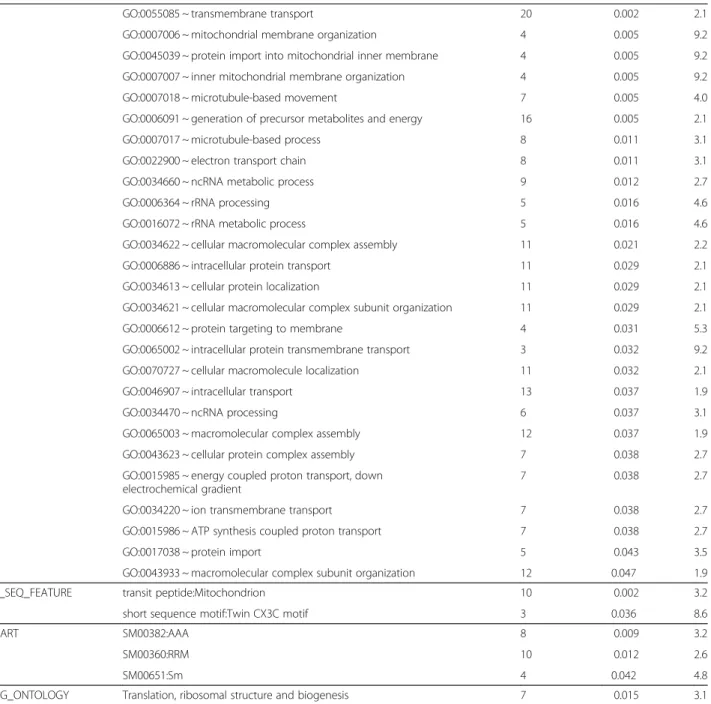
Table 5 Functional Annotation Enrichment analysis of statistically-significant under-expressed genes in European eel silver males from the river Tiber site (N = 8) in comparison with silver males from the lake Bolsena site (N = 7). FE = Fold Enrichment (Continued)
GO:0055085 ~ transmembrane transport 20 0.002 2.1
GO:0007006 ~ mitochondrial membrane organization 4 0.005 9.2 GO:0045039 ~ protein import into mitochondrial inner membrane 4 0.005 9.2 GO:0007007 ~ inner mitochondrial membrane organization 4 0.005 9.2
GO:0007018 ~ microtubule-based movement 7 0.005 4.0
GO:0006091 ~ generation of precursor metabolites and energy 16 0.005 2.1
GO:0007017 ~ microtubule-based process 8 0.011 3.1
GO:0022900 ~ electron transport chain 8 0.011 3.1
GO:0034660 ~ ncRNA metabolic process 9 0.012 2.7
GO:0006364 ~ rRNA processing 5 0.016 4.6
GO:0016072 ~ rRNA metabolic process 5 0.016 4.6
GO:0034622 ~ cellular macromolecular complex assembly 11 0.021 2.2
GO:0006886 ~ intracellular protein transport 11 0.029 2.1
GO:0034613 ~ cellular protein localization 11 0.029 2.1
GO:0034621 ~ cellular macromolecular complex subunit organization 11 0.029 2.1
GO:0006612 ~ protein targeting to membrane 4 0.031 5.3
GO:0065002 ~ intracellular protein transmembrane transport 3 0.032 9.2 GO:0070727 ~ cellular macromolecule localization 11 0.032 2.1
GO:0046907 ~ intracellular transport 13 0.037 1.9
GO:0034470 ~ ncRNA processing 6 0.037 3.1
GO:0065003 ~ macromolecular complex assembly 12 0.037 1.9
GO:0043623 ~ cellular protein complex assembly 7 0.038 2.7
GO:0015985 ~ energy coupled proton transport, down electrochemical gradient
7 0.038 2.7
GO:0034220 ~ ion transmembrane transport 7 0.038 2.7
GO:0015986 ~ ATP synthesis coupled proton transport 7 0.038 2.7
GO:0017038 ~ protein import 5 0.043 3.5
GO:0043933 ~ macromolecular complex subunit organization 12 0.047 1.9
UP_SEQ_FEATURE transit peptide:Mitochondrion 10 0.002 3.2
short sequence motif:Twin CX3C motif 3 0.036 8.6
SMART SM00382:AAA 8 0.009 3.2
SM00360:RRM 10 0.012 2.6
SM00651:Sm 4 0.042 4.8
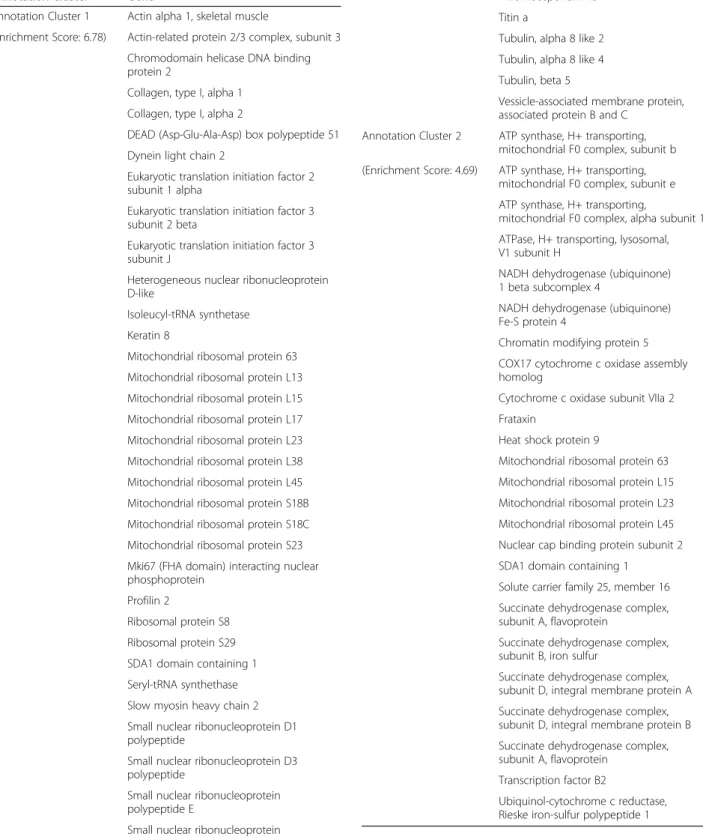
Table 6 Functional Annotation Clustering of statistically-significant under-expressed genes in European eel silver males from the river Tiber site (N = 8) in comparison with silver males from the lake Bolsena site (N = 7)
Annotation Cluster Gene
Annotation Cluster 1 Actin alpha 1, skeletal muscle
(Enrichment Score: 6.78) Actin-related protein 2/3 complex, subunit 3 Chromodomain helicase DNA binding protein 2
Collagen, type I, alpha 1 Collagen, type I, alpha 2
DEAD (Asp-Glu-Ala-Asp) box polypeptide 51 Dynein light chain 2
Eukaryotic translation initiation factor 2 subunit 1 alpha
Eukaryotic translation initiation factor 3 subunit 2 beta
Eukaryotic translation initiation factor 3 subunit J
Heterogeneous nuclear ribonucleoprotein D-like
Isoleucyl-tRNA synthetase Keratin 8
Mitochondrial ribosomal protein 63 Mitochondrial ribosomal protein L13 Mitochondrial ribosomal protein L15 Mitochondrial ribosomal protein L17 Mitochondrial ribosomal protein L23 Mitochondrial ribosomal protein L38 Mitochondrial ribosomal protein L45 Mitochondrial ribosomal protein S18B Mitochondrial ribosomal protein S18C Mitochondrial ribosomal protein S23 Mki67 (FHA domain) interacting nuclear phosphoprotein
Profilin 2
Ribosomal protein S8 Ribosomal protein S29 SDA1 domain containing 1 Seryl-tRNA synthethase Slow myosin heavy chain 2 Small nuclear ribonucleoprotein D1 polypeptide
Small nuclear ribonucleoprotein D3 polypeptide
Small nuclear ribonucleoprotein polypeptide E
Small nuclear ribonucleoprotein polypeptide F-like
Thrombospondin 1
Table 6 Functional Annotation Clustering of statistically-significant under-expressed genes in European eel silver males from the river Tiber site (N = 8) in comparison with silver males from the lake Bolsena site (N = 7) (Continued)
Thrombospondin 4b Titin a
Tubulin, alpha 8 like 2 Tubulin, alpha 8 like 4 Tubulin, beta 5
Vessicle-associated membrane protein, associated protein B and C
Annotation Cluster 2 ATP synthase, H+ transporting, mitochondrial F0 complex, subunit b (Enrichment Score: 4.69) ATP synthase, H+ transporting,
mitochondrial F0 complex, subunit e ATP synthase, H+ transporting,
mitochondrial F0 complex, alpha subunit 1 ATPase, H+ transporting, lysosomal, V1 subunit H
NADH dehydrogenase (ubiquinone) 1 beta subcomplex 4
NADH dehydrogenase (ubiquinone) Fe-S protein 4
Chromatin modifying protein 5 COX17 cytochrome c oxidase assembly homolog
Cytochrome c oxidase subunit VIIa 2 Frataxin
Heat shock protein 9
Mitochondrial ribosomal protein 63 Mitochondrial ribosomal protein L15 Mitochondrial ribosomal protein L23 Mitochondrial ribosomal protein L45 Nuclear cap binding protein subunit 2 SDA1 domain containing 1
Solute carrier family 25, member 16 Succinate dehydrogenase complex, subunit A, flavoprotein
Succinate dehydrogenase complex, subunit B, iron sulfur
Succinate dehydrogenase complex, subunit D, integral membrane protein A Succinate dehydrogenase complex, subunit D, integral membrane protein B Succinate dehydrogenase complex, subunit A, flavoprotein
Transcription factor B2
Ubiquinol-cytochrome c reductase, Rieske iron-sulfur polypeptide 1
Estimation of evolutionary distances using pairwise dis-tance (p-disdis-tance model) in MEGA 5 [41] showed a gen-etic distance of 0.308 between the European eel CYP3A and zebrafish CYP3A65. Comparison with other amino acid sequences available in GenBank showed slightly higher pairwise genetic distances between the European eel CYP3A and killifish Fundulus heteroclitus CYP3A30 (0.321), medaka Oryzias latipes CYP3A40 (0.365) and rainbow trout Oncorhynchus mykiss CYP3A27 (0.372). By comparison, a higher genetic distance was found be-tween the European eel CYP3A and the human CYP3A4 of 0.614. A Neighbour-Joining tree comparing those CYP3A isozymes grouped together the European eel and zebrafish CYP3As, separated from the killifish, medaka and rainbow trout, which formed a second group (Figure 7), while the human CYP3A4 appeared as the most distant.
Discussion
Over-expression of detoxification genes
Several genes related to metabolism of xenobiotics were upregulated in the highly polluted site (Tiber) in com-parison with the low pollution site (Bolsena), which indi-cates that their expression is pollutant-related. These
include a set of cytochrome P450 (CYP) genes that were upregulated by 8–10 fold in the Tiber sample group. The liver CYP enzymes are a superfamily of heme-containing monooxygenases that constitute the principal enzymes involved in metabolism of xenobiotics. The function of most CYPs is to catalyze the oxidative and reductive metabolism of xenobiotic substances such as drugs, environmental chemicals and endogenous sub-strates [42]. Out of all families, CYP3A isozymes com-prise the largest proportion of CYPs in the liver. CYP3A isozymes are involved in the first phase of the xenobiotic metabolism by means of introducing reactive or polar groups into the xenobiotics, thus modifying their chem-ical structure. Previous studies have shown that expres-sion of CYP3A isozymes is induced by dioxins [40], PCBs [43] and PBDEs [44].
A novel European eel CYP3A gene, upregulated in the highly polluted Tiber site, was identified by enrichment analysis and shown to be ortholog to zebrafish Danio rerio CYP3A65 by phylogenetic analysis. The European eel CYP3A conformed to the specific structural features associated with the family, and despite being a partial se-quence, several conserved regions could be identified in-cluding a total of four substrate recognition sites (partial Figure 4 Mapping of zebrafish genes homologous to European eel transcripts to oxidative phosphorylation. Green boxes represent KEGG nodes specific to the considered organism. Red stars indicate enriched nodes, which may represent one or more genes.
SRS1, full SRS2, SRS3 and SRS4). Differences in CYP catalytic activities are suggested to be determined by amino acid changes in SRS sites [45]. In the case of the European eel CYP3A, differences in amino acid se-quence between the species in Figure 7 were predomin-antly observed in SRS3 (43%) but not in SRS2 (0%) or SRS4 (6%), which agrees with the observations when comparing two CYP3A paralogs in medaka [45].
In addition to xenobiotic metabolizing enzymes involved in the first phase of detoxification, we also identified genes involved in the second phase of the xenobiotic metabolism, particularly glutathione-S-transferase (GST), which was over-expressed by 1.5 fold in the heavily-polluted Tiber site. Following addition of reactive functional groups by CYPs in phase I, phase II enzymes catalyze the conjugation of the xenobiotic par-ent compound or its metabolites with an endogenous ligand, thus facilitating its excretion [46]. GSTs are a multigene superfamily of dimeric multifunctional enzymes that catalyze the conjugation of metabolites by covalently adding reduced glutathione (GSH). Based on their biochemical, immunologic and structural proper-ties, GSTs are categorized into 4 main classes: alpha,
mu, pi, and theta. The gene over-expressed in the Tiber samples was glutathione S-transferase pi (GSTP1), previ-ously described in many fish species including the Euro-pean eel (GenBank accession number AAS01601). In contrast with phase I enzymes, an increase in GST activ-ity as a response to xenobiotics like the one found in our study in the highly polluted Tiber site does not seem to be universal, and while some studies show a higher enzyme activity, others do not observe changes or even report negative results. In this sense, a review of 43 la-boratory and 39 field studies in fish only reported a sig-nificant GST increase in 33% of the studies [46]. Besides biotransformation or metabolic enzymes, many pollu-tants have been shown to exert toxic effects related to oxidative stress [47]. Antioxidant enzymes such as superoxide dismutase (SOD), catalase (CAT) or glutathi-one peroxidase (GPOX) defend the organisms against oxygen toxicity and are critical during the detoxification of radicals to non-reactive molecules. In our study, GPOX was upregulated in samples from the highly-polluted Tiber site and was included in the two anno-tated clusters that were significantly enriched. GPOX is a peroxidase that plays an important role in protecting Figure 5 Mapping of zebrafish genes homologous to European eel transcripts to gap junction. Green boxes represent KEGG nodes specific to the considered organism. Red stars indicate enriched nodes, which may represent one or more genes.
membranes from lipid peroxidation damage. The increased GPOX activity observed in our study contrasts with the lack of response of GPOX to pollution found in most studies. The review of Van der Oost et al. [46] reported a positive response on GPOX in only 14% of field studies, limited to chub Squalius cephalus and grey mullet Mugil cephalus. Regarding other antioxidant enzymes, the European eel platform developed in this study included 3 transcripts encoding for SOD, only one of which was upregulated in the samples from the Tiber site, although not significantly so. No transcripts
showing a significant match with CAT were included in the platform.
Along with detoxification genes, environmental stress has been proposed to induce the synthesis of proteins involved in protection and repair of the cell in response to environmental perturbations, including stress (heat shock) proteins, metallothioneins and multi-xenobiotic resistance (MXR) transmembrane proteins. In particular, metallothioneins constitute a superfamily of proteins involved in the regulation and/or detoxification of a wide variety of metals (e.g., Cd, Cu, Zn, Hg, Co, Ni, Bi and Figure 6 Mapping of zebrafish genes homologous to European eel transcripts to RNA polymerase. Green boxes represent KEGG nodes specific to the considered organism. Red stars indicate enriched nodes, which may represent one or more genes.
Table 7 Functional Annotation Genes correlated with pollutants at the individual level. FE = Fold Enrichment
Category Term Count P value FE
INTERPRO IPR002750: NADH 2 0.015 122.7
KEGG_PATHWAY dre03010: Ribosome 3 0.072 5.8
SP_PIR_KEYWORDS respiratory chain 2 0.065 27.5
electron transport 2 0.085 20.6
GOTERM_BP GO:0042773 ATP synthesis coupled electron transport 2 0.054 32.9
GO:0022904 respiratory electron transport chain 2 0.072 24.7
GOTERM_MF GO:0050136 NADH dehydrogenase (quinone) activity 2 0.054 32.9
GO:0008137 NADH dehydrogenase (ubiquinone) activity 2 0.054 32.9
GO:0016655 Oxireductose (NADH) activity 2 0.054 32.9
GO:0003954 NADH dehydrogenase activity 2 0.054 32.9
Ag; [48,49]). However, in our study, metallothioneins were not over-expressed in samples from the highly-polluted Tiber site. The European eel array developed in this study included at least 11 transcripts encoding metallothioneins, and while most of them (82%) showed a higher expression in Tiber than in Bolsena samples, differences were not statistically significant. In contrast with our study, a straightforward positive dose–response association to single pollutants for metallothioneins has been documented in experimental studies in European glass eels [32]. However, many biotic and abiotic factors can influence gene expression in nature [10], leading to
discrepancies between field and experimental studies [50]. On the other hand, examination of differences in gene expression between polluted and unpolluted popu-lations of Atlantic cod (Gadus morhua) from western Norway using gene expression profiling showed genes related to metal stress including metallothionein to be upregulated in the polluted locations [51], which con-firms early experimental results in fish (i.e. brown trout, [52]). The recent study of Milan et al. [53] on expression profiling in the Manila clam Ruditapes philippinarum reported four transcripts encoding metallothioneins over-expressed in samples from a highly polluted area.
Eel_CYP3A LYDAISIVEDDEWRRIRSVLSPCFTSGRLKEMFTIMKHHCDNLIESLQKTADSGKAAEMK 60 Zebrafish_CYP3A65 LYDAVSIAEDDDWRRIRSVLSPSFTSGRLKEMFGIMKKHSHILVDSMGKTAKRGESADIK 60 Killifish_CYP3A30 LYDAVSIAEDDQWKRIRSVLSPSFTSGRLKEMFEIMKNHSANLTRSMKKKADKDEPLDLK 60 Medaka_CYP3A40 LYDAVSIAEDDQWKRIRSVLSPSFTSGRLKEMFDIMKHHSANLTQSMKKKVDKDEPLEMK 60 Trout_CYP3A27 LFDALSVAEDDTWRRIRSVLSPSFTSGRLKEMFGIMKQHSSTLLSGMKKQADKDQTIEVK 60 Human_CYP3A4 MKSAISIAEDEEWKRLRSLLSPSFTSGKLKEMVPITAQYGDVLVRNLRREAETGKPVTLK 60 . .* * **. * *.**.*** ****.****. * . * . * Eel_CYP3A EFFGAYSMDVVASTSFSVDIDSLNNPKDPFVTNIKKMLKFSFFHPLFLLIAFFPFLGPLL 120 Zebrafish_CYP3A65 EFFGAYSMDVVTSTAFSVDIDSLNNPKDPFVTNIKKMLKFDLLNPLFLLIAFFPFMAPVL 120 Killifish_CYP3A30 EFFGSYSMDVVTSTAFSVDIDSLNNPSDPFVTNIKKMLKFDFLNPLFLAVAFFPFLGPIL 120 Medaka_CYP3A40 EYFGPYSMDVVTSTAFSVDIDSLNNPSDPFVTNIKKMLKFDFLNPLFLAVAFFPFLGPIL 120 Trout_CYP3A27 EFFGPYSMDVVTSTAFSVDIDSLNNPSDPFVSNVKKMLKFDFLNPLFLLVALFPFTGPIL 120 Human_CYP3A4 DVFGAYSMDVITSTSFGVNIDSLNNPQDPFVENTKKLLRFDFLDPFFLSTTVFPFLIPIL 120 . ** *****. ** *.*.******* **** * **.*.* *.** . *** * * Eel_CYP3A EKMELSLFPTTVTDFFYTFLQKIKSQRQI---KVHKNRVDFLQLTVDSQLHEKSVGT 174 Zebrafish_CYP3A65 EKMDFALFPTSVTDFFYAALQKIKSDRDTKTVAKDNTNEERVDFLQLMVDSQTGVKHKSD 180 Killifish_CYP3A30 EKFELSFFPKSVTDFFYASLEKIKSNREA---SQQKSRVDFLQLMIDSQKNS--- 169 Medaka_CYP3A40 EKFEFSLFPSSVMDFFFAALRKIKANHEN---NKQKSRIDFLQLMIDSQKNNQ---- 170 Trout_CYP3A27 EKMKFSFFPTAVTDFFYASLAKIKSGRDT---GNSTNRVDFLQLMIDSQKGSDTKT- 173 Human_CYP3A4 EVLNICVFPREVTNFLRKSVKRMKESRLE---DTQKHRVDFLQLMIDSQNSKE---- 170 * ** * .*. . ..* * ***** *** Eel_CYP3A QGELLKGLTDHEILSQSMMFIFAGYETSSSTLSFLAYNLATNPETMKKLQEEIDEVFPNK 234 Zebrafish_CYP3A65 GEHTEKGLSDHEILSQSMIFIFAGYETSSSTLSFLFYNLATNPETMKKLQEEIDETFPNQ 240 Killifish_CYP3A30 GAQQDKSLTDHEILSQSMIFIFAGYETSSSSLTFLAYNLATNPEVMKKLQEEIDATFPNK 229 Medaka_CYP3A40 NLGQDKGLSDHEILSQAMIFIFAGYETTSSSLTFLAYNLATNPEVMKKLQKEIDATFPNK 230 Trout_CYP3A27 GEEQTKALTDHEILSQAMIFIFAGYETSSSTMSFLAYNLATNHHVMTKLQEEIDTVFPNK 233 Human_CYP3A4 -TESHKALSDLELVAQSIIFIFAGYETTSSVLSFIMYELATHPDVQQKLQEEIDAVLPNK 229 * * * *...* . ******** ** *. *.***. *** *** ** Eel_CYP3A APMSYEPLMQMEYLG 249 Zebrafish_CYP3A65 APVDYETLMSMDYLD 255 Killifish_CYP3A30 APVHYQPLMEMEYLD 244 Medaka_CYP3A40 APVQYVPLMEMEYLD 245 Trout_CYP3A27 APIAYEALMQMDYLD 248 Human_CYP3A4 APPTYDTVLQMEYLD 244 ** * .. * **
Figure 7 Alignment of the amino acid sequence of European eel CYP3A and other vertebrate CYP3A members with high amino acid sequence similarity using the CLUSTAL_W method. Amino acids shared by all species are indicated by a stark mark and amino acids shared by all fish species by a dot mark. Putative recognition sites SRS are indicated by light shade. A gene tree was constructed using the Neighbour-Joining tree method in MEGA5. Genbank accession numbers for the sequences used are as follows: zebrafish CYP3A65, AY452279; killifish CYP3A330, AF105068; medaka CYP3A40, AF251271; rainbow trout CYP3A27, U96077; human CYP3A4, NP059488.
In the same study, up to nine GST-coding transcripts were upregulated in the polluted area.
Some of the genes over-expressed in the highly pol-luted Tiber site could be potentially used as genomic markers (biomarkers) for environmental genomics, in-cluding the European eel CYP3A gene ortholog to CYP3A65 in zebrafish, glutathione-S-transferase and glutathione peroxidase. However, it should be noted that further studies are required to confirm the adequacy of the potential biomarkers identified in our study, includ-ing a full characterization of the genes, the analysis of variation across sexes and habitats and the temporal sta-bility of their expression, in order for them to be un-equivocally used as valid biomarkers.
Pollution is associated with decreased energy production
Our results suggest that, together with the induction of detoxification genes, pollution is associated with decreased respiratory activity and energy production. Many genes involved in energy metabolism were down-regulated in samples from the highly-polluted Tiber site, including key enzymes in the mitochondrial respiratory chain and oxidative phosphorylation (Figure 4), and were grouped in a significantly enriched annotation cluster (enrichment score of 4.69). The mitochondrial respira-tory chain couples electron transfer between electron donors (NADH, succinate) and acceptors (O2) with the
transport of protons (H+ ions) from the mitochondrial matrix into the intermembrane space, which builds a proton gradient across the mitochondrial inner mem-brane that is used to generate energy in the form of ATP. The following genes were all down-regulated in tissues collected from the Tiber fish:
(1) NADH dehydrogenase. This enzyme is a component of Complex I of the mitochondrial respiratory chain that catalyzes the transfer of electrons from NADH to coenzyme Q (ubiquinone).
(2) Succinate dehydrogenase. This enzyme is part of Complex II of the mitochondrial respiratory chain that catalyzes the conversion from succinate to fumarate and passes electrons to coenzyme Q in the same fashion as NADH.
(3) Ubiquinol-cytochrome c reductase. This enzyme is part of the third complex in the electron transport chain, which catalyzes the oxidation of coenzyme Q. Electrons are sequentially transferred from coenzyme Q to complex III, and from there to cytochromec, a water-soluble electron carrier located within the intermembrane space.
(4) Cytochrome c oxidase. This enzyme is part of Complex IV of the mitochondrial respiratory chain that receives electrons from cytochromec and transfers them to oxygen, the most
electronegative and terminal electron acceptor in the chain, converting molecular oxygen to two molecules of water. In the process, it translocates four protons across the membrane, establishing a transmembrane proton gradient used by the ATP synthase to synthesize energy.
(5) ATP synthase. This enzyme is sometimes referred as Complex V of the electron transport chain. The creation of a proton gradient across the mitochondrial inner membrane is used by ATP synthase to synthesize ATP via oxidative phosphorylation, using the flow of H+to phosphorylate ADP to ATP.
In agreement with our study, experimental studies documented a decrease in expression of genes involved in the respiratory chain in response to cadmium expos-ure and hypoxia in the gills of glass eels [32].
In addition to genes involved in energy metabolism, proteins from two other gene families were downregu-lated in samples from the highly-polluted Tiber site, namely gap junction (Figure 5) and RNA polymerase (Figure 6) genes. Gap junctions are channels that con-nect the cytoplasms of adjacent cells, allowing ions and small solutes to pass between them. Among the postu-lated roles of gap junction communication are coordin-ation of activities of specific groups of cells, nutrient sharing, regulation of growth and oncogenesis [54], al-though a connection with pollution does not seem straightforward. On the other hand, the multi-subunited RNA polymerases are the main enzymes responsible for gene transcription, which is the process of creating a complementary RNA copy of a DNA sequence. Enriched nodes in our study represented subunits of RNA poly-merase II, which catalyzes the transcription of DNA to synthesize precursors of messenger RNA (mRNA) but also some non-coding RNAs. RNA expression is fre-quently used as a proxy of condition [55], as the amount of ribosomal, messenger and transfer RNAs provides in-formation on the metabolic status of the whole organ-ism. Thus, the suggested lower RNA expression in samples from the highly-polluted site points to a lower metabolic rate in this group of fish.
Conclusions
Our findings suggest that pollution affects the condition of eels from a metabolic point of view, seeing that key genes involved in respiratory activity, energy production and RNA expression are downregulated in the Tiber fish, possibly resulting in a low energetic status of the indivi-duals. Although we did not measure metabolism dir-ectly, the suggested genome-wide lowered metabolic rate and condition observed in eels at the pre-migrating stage in our study points to a poor quality of spawners that
could potentially impair both spawning migration and reproduction in the Sargasso Sea. Given that many river basins across Europe are experiencing similar levels of environmental pollution, an impoverished spawning stock could lead to a reduced reproductive success, a lowered effective population size and an impaired evolu-tionary potential.
Methods
Contigs assembly and transcripts annotation
A total of 640,040 sequence reads from various existing and novel sources were assembled into contigs, includ-ing: (1) 242,762 reads obtained by 454 FLX Titanium se-quencing of a normalised cDNA library produced from a pool of 18 glass eels (cephalic region) that constituted the first Eeelbase sequencing run [56]; (2) 300,555 add-itional reads from a second Eeelbase sequencing run using the same cDNA library; (3) 93,119 reads also obtained by 454 sequencing of a cDNA library produced from olfactory gland of adults (A. Canario, unpublished data) and (4) 3,604 reads obtained by Sanger sequencing using a mixture of adult tissues (brain, gill, intestine and kidney) [37].
Sequence reads were assembled into contigs using MIRA 3 assembler [57]. As in Coppe et al. [56] we used a double assembly approach, with the first run of hybrid assembly being used for a second local assembly to re-duce contig redundancy. Threshold values were then ap-plied to obtain the final set of contigs representing European eel transcripts: a minimum contig length of 200 nucleotides and a minimum average sequence qual-ity of 30 (Phred Scores), corresponding to an error rate of 1 per 1,000 bp.
De novo functional annotation of the European eel transcriptome was obtained by similarity using BLAST (Basic Local Alignment Search Tool) and Blast2Go [58]. Batch BLAST similarity searches for the full transcrip-tome were conducted locally against both NCBI (Na-tional Centre for Biotechnology Information) nucleotide (nt) and protein non-redundant (nr) databases using BLASTN and BLASTX, respectively. Alignments with an e-value smaller than 1E-3were considered. The Blas-t2Go suite was used for functional annotation of tran-scripts, mapping GO (Gene Ontology) terms to those transcripts with BLAST hits. In order to provide a broader overview of the ontology content, GO classes were grouped into GO-slim terms, which are cut-down versions of the GO ontologies containing a subset of GO terms, using the web tool CateGOrizer (http://www. animalgenome.org/bioinfo/tools/countgo/). The provisional annotation for microarray development was performed in Spring 2011, when the recently published eel draft gen-ome [59] was not available.
DNA microarray design
Probe design started with selection of target sequences to be included in the European eel microarray. We included all annotated sequences similar to vertebrates and invertebrates hits. Bacteria, virus, plants, fungi and protozoa were excluded. For 12,296 contigs with BLASTX hits, the putative orientation was unambiguous across hits and a single sense probe was designed. For 1,390 contigs, most with BLASTX hits and few with BLASTN hits, the putative orientation was ambiguous and two probes with opposite orientation (sense and antisense) were designed. In order to minimize assem-bler redundancy, 163 contigs differing by less than 3 nu-cleotide changes were discarded using a custom-made script to find best BLAST matches within the contig database. The final number of probes was 14,913. Probe design was carried out using the Agilent eArray Interface (https://earray.chem.agilent.com/earray/), which applies proprietary prediction algorithms to design 60-mer oli-goprobes. Microarrays were synthesized in situ using the Agilent ink-jet technology with an 8 x 15 K format (8 arrays in a single slide). Each array included default posi-tive and negaposi-tive controls. Probe sequences and other details on the microarray platform can be found in the GEO database under accession number GPL15124.
Sample collection
Samples of European eel were collected by fishermen during October 2009 in two separate areas in the Lazio region (Central Italy) characterized by different levels of environmental pollutants: the low course of the river Tiber (41°48′N; 12°25′E) and the nearby lake Bolsena (42°36′N; 11°55′E).
The river Tiber drains the largest basin in central Italy, flowing through a highly urbanised area around the city of Rome before flowing into the Tyrrhenian Sea. Our sampling area is situated 20 km from the river mouth on the lower river stretches, downstream from Rome, and shows a salinity of 0%. This section of the river contains the highest pollution level as it collects many sources of organic and inorganic contaminants, including runoffs from intensive agriculture and industry outlets, the heav-ily polluted Aniene river tributary and the city sewage outlets. Although the city runoffs are properly treated, the river still receives quantities of incompletely treated wastewater and sewage from the urban area [60,61]. On the other hand, Bolsena is a freshwater (salinity of 0%) mid-sized lake of volcanic origin, with a 113.6 km2 sur-face, a maximum length of 13.5 km and a mean depth of 81 m. The lake receives most of its water from rainfall as the hydrographic network of this area contains few waterways. Its only effluent is the river Marta, which connects the lake Bolsena to the Tyrrhenian Sea. Over-all, the lake exhibits a good environmental quality
despite a recent increase in tourism, urbanism and agriculture use. The lake is characterized by low resi-dues of organochlorine pesticides and PCBs, well below the Italian and European action levels [62].
All individuals were silver eels (adults) as determined by gonad development stage and computed Pankhurst's [63] ocular index (OI), which reflects changes in eye diameter during metamorphosis to the silver stage. At the river Tiber, all samples were males (N = 30), measur-ing 35–42 cm total length (TL) and 81–144 g body weight (BW). At lake Bolsena, samples were constituted by a mix of males (N = 9; 37–42 cm TL, 77–121 g BW) and females (N = 21; 62–92 cm TL; 358–1,333 g BW). Individuals were sacrificed immediately after collection from the field following international recognized guide-lines and according to National laws in order to minimize pain and stress. Biopsies of muscle and liver were collected for pollutants (stored at −20°C) and microarray (stored in RNALater) analyses, respectively. No analyses or experiments were conducted with live animals. The University of Padova ethic board CEASA (Comitato Etico di Ateneo per la Sperimentazione Ani-male) exempted this study from review as an extra moe-nia (in the field) activity.
Pollutants measurements and analysis
A total of 36 males were analysed for PCBs, several or-ganochlorine pesticides (OCPs) and brominated flame retardants (BFR) and nine metals. The analysis included 6 males from the low-pollution site at lake Bolsena, plus a higher number of males (N = 30) from the heavily pol-luted river Tiber site. From each individual, several sam-ples of muscle tissue from the central part of the body (10 g wet weight each; ww) were removed in order to conduct all the measurements for pollutants.
Samples were analysed for 36 different PCB congeners, including the seven congeners considered as indicator PCBs (IUPAC No. 28, 52, 101, 118, 138, 153 and 180). OCPs in this study included hexachlorobenzene (HCB), pp-DDT and its major metabolite pp-DDE. BFRs included ten PBDE congeners (No. 28, 47, 49, 66, 85, 99, 100, 153, 154 and 183) and three HBCD isomers. Finally, the levels of nine metals were determined: silver (Ag), arsenic (As), cadmium (Cd), cobalt (Co), chromium (Cr), copper (Cu), nickel (Ni), lead (Pb) and zinc (Zn).
About 1 g eel muscle tissue was homogenised with Na2SO4, spiked with internal standards (BDE 77, BDE
128, 13C-BDE 209, 13C-α-HBCD, 13C-β-HBCD and
13C-γ-HBCD), extracted by hot Soxhlet during 2 h
with hexane:acetone (3:1) and cleaned-up on acidified silica [64]. Prior to the clean-up, a fraction of the ex-tract was taken to determine the lipid content gravi-metrically. After clean-up and fractionation, PCBs, pp-DDE, pp-DDT and HCB were analysed by Gas
chromatography–mass spectrometry (GC-MS) with Electron Impact Ionization (EI), PBDEs by GC-MS with Electron-capture Negative Ionization (ECNI) and HBCDs by Liquid Chromatography- Mass Spectrometry (LC-MS). Details are described in Roosens et al. [64]. The quality control procedures included the analysis of procedural blanks, duplicate samples, and certified ma-terial SRM 1945. Obtained values were deviating <10% from the certified values and all samples were blank-corrected. Recoveries of internal standards were all above 80%, RSD < 10%. Method quantification limits (LOQs) for individual pollutants were based on proced-ural blanks (10 x SD) and the amount of sample taken for analysis (typically 1 g eel muscle). LOQs ranged be-tween 0.1 and 0.4 ng/g lipid wet weight.
Between 3 and 5 g of muscle tissue from the posterior part of the body was used for metal determination. Tis-sue samples were transferred to pre-weighted acid washed polypropylene vials and dried for 24 h at 60°C. Subsequently, the biological material was digested in a microwave oven, by adding a mixture (5:1) of nitric acid (70%) and peroxic acid (30%) [65]. Digested samples were frozen at −20°C until further analysis. Metals in muscle were analyzed using a High Resolution Induct-ively Coupled Plasma Mass Spectrometer (HR-ICP-MS). Concentrations of the metals in the muscle were calcu-lated on a dry weight basis and expressed as μg/g. All samples were analysed in batches with blanks. Analytical accuracy was determined using certified reference ma-terial of the Community Bureau of Reference, i.e. stand-ard for trace elements in mussel tissue (CRM 278). Recoveries were within 10% of the certified values.
Bioaccumulation of pollutants in individuals from the Tiber and Bolsena sites was compared with an univariate ANOVA for each pollutant separately. A Multivariate ANOVA (MANOVA) was conducted on a set of all pol-lutants combined (Sum 36 PCBs, HCB, DDE, pp-DDT, Sum 10 PBDEs, Sum 3 HBCDs and nine metals). Significance for all statistic tests was taken as p = 0.05. All statistic analyses were performed in STATISTICA v. 10.0 (Statsoft).
RNA extraction, labelling and hybridization
Gene expression analysis was carried out for a total of 23 individuals: 8 males from the highly polluted site at the river Tiber and 15 individuals from the low-pollution site at lake Bolsena, which included both males (N = 7) and females (N = 8). For each individual, total RNA was extracted from a 20–30 mg piece of liver using the RNAeasy Mini Kit (Qiagen). RNA concentration was determined using a Nanodrop ND-1000 spectrophotom-eter (NanoDrop Technologies). RNA integrity and qual-ity was estimated on an Agilent 2100 Bioanalyzer
(Agilent Technologies). Minimum RNA Integrity Num-ber (RIN) was 7.5.
Sample labelling and hybridization were carried out following the Agilent One-Color Microarray-Based Gene Expression Analysis protocol (Low Input Quick Amp Labelling). For each individual, 100 ng total RNA were linearly amplified and labelled with the fluorescent dye Cy3-dCTP. In order to monitor microarray analysis work-flow, Agilent Spike-in Mix (a mixture of 10 differ-ent viral poly-adenylated RNAs) was added to each RNA sample before amplification and labelling. Labelled cRNA was purified with Qiagen RNAeasy Mini Kit and sample concentration and Cy3 specific activity were measured using a Nanodrop ND-1000 spectrophotom-eter. A Cy3 specific activity between 8 and 17 pmol Cy3 perμg cRNA was considered adequate for hybridization. Prior to hybridization, a total of 600 ng of labelled cRNA was fragmented for 30 min at 60°C by adding 5μl 10X Blocking Agent and 1 μl Fragmentation buffer, and fi-nally diluted with 25 μl 2X GE Hybridization buffer. A volume of 40 μl was dispended into the backing slide, assembled to the microarray slide (each slide containing eight arrays) and placed in the hybridization chamber. Slides were incubated for 17 h at 65°C in an Agilent Hybridization Oven. Afterwards, slides were removed from the hybridization chamber, disassembled in GE Wash Buf-fer 1, and washed for 1 min in GE Wash BufBuf-fer 1 followed by one additional wash for 1 min in GE Wash Buffer 2.
Microarray analysis
Hybridized slides were scanned at 5μm resolution using an Agilent DNA microarray scanner. Slides were scanned at two different sensitivity levels (XDR Hi 100% and XDR Lo 10%) and the two linked images generated were analysed together. Data were extracted and back-ground subtracted using the standard procedure in Agilent Feature Extraction (FE) software v. 9.5.1. Hybridization success was evaluated using flag values, excluding those intensities not equal to 1. Normalization procedures were performed using the R statistical soft-ware (http://www.r-project.org), with Spike-In control intensities used to identify the best normalization pro-cedure. Quantile normalization always yielded better results than cyclic loess normalization and quantile-normalized data were used in all subsequent analysis. Normalized fluorescent data have been deposited in the GEO database under accession number GSE35055.
A Pearson correlation-based heatmap representation of the gene expression profile of the individuals was drawn using an unsupervised clustering approach imple-mented in R. Cluster analysis was applied to the 2,000 genes with mean expression over a value of 100 and showing the most variable expression profiles across samples according to variation coefficient.
Differentially expressed genes across samples were identified using the statistical tests implemented in the program SAM (Significance Analysis of Microarrays) re-lease 4.0 [66]. The two class unpaired test was used to identify over- and under-expressed genes between Tiber (heavily polluted) and Bolsena (lowly polluted) sites. A minimum of 1.5 fold change between groups was con-sidered. The quantitative test was used to identify a cor-relation between gene expression and individual measure of PCBs, OCPs, BFRs and metals. We applied a 5% false discovery rate for multiple testing using the q-value method presented in Storey [67].
Functional annotation analysis of differentially expressed genes between Tiber and Bolsena sites was performed using the DAVID (Database for Annotation, Visualization and Integrated Discovery) web-server v6.7 (http://david.abcc.ncifcrf.gov). Prior to the analysis in DAVID, it was necessary to link differentially expressed sequences with sequence identifiers that could be recog-nized in DAVID. To do so, a BLAST search was con-ducted for significant matches of the European eel transcripts directly against zebrafish Danio rerio Ensembl proteins using BLASTX. Danio rerio Ensembl Gene IDs were obtained from the corresponding Ensembl protein entries using the Biomart data mining tool in the Ensembl website (http://www.ensembl.org/ biomart/). Gene functional analysis in DAVID was con-ducted defining the zebrafish IDs corresponding to dif-ferentially expressed European eel transcripts as 'Gene list' and the zebrafish IDs corresponding to all genes represented in the array as 'Background'. Standard set-tings of gene count = 2 and ease = 0.1 were used. Add-itionally, a functional annotation clustering analysis was also conducted, in which genes were grouped into func-tionally related sets of genes. Minimum overall enrich-ment score for each group based on the EASE scores of each term members was set to 1.3, which is equivalent to the non-log scale of 0.05.
Competing interests
The authors declare that they have no competing interests.
Authors’ contributions
LZ and JMP conceived and designed the project, with substantial contributions from EC, GEM, MM and LB. SB and AC conceived and implemented the database and conducted all bioinformatic analyses together with JMP. CB, LB and AC conducted the analyses of pollutants. JMP, IAMM and LZ carried out the probe design. MM and IAMM carried out the microarray experiments. JMP and IAMM carried out the functional annotation analysis. JMP, LZ and GEM interpreted the data. JMP wrote the paper with contributions from GEM, LZ, SB, EC, FC, CB, LB, AC, GC, IAMM, MM, LB and TP. All authors read and approved the final version of the manuscript.
Acknowledgements
This work has been supported by a Padova University grant to LZ
(CPDA085158/08). JMP has been funded by project 2008E7KBAE. We thank A. Canario for kindly providing European eel sequences to be included in Eeelbase. We thank M. Vidotto for help in redundancy check. A. Covaci and