Dottorato di Ricerca in
Fisiopatologia e Imaging Cardio-Toraco-Vascolare
XXXII Ciclo
Coordinatore Prof. Federico Venuta
TESI DI DOTTORATO
CLINICAL IMPACT OF RIGHT VENTRICULAR DIASTOLIC
PATTERNS BY SPECKLE TRACKING ECHOCARDIOGRAPHY
IN IDIOPATHIC PULMONARY ARTERIAL HYPERTENSION
TUTOR
DOTTORANDA
Chiar.mo Prof. Carmine Dario Vizza
Dr.ssa Beatrice Pezzuto
1 INDEX
INTRODUCTION 3
1. PULMONARY HYPERTENSION 5
1.1 Physiology of pulmonary circulation 5
1.2 Pulmonary hypertension: general overview 6
1.3 Pulmonary arterial hypertension 8
1.3.1 Epidemiology and pathogenesis 8
2. THE RIGHT VENTRICLE 13
2.1 Anatomy, physiology and pathophysiology 13
2.2 Impact of pulmonary hypertension on the right ventricle and right heart failure 17
2.3 RV systolic function and RV-arterial coupling 17
2.4 Right ventricular diastolic function 21
2.5 Ventricular interaction 23
3. ROLE OF DOPPLER ECHOCARDIOGRAPHY IN THE STUDY OF PAH 25
3.1 Non-invasive assessment of the RV: standard Doppler echocardiography 26
3.2 Non-invasive estimation of pulmonary arterial pressure 28
3.3 Prognostic value of right ventricular dysfunction 30
4. DEFORMATION AND DYSSYNCHRONY OF THE RIGHT VENTRICLE 31
4.1 The concept of strain 31
4.2 Speckle tracking echocardiography 31
2
4.3 Systolic deformation and dyssynchrony of the right ventricle 33
4.4 Right ventricular strain and diastolic function 36
5. EXPERIMENTAL SECTION 37
5.1 Aim of the study 37
5.2 Methods 38
5.2.1 Population and study protocol 38
5.2.2 Right heart catheterization 38
5.2.3 Standard echocardiography 39
5.2.4 2D Speckle Tracking Ecocardiography 39
5.2.5 Statistical analysis 40
5.3 Results 42
5.3.1 2D diastolic patterns in PAH 42
5.3.2 2D diastolic patterns and RV adaptation to afterload 44
5.3.3 2D diastolic patterns and clinical worsening 47
5.4 Discussion 50
5.5 Study limitations 52
5.6 Conclusions 53
3 INTRODUCTION
Pulmonary arterial hypertension (PAH) is a rare disease characterized by an increase in pulmonary vascular resistance (PVR) due to remodeling, fibrosis and thrombosis in situ of pulmonary arterioles, with consequent pressure overload and right heart failure. PAH main clinical manifestations are reduced exercise capacity and fluid retention; in the absence of treatment, the disease inevitably evolves to death.(1)
The pathophysiological model of the disease is an afterload mismatch, thus right ventricle (RV) ability to adapt to increased afterload (RV ventricular-arterial coupling) is the main determinant of symptoms, clinical status and prognosis of affected patients.(2) It is therefore evident that RV morphological and functional status represents a fundamental target of clinical, prognostic and therapeutic evaluation in PAH patients.
Although it is well known that RV systolic adaptation to increased afterload is of main clinical importance, also the diastolic function can account for many pathophysiological and clinical aspects of the disease.
The study of RV diastolic function has been challenging for long time. The gold standard load-independent measurement by pressure-volume (PV) analysis is rather risky in PAH patients, requiring temporal preload reduction by vena cava occlusion,(3) while both right heart catheterization and noninvasive imaging techniques (echocardiography, magnetic resonance imaging - MRI) provide indirect surrogates of diastolic function that have shown to have prognostic value in many studies, but are nevertheless highly dependent on the confounding effects of increased preload and afterload, so they cannot provide insight into the intrinsic alteration of RV myocardium independently of load condition, and are therefore not always reliable in PAH patients.(3,4)
The single-beat method to determine load-independent RV diastolic stiffness avoiding vena cava occlusion has been validated in the last years,( 5 ) allowing to find clinically significant diastolic dysfunction in PAH patients, characterized by increased diastolic
4 stiffness, fibrosis and sarcomeric alterations.(5, 6 , 7 ) However, it requires complex mathematical modeling and MR imaging, which are not easy to use in routine clinical practice.
The assessment of diastolic stiffness by standard echocardiography-derived left ventricular (LV) wall strain measurements has shown in the last years promising results in patients with LV diastolic dysfunction,(8,9) suggesting strain analysis as a potential tool for noninvasive evaluation of real diastolic function. A recent study on PAH patients(10) showed that in chronic RV overload, cardiac MR-determined RV strain is associated with RV-arterial uncoupling and RV end-diastolic stiffness, suggesting it as a promising noninvasive alternative to current invasive methods for assessment of both systolic and diastolic RV function. However, it still requires MRI, which is not possible to use in all patients, not bedside and in patient’ strict follow-up.
Moreover, it is not yet well known whether RV diastolic function assessment in PAH is of added prognostic value beside traditional clinical, hemodynamic and RV systolic functional parameters.
Two-dimensional (2D) Speckle Tracking Echocardiography (STE), an ultrasonographic imaging method that allows to analyze displacement and deformation of predefined myocardial regions, overcoming the limits of M-mode and tissue Doppler imaging, as well as MRI temporal resolution limits, has gained importance for RV systolic function evaluation in the last years, allowing the evaluation of RV strain and dyssynchrony.(11,12,13) To date, the STE study of RV diastolic function has been neglected.
The aim of the work presented in this thesis is therefore to describe strain-derived RV diastolic patterns by speckle tracking echocardiography and their clinical impact in a large population of idiopathic pulmonary arterial hypertension (IPAH) patients, and to verify if the evaluation of these patterns provides additive prognostic information to traditional clinical, hemodynamic and RV systolic indices analysis.
5
1 - PULMONARY HYPERTENSION
1.1 PHYSIOLOGY OF PULMONARY CIRCULATION
The main function of the pulmonary circulation is to allow an adequate perfusion of the alveolar units for the gas exchange, and subsequent transport of oxygen to all the tissues of the organism. At this aim, the pulmonary circulation is conceived as a high-flow/low resistance system coupled with a thin-walled flow-generating chamber, the right ventricle, which is relatively unable to tolerate afterload increases.
The normal pulmonary artery pressure has a systolic peak of 18-25 mmHg, a telediastolic value of 6-10 mmHg and an average value between 12 and 16 mmHg. The normal mean pulmonary venous pressure is 6-10 mmHg, therefore the flow pressure through the pulmonary vascular bed fluctuates between 2 and 10 mmHg.(14) This small pressure gradient is sufficient to ensure the passage of the entire cardiac output through the pulmonary circulation; this is made possible by the low resistance to flow offered by the pulmonary vessels themselves, equal to about one fifth of the systemic circulation. In physiological conditions, increases in blood flow do not significantly change pulmonary arterial pressure: this indicates that pulmonary vascular resistance can further be reduced in response to increases in cardiac output, first due to the recruitment of new vessels, subsequently to distension of pulmonary vessels.
These hemodynamic characteristics are due to the anatomical structure of the pulmonary circulation. The wall of the large-sized pulmonary arteries is made up of smooth muscle cells that are inserted directly on short elastic fibers, therefore these arteries are particularly suitable for stretching when stressed by an increase in transmural tension. The small muscular arteries are instead responsible for the local regulation of the vascular tone: the terminal branches of these vessels have a larger caliber and have a thinner wall than the corresponding systemic arteries. Normally the contribution of pulmonary capillaries to
6 vascular resistance is minimal, but, due to the narrow anatomical relationships between capillary and alveolus, an increase in alveolar volume may cause a reduction in the capillary diameter.(15)
Endothelial cells play a major role in maintaining these anatomical and functional characteristics. Indeed, they are an important source of vasoconstrictor factors (endothelin 1-ET-1 and thromboxane A2) and vasodilators (nitric oxide-NO and prostacyclin), which also act as mitotic and antimitotic agents, respectively. The physiological characteristics of the pulmonary circulation (low resistance, high flow) are due to the prevailing of vasodilating/ antimitogenic factors over vasoconstrictors/mitogens.(14,15,16)
Regardless of the responsible mechanisms, maintaining a low resistance in the pulmonary circulation is necessary to prevent overloading of the right ventricle, whose anatomical and functional characteristics allow a good adaptation to volume, but not to pressure overload; in this last situation it rapidly goes towards a contractile insufficiency.(17)
1.2 PULMONARY HYPERTENSION: GENERAL OVERVIEW
According to current guidelines, pulmonary hypertension (PH) is defined as a hemodynamic and pathophysiological condition characterized by a mean pulmonary arterial pressure (mPAP) value ≥ 25 mmHg at rest, measured by right heart catheterization. It may occur during several diseases of cardiorespiratory origin, but it can also be related to immune, viral or iatrogenic diseases (appetite suppressant drugs).(18)
The prognosis is still related above all to the ability of the cardiovascular system to respond to the increased pressure in pulmonary circulation, and in particular to the ability of the right ventricle to maintain functional integrity in the face of increased afterload.(19)
In 1998, the World Health Organization proposed a new classification of pulmonary hypertension, based on the different pathophysiological mechanisms involving the pulmonary vascular district in the various forms of the pathology.(20) This classification was
7 subsequently updated in Venice in 2003, in Dana Point in 2008 and in Nice in 2013; a last update has been finally proposed in Nice in 2018, with mild modification.(21)
The current classification groups the pathologies associated to PH considering the pathogenetic and histopathological analogies of the various diseases. The importance of this nosographic classification consists in recognizing a common pathogenetic and prognostic pathway and the same therapeutic approach in the pathologies included in the same group. According the current guidelines (Table 1),(18) referring to Nice 2013, the different types of pulmonary hypertension can be divided into five groups based on the pathogenic mechanisms:
• Pulmonary arterial hypertension, which includes idiopathic and hereditary forms, and those associated with other pathological conditions, such as connective tissue diseases, portal hypertension, HIV infection or congenital heart disease with pulmonary hyperflow, assumption of appetite suppressant drugs, schistosomiasis; two subgroups have been added to this group: 1 'for pulmonary veno-occlusive disease and pulmonary capillary hemangiomatosis, and 1' 'for persistent pulmonary hypertension of the newborn.
• Venous pulmonary hypertension, in which the increase in pulmonary pressure has as primum movens an increase in pulmonary vein pressure or in the left atrium. This group includes pulmonary hypertension associated to pathologies of the left heart and pulmonary hypertension associated with extrinsic compressions of the pulmonary veins.
• Pulmonary hypertension associated with lung diseases and/or hypoxia.
• Pulmonary hypertension secondary to thromboembolism or other obstruction of the pulmonary arteries.
• Pulmonary hypertension secondary to rare diseases that directly involve the pulmonary circulation with mechanisms that are not yet clear or multifactorial (hematological diseases such as chronic hemolytic anemia, systemic diseases such as sarcoidosis or neurofibromatosis, metabolic diseases such as Gaucher disease, etc.).
8 From a purely hemodynamic point of view, moreover, PH can be distinguished in precapillary forms, defined by a pulmonary capillary wedge pressure (WP) ≤ 15 mmHg (Groups 1, 3 and 4), and post-capillary forms, with WP> 15 mmHg (Group 2).(18)
1.3 PULMONARY ARTERIAL HYPERTENSION
Pulmonary arterial hypertension (PAH, Group 1 of classification) is defined as a clinical condition characterized by the presence of pre-capillary pulmonary hypertension, with pulmonary vascular resistance > 3 WU, in the absence of other known causes of precapillary pulmonary hypertension, like pneumopathies or chronic thromboembolism. PAH includes different forms (idiopathic or associated with other pathological conditions), presenting a similar clinical picture and virtually identical pathological changes of pulmonary arterial microcirculation, and represents the most severe form of pre-capillary pulmonary hypertension together with PH secondary to chronic thromboembolism (CTEPH, chronic thromboembolic pulmonary hypertension).(18)
1.3.1 Epidemiology and pathogenesis
Idiopathic pulmonary arterial hypertension (IPAH) is a rare disease, having an incidence of about 2 cases per million inhabitants, and is the most severe form of pulmonary arterial hypertension.
A familiarity can be found in about 7-10% of cases; the most frequently involved alterations concern genes encoding receptors for the TGF-β family (BMPR2, whose heterozygous mutation has been identified in 75% of familial cases and up to 25% of apparently sporadic cases,(22,23) ALK-1,(24) endoglin, BMPR1B and SMAD9,(22) while rare mutations have been found in genes encoding proteins such as caveolin 1 and potassium channels (KCNK3).(22,25) The average age of onset of the disease is around 30-40 years, but it can also occur in elderly and pediatric subjects; female is most affected sex.
9 In the "associated" forms, pulmonary arterial hypertension presents different prevalence depending on the underlying disease. It is found in about 5% of patients with CREST variant of scleroderma, while in HIV and portal hypertension PAH prevalence is around 0.5-1%. The prevalence of the disease is lower in patients who have used appetite suppressant drugs, with 1 case per 10000-17000 subjects, depending on the duration of exposure to the substance (aminorex, fenfluramine, dexfenfluramine).(18) These epidemiological observations allow us to identify a series of very different "associated" factors, which reflect an increased risk of developing pulmonary arterial hypertension, but which are not certain etiological factors. We are probably faced with a complex multifactorial syndrome (Figure 1), in which there is a genetic predisposition that confers a particular pulmonary vascular reactivity to several kind of stimuli. The most accredited pathogenetic hypothesis predicts, in fact, that various factors (viruses, toxins, autoimmune phenomena, neuro-endocrine substances, etc.), acting on a genetically predisposed soil, can cause an endothelial lesion with a breakdown of the balance between vasodilators/antimitogens factors and vasoconstrictor/mitogenic factors in favor of the latter.(1)
Figure 1. Pathogenetic hypothesis of pulmonary arterial hypertension.
10 A vicious circle would therefore be triggered, characterized by vasoconstriction, myointimal proliferation and activation of the coagulation system, leading to the development of characteristic lesions of the disease (Figure 2):(26)
• hypertrophy of the media;
• hypertrophy of the intima, sometimes with laminar proliferation wand with the possible association of fibrosis or fibrinoid necrosis phenomena;
• plexiform lesions (angiomatous formations originating from the muscular arteries, often completely obstructed by the intimate lesions already described);
• in situ thrombosis.
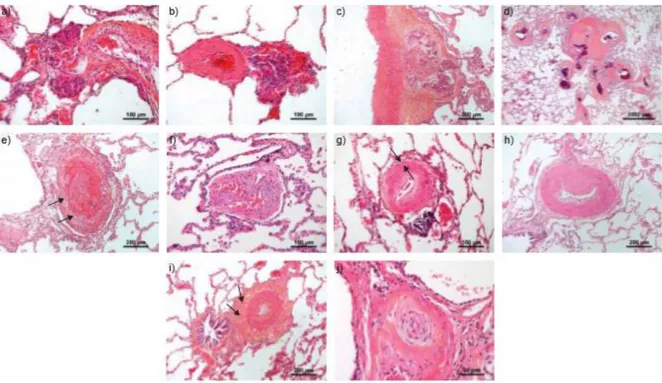
Figure 2. Characteristic arteriolar lesions of pulmonary arterial hypertension: a-c) Plexiform lesions; d) Atypical fibrovascular lesions; e)
Recent thrombotic lesion; f) Fully organized thrombotic lesion; g) Concentric, non-laminar fibrosis of the intima; g) Eccentric fibrosis of the intima; h) Hyperplasia of the media and collagen-riche fibrosis of the adventitia (arrows); i) Concentric laminar fibrosis of the intima (onion-skin lesions) (from Humbert et al, Eur Respir J 2019;53:1801887).(26)
11 From a clinical point of view, PAH is a syndrome whose main manifestations are dyspnea and right heart failure. In the early stages of the disease, the right ventricle tends to adapt to the increased afterload (ventricular-arterial coupling) by increasing contractility without or with a minimum increase in the right heart size, although an inadequate ventricular-arterial coupling may cause a reduction in aerobic exercise capacity even in the early stages of the disease, limiting the maximum cardiac output. In the more advanced stages, the RV systolic function fails to remain coupled to increased afterload and a progressive right heart dilation develops. In addition, diastolic dysfunction occurs due to myocardial fibrosis and sarcomeric stiffening. All these changes lead to a reduction in the right ventricular output, an increase in the right ventricular filling pressures and a reduced left ventricular (LV) filling, with a subsequent reduction in systemic pressure and an altered ventricular systolic interaction. Such pathophysiological alterations account for PAH typical effort dyspnea and venous congestion.(2,27,28,29)
The prognosis of IPAH patients is poor in the short term, with a five-year survival of approximately 40%. In associated forms, the presence of pulmonary arterial hypertension represents a negative prognostic factor regardless of the underlying pathology. Lung transplantation represented, until the 1990s, the only alternative for patients who did not respond to traditional therapy (digitalis, diuretics, anticoagulants, and Ca-antagonists in the indicated cases). In the last two decades, specific drugs have become available (prostanoids, endothelin receptor antagonists, phosphodiesterase-5 inhibitors, soluble guanylate cyclase agonists, selective prostacyclin receptor agonists) that have radically changed the approach to pathology and awakened the clinician's interest.
12
Table 1. Diagnostic classification of pulmonary hypertension (from Galiè et al, Eur Heart J 2016; 37:67-119).(18)
LEGEND - BMPR2: bone morphogenetic protein receptor, type 2; EIF2AK4: eukaryotic translation initiation factor 2 alpha kinase 4; HIV: human immunodeficiency virus.
13 2 - THE RIGHT VENTRICLE
2.1 ANATOMY, PHYSIOLOGY AND PATHOPHISIOLOGY
In mammals and birds the RV is a thin-walled flow generator designed to allow the entire systemic venous return to undergo gas exchange in the pulmonary circulation, which is a separate high-flow, low-pressure system.(30)
In the second century Galen described the RV as a simple conduit through which part of the blood reached the lungs to provide nourishment, while the remaining part of blood passed into the left ventricle through invisible pores of the interventricular septum, to form the "vital spirit ".(31)
In the thirteenth century, Ibn Nafis challenged the existence of the pores in the septum, stating for the first time that all the blood had to pass through the lungs to pass from the RV to the LV.(31,32) Ibn Nafis also believed that RV function was to thin the blood to make it suitable for mixing with the air in the lungs.
It was only in 1616 that Sir William Harvey described for the first time the real function of the right ventricle in his treatise De Motu Cordis, stating: "It may be said that the right ventricle is made for the sake of the lungs, and for the transmission of blood through them, not for their nutrition".(33,34)
In the following centuries, the emphasis that cardiology put on the study of left ventricular physiology led to overlook the study of right ventricular function. This neglection was probably due to both the conception of the RV as a simple passive conduit transferring blood from the venous system to the LV, and to RV geometric conformation, not allowing, especially in the past, an adequate and exhaustive morphological study.
In the 40s of the twentieth century, some researchers hypothesized that human circulation could have functioned adequately without the contribution of right ventricular contraction. Their studies, however, were based on a so-called open model of dog pericardium, and omitted to consider the complex nature of ventricular interaction.(35,36)
14 Between the 50s and 70s, instead, numerous heart surgeons, performing palliative procedures to obviate hypoplastic right heart, finally recognized the importance of RV function.(37,38)
In 2006, the National Heart, Lung and Blood Institute set the study of the physiology of the right ventricle as a priority of cardiovascular research.(39) Thus, in more recent years, the importance of RV has also been recognized in heart failure, in the myocardial infarction of the right ventricle, in congenital heart disease as well as, obviously, in pulmonary hypertension. Furthermore, the progress achieved in echocardiography and magnetic resonance imaging provided new tools the study of right heart chambers’ anatomy and physiology.(40)
The RV is placed anteriorly to the LV, just behind the sternum. As already stated, it has a complex geometry, roughly having the shape of a pyramid, triangular when viewed from the side and crescent shaped when viewed in cross section with the interventricular septum, which is a main determinant of the shape. In fact, under normal loading and electrical conditions, the septum is concave toward the LV in both systole and diastole.(34)
The RV can be described in terms of 3 anatomical components, presenting different embryological origin and delimited by the supraventricular crest: (1) the inlet, which consists of the tricuspid valve, chordae tendineae, and papillary muscles, (2) the trabeculated apical myocardium, and (3) the infundibulum, or conus, which corresponds to the smooth myocardial outflow region. RV mass is approximately one sixth that of the LV, with thinner walls and a higher surface-to-volume ratio. In the RV, muscle fibers are mainly longitudinally aligned from LV apex to tricuspid ring, and arranged in continuity with the LV musculature, for this reason RV contraction pattern is mainly longitudinal.(34)
Thanks to its shape and structure, the RV is an easily dilatable chamber with an internal volume comparatively inferior to the endocardial surface.
15 perfusion to the organs, depends on three key factors: the contractile state of myocardial tissue, the pre-load, which represents the initial distension of cardiac myocytes before contraction, and the after-load, defined as the load against which the heart have to allow the systolic expulsion of the blood.(34)
Furthermore, right ventricular performance is directly influenced by the functional state of the left ventricle due to the phenomenon of ventricular interaction. In fact, about one third of the force generated in the RV is determined by the contraction of the LV.(41)
Right ventricular contraction is strongly conditioned by the increase in after-load, being able to maintain an adequate cardiac output for a rather limited range of pulmonary vascular resistance. On the contrary, it can better tolerate volumetric overload, which alters ventricular geometry, but does not affect the ejection pattern.(42)
The particular hemodynamic involvement of the right heart has direct implications on the phases of the RV cardiac cycle. In fact, normally the low end-diastolic pressure in the pulmonary artery is quickly overcome by the pressure rise in RV during systole, with a very short and often absent isovolumetric contraction time.(34) The isovolumetric relaxation phase (IVRT) is also generally very short or absent, probably due to the high capacitance of the pulmonary circulation, which at the end of the right injection, despite the drop in pressure in the RV until the closure of the pulmonary valve, maintains the ejection of the blood preserving its momentum.(34) Therefore, a measurable IVRT interval can be considered an indicator of increased RV filling pressures.
Intrinsic contractile dysfunction, changes in loading conditions beyond the physiological limits, as well as an altered LV performance, can have negative effects on RV function. There are many possible mechanisms leading to progressive right ventricular dysfunction (Figure 3), including myocardial ischemia or infarction. Arrhythmogenic cardiomyopathy (ARVC) may also be associated with a global and regional reduction in RV performance.(42) Acute pressure overload, which occurs during pulmonary embolism, can determine acute
16 RV failure with dramatic clinical consequences, given its poor ability to tolerate such condition.
Chronic overload, on the other hand, produces an increase in right myocardial mass (hypertrophy) and a modification of the chamber geometry that temporarily reduces wall stress, but in the long term leads to right ventricular dysfunction.(42) Volume overload is a better tolerated condition, but if sustained over time it can ultimately lead to RV failure.
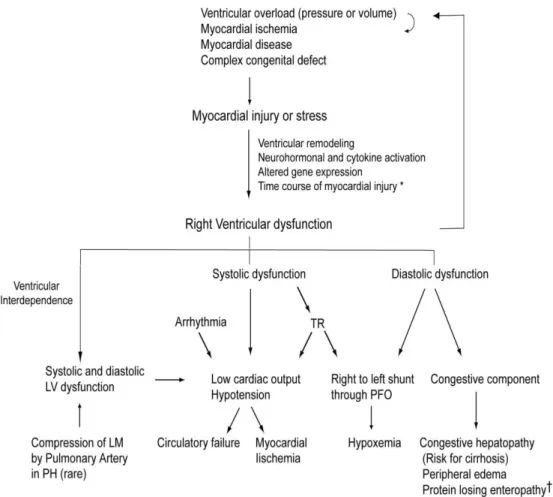
Figure 3. Scheme of the pathophysiological mechanisms of right ventricular dysfunction (form Haddad et al, Circulation
2008;117:1717-31).(42)
LEGEND - LM: left main coronary artery; LV: left ventricle; PFO: patent foramen ovale; PH: pulmonary hypertension; TR: tricuspid regurgitation.
17 2.2 IMPACT OF PULMONARY HYPERTENSION ON THE RIGHT VENTRICLE AND RIGHT HEART FAILURE
The structure of the RV is not adequate to cope with a sudden increase in pulmonary vascular resistance, such as in massive acute pulmonary embolism,(43) while in case of chronic increase, such as PAH, the RV is able to adapt to the progressive increase in PVR by increasing contractility and remodeling, with mechanisms similar to those of the LV.(44) Sustained changes in load are associated with a homeometric contractility adaptation described by Anrep’s law of the heart.(45) The homeometric adaptation is associated to the development of myocardial hypertrophy, which increases contractile strength and reduces wall tension. However, if the pressure overload is too high or too prolonged, homeometric adaptation is no longer sufficient, and the heterometric adaptation of Starling comes into play, at the cost of an increase in RV volume and filling pressures.(45) This pathophysiological mechanism explains the characteristic clinical picture of PAH: in fact, right heart failure can be defined as a dyspnea-fatigue syndrome with eventual systemic congestion, caused by the inability of the RV to maintain adequate cardiac output using Anrep's homeometric adaptation, in response to metabolic demand, without the use of Starling’s heterometric adaptation.(44) In this definition, cardiac output is not necessarily low but is low relative to oxygen uptake or aerobic exercise capacity, and vascular congestion is implicit.(27)
2.3 RV SYSTOLIC FUNCTION AND VENTRICULAR-ARTERIAL COUPLING
Right ventricular function is a crucial aspect of the pathophysiology of PAH, but its study cannot prescind from RV in relation to the after-load against which it has to work. Hence, the key concept of ventricular-arterial coupling, or a measure of the adequacy of cardiac and vascular function coupling.
18 The gold-standard measurement of cardiac contractility in vivo, and therefore for the evaluation of the ventricular function independently of the pre-load, is the maximal elastance (Emax), or the maximum value of the ratio of ventricular pressure to volume during the cardiac cycle.(44) In the left ventricle the Emax coincides with the tele-systole (end-systolic elastance or Ees) and is therefore equal to the ratio between end-systolic pressure (ESP) and end-systolic volume (ESV) (ESPVR: end systolic pressure-volume relationship). The Ees is measured at the upper left corner of a square-shaped pressure-volume loop; this angle represents the point where the cardiac cycle (ejective heartbeat) corresponds to the tension-length relationship (in a hypothetical non ejective cycle).(46) Because of the low pulmonary vascular impedance, the normal RV pressure-volume loop has a triangular shape, and Emax occurs before the end of ejection, or end systole. However, afterload increased in PAH changes the shape of RV pressure-volume curve (which tends to assume a quadrangular aspect as in the LV), therefore the Emax is closer to the peak systolic pressure (Figures 4-6).
Figure 4. Normal triangular-shaped RV
pressure-volume curve, in which maximum elastance (Ees, point A) occurs before the end of systole (form Naeije R, Pulm Circ 2014;4:395-406)(28)
Figure 5. Family of pressure-volume curves of a
subject with idiopathic pulmonary arterial hypertension (from Naeije R, Eur Respir Rev 2014;23:476-487)(27)
19 A satisfactory measurement of Emax for both ventricles may be obtained from the generation of a family of pressure-volume curves created with progressively decreasing venous returns (via progressive occlusion of the inferior vena cava with a balloon), as shown in Figures 5 -7.(47)
Since the realization of pressure-volume curves, requiring invasive assessments, is difficult to perform at the patient's bedside, if not contraindicated, the single-beat method was developed, initially for the LV,(48) but later also for RV evaluation.(49) This method assumes that the ESPVR is the same in ejective and isovolumic heartbeats, and that maximum pressure of an isovolumic beat (Pmax, ie the pressure that the ventricle would generate during a non-ejective beat at the end-diastolic volume) may be extrapolated from normal ejective beats. As for the RV, therefore, Pmax is calculated from a non-linear extrapolation of the early and late portions (isovolumic portions) of RV pressure curve, an integration of pulmonary flow or a direct measurement of RV volume curve, and
Figure 7. Schematic representation of the
Ees/Ea relationship in a family of pressure-volume curves.
Figure 6. Family of RV pressure-volume curves obtained by
progressively reducing venous return; ESPVR (end-systolic pressure-volume relationship) and EDPVR (end-diastolic pressure-volume relationship) define RV systolic and diastolic function (from Maughan WL et al, Circ Res 1979;44:309-315).(47)
20 synchronization of the signals. The Emax is estimated by the slope of a straight line tangent from Pmax to the pressure-volume curve (Figure 8). An animal model showed an excellent correspondence between the calculated Pmax and the measured Pmax directly clamping the trunk of the pulmonary artery for a heartbeat.(49)
On the other side, the afterload can be measured as maximum wall tension, integration of forces opposing ventricular ejection or hydraulic load, and as arterial elastance (Ea). Ea is defined as the relationship between Emax pressure and stroke volume (SV). The interesting aspect of the Ea is that it corresponds to the hydraulic load faced by the RV, and it can be calculated together with the Emax on the same pressure-volume curve. In other words, it represents the RV afterload perceived by the same right ventricle (Figures 7-8).
Therefore, the afterload-corrected contractility is defined by Emax/Ea ratio, and the ideal mechanical coupling between RV and pulmonary arterial system is defined by an Emax/Ea ratio of 1.5-2.(45)
However, the single-beat method requires invasive RV pressure curve measurement and RV volume measurement by cardiac MR, not always available in daily clinical practice. Therefore, several methods have been recently developed for the simplified calculation of
Figure 8. Pressure-volume relationship illustrating the concepts of ventricular elastance (Ees), arterial elastance (Es) and maximum isovolumic pressure used to estimate Ees with the single-beat method (form Vonk-Noordegraaf A et al, JACC 2013;62(25 Suppl):D22-33).(2)
21 right ventricular-arterial coupling; an example is given by the formula: Emax/Ea = (ESP/ESV)/(ESP/SV) = SV/ESV, which we have already used in a previous study.(50)
2.4 RIGHT VENTRICULAR DIASTOLIC FUNCTION
Even though systolic function adaptation to afterload is central to the occurrence of RV failure signs and symptoms in PAH, diastolic function changes must also be taken into consideration. Indeed, RV diastolic dysfunction impairs RV filling and increases diastolic RV and right atrial pressures, leading to fluid retention and systemic congestion. Thus, the study of both systolic and diastolic RV ventricular functions is required to fully understand the physiopathology and the clinical aspects of the disease.
Diastolic dysfunction is characterized by altered filling patterns, prolonged relaxation, and intrinsic diastolic stiffness, and it can be attributed to several contributing factors, such as RV overload impairing per se RV diastolic relaxation, hypertrophy and fibrosis, reducing RV compliance and filling, as well as changes in RV sarcomeres.
In practice, a large number of parameters has been used to describe RV diastolic function in PAH. Right atrial pressure (or RV end-diastolic pressure) is probably the parameter that has been most related to outcome in PAH.(51) It can be measured directly during right heart catheterization, thus requiring invasive measurement, or estimated noninvasively by echocardiographic assessment of inferior vena cava diameter and collapsibility. Echocardiography is able to provide many other measurements of diastolic function, including RV Doppler-derived filling profiles (isovolumic relaxation time, transtricuspid E/A waves ratio or tricuspid annulus tissue Doppler E’/A’ waves); relaxation-phase indices (dP/dt minimum and the time constant of isovolumic pressure decay); increased right atrial or RV surface areas on apical four-chamber views; RV end-diastolic volume (which can be more accurately evaluated by cardiac MRI); altered LV eccentricity index on a parasternal short axis view; estimates of RAP from RV diastolic function indices (annular tricuspid E/E’
22 ratio, annular TDI relaxation time), pericardial effusion; Tei index (ratio of isovolumic time intervals to ventricular ejection time, integrating diastolic and systolic function).(52,53)
Several studies have demonstrated the prognostic value of these measurements.(54,55,56) However, all these parameters provide information only on relaxation velocities and filling, andare all highly dependent on loading condition, so they cannot provide any information on true RV diastolic function. For these reasons, they can be considered only as indirect or surrogate markers of RV diastole.
RV diastolic function can be described in load-independent manner by a diastolic elastance (Eed) curve determined by a family of pressure-volume loops at variable loading (Figure 6).(47) The diastolic pressure-volume relationship is curvilinear, thus the straight line approach as a description is not sufficiently accurate. Several formulas have been proposed, and the most adequate description is obtained by fitting the relation with an exponential curve through the diastolic pressure-volume points, with the formula P=α(eβV−1), where α and β are curve-fitting constants.(30, 57 ) As for systolic function description,(49) to avoid building multiple pressure-volume loops by partial vena cava occlusion, which is not safe in PAH patients, a single-beat method has been developed to determine Eed.(5) The latter now can be calculated as Eed=αβeβVed, where Ved is the end-diastolic volume (EDV). By this method, RV end-diastolic stiffness was found to be significantly increased in PAH patients, and histological analysis found important contributions from increased collagen and intrinsic stiffening of the RV cardiomyocyte sarcomeres, reduced titin and troponin I (cTnI) phosphorylation, increased titin stiffness, and altered levels of phosphorylation of Ca2+-handling proteins.(5,6) The so-defined diastolic stiffness predicts outcome in PAH as well as the more complex β calculation, and it is closely associated with disease severity and clinical progression,(7) but also with Ees.(5) Moreover, recent studies have shown a significant association between single-beat Eed and ventilatory efficiency measured at CPET,(58) between RV single-beat stiffness and MRI-derived strain parameters
23 of the RV,(10) and between RV single-beat stiffness and significant backward flow in the vena cava, which is a well-recognized clinical hallmark of right ventricular failure, measured at MRI in PAH patients.(59)
More recently, there are been other attempts to measure RV stiffness by imaging technique, like the echocardiographic index of RV operating stiffness using atrial-systolic descent of the pulmonary artery-RV pressure gradient derived from pulmonary regurgitant velocity (PRPGDAC) and tricuspid annular plane movement during atrial contraction (TAPMAC); however it has been evaluated in a population of patients with various cardiac diseases, and it still requires invasive measurement of RV end-diastolic pressure and RV pressure increase during atrial contraction.( 60 ) Another study conducted on a small population of pediatric PAH patients showed, compared to controls, higher stiffness/elastic recoil and inferior cross-bridge relaxation measured by the kinematic model-based parameters obtained from the transtricuspid E-wave.( 61 ) The limit of these echocardiographic evaluations is the use of complex derived measurement which are susceptible of imprecision and highly operator dependent, so often inaccurate and poorly reliable.
2.5 VENTRICULAR INTERACTION
Finally, both systolic and diastolic RV function also have to be understood in the context of its direct and indirect interactions with LV function, as ventricular interdependence plays an essential part in the pathophysiology of RV dysfunction.(27)
Direct interaction, or ventricular interdependence, is defined as the forces that are transmitted from one ventricle to the other through the myocardium and pericardium, independent of neural, humoral or circulatory effects.(41)
Diastolic ventricular interaction refers to the competition for space within the nondistensible pericardium when the RV dilates, altering LV filling and possibly causing inadequate cardiac
24 output response to metabolic demand. Right heart catheterization and imaging studies have shown that in severe PH patients, mPAP and LV peak filling rate are altered in proportion to decreased RV ejection fraction.(62)
Systolic interaction refers to positive interaction between RV and LV contractions. It can be shown experimentally that aortic constriction, and enhanced LV contraction, markedly improves RV function in animals with pulmonary arterial banding.(63) Similarly, in electrically isolated ventricular preparations in the otherwise intact dog heart, LV contraction contributes a significant amount (about 30%) to both RV contraction and pulmonary flow.(64) This is explained by a mechanical entrainment effect, but also by LV systolic function determining systemic blood pressure, which is an essential determinant of RV coronary perfusion. Increased RV filling pressures and excessive decrease in blood pressure may be a cause of RV ischaemia and decreased contractility.
An additional cause of negative ventricular interaction is regional dyssynchrony and inter-ventricular asynchrony with post-systolic contraction or ‘‘shortening’’, which has been shown to develop in parallel with increased PAP and contributes to altered RV systolic function and LV under-filling.(65,11,12)
25 3. ROLE OF DOPPLER ECHOCARDIOGRAPHY IN THE STUDY OF PULMONARY ARTERIAL HYPERTENSION
Although hemodynamic invasive study of the pulmonary circulation by right heart catheterization represents the gold standard for the diagnosis of PH, and it is still fundamental for patient evaluation during follow-up, noninvasive imaging plays a key role in both the diagnosis and management of PH patients, allowing the evaluation not only of the pulmonary pressures, but also of the cardiopulmonary unit function.(66) Echocardiography, magnetic resonance imaging (MRI), computed tomography, and positron emission tomography (PET) have a complementary role in the diagnosis of PH, but also in identifying prognostic factors able to support clinicians in treatment decision-making in PAH patients. MRI has emerged as the gold standard for quantifying volumes, function, and flow in the right side of the heart. However, echocardiography is the mainstay in the assessment of hemodynamic and ventricular function in PH, thanks to the practicality of use in all patients, including bedside and in the strict follow-up.
The fields of application of Doppler echocardiography in pulmonary hypertension are several and include:
- diagnosis and screening of populations with clinical suspicion of PH; - functional assessment of the right ventricle;
- evaluation of concomitant cardiac alterations, such as the presence of congenital heart disease, valvular heart disease or cardiomyopathies, possibly responsible of the elevated pulmonary artery pressure;
26 3.1 NON-INVASIVE ASSESSMENT OF THE RIGHT VENTRICLE: STANDARD DOPPLER ECHOCARDIOGRAPHY
Mono and two-dimensional echocardiography can provide both morphological and functional measurements of the right ventricle. M-mode is commonly used to estimate RV dimensions, the thickness of the free wall, its excursions and wall thickening; Doppler analysis provides measures of systolic function in the outflow tract and diastolic function in the transtricuspid inflow.
From a qualitative point of view, RV dimensions can be better defined if it is considered anatomically distinct in two portions, a body (from the tricuspid to the apex) and an outflow tract (located anteriorly and medially), recognizable in the parasternal short-axis view on the great vessels.(67)
In the parasternal short-axis view, the systolic and diastolic eccentricity indices of the left ventricle (LV-EIs and LV-EId, respectively) provide a datum of fundamental importance, also concerning the bi-ventricular interaction. They are defined as the ratio of the antero-posterior diameter to the septum-lateral one measured both in systole and in diastole. In normal individuals this dimensional ratio corresponds to unity, being the cross-section of the left ventricle approximately circular. This view also allows to identify the presence and the degree of the paradoxical interventricular septal motion, which develops when the normal gradient of end-diastolic pressure between the two ventricles is reversed.
The 4-chamber apical view represents a fundamental approach to assess RV size and function. In this window a simple and quick way to appreciate RV dimensions is the visual comparison with the LV.
The study of the RV in the subcostal approach, necessary in patients with poor acoustic windows (such as in the presence of chronic obstructive pulmonary disease), provides additional information associated with visualization of the inferior vena cava (diameter and
27 respiratory collapsibility).
An integrated approach is always recommended in the various views to obtain a complete study, especially in the evaluation of patients with pulmonary hypertension.
The methods of quantitative evaluation of RV indices of systolic function, in particular of the ejection fraction (EF), present several problems due to the anatomical and functional characteristics of the RV.(68) Given the difficulties in finding an optimal approach for the calculation of the volumes and ejection fraction, some simple mono and bidimensional parameters have been introduced, that have been able to predict RV systolic function in clinical studies. Right ventricular fractional area change (RVFAC), measured with the formula: RVFAC = (RVEDA - RVESA) / RVEDA x 100 (where RVEDA = right ventricular end diastolic area, RVESA = right ventricular end systolic area), has shown a good correlation with RVEF measured by CMR.(69)
The excursion of the tricuspid ring during systole (TAPSE - tricuspid anular plane systolic excursion) reflects the systolic base-apex shortening of the RV, which can be determined by two-dimensional echocardiography, but also with simple M-mode by measuring the excursion of the lateral wall of the tricuspid ring. TAPSE is a practical, accurate and reproducible index that correlates with the RVEF measured by radionuclide angiography.(70) Doppler analysis of RV outflow, which can be performed in the so-called great vessels parasternal view, allows the recording of RV systolic velocity profile by placing pulsed Doppler sample volume, guided by the color signal, immediately above the pulmonary valve. In this way it is possible to measure the peak systolic velocity (m/s), the velocity-time integral (m) and the systolic outflow times of the RV: the pre-ejection period (R-PEI), from the beginning of the QRS complex of the reference ECG trace at the beginning of the Doppler signal of the systolic outflow; the acceleration time (AT), from the beginning to the peak of the systolic ejection; the ejection time (ET), from the beginning to the end of the ejection (all in ms).
28 The Doppler of the right inflow, like transmitral Doppler, measures the flow velocities through the tricuspid valve and reflects the pressure gradients leading RV filling during diastole. Measurements are recorded in the apical 4-chamber view: E and A peak velocity (m/s), E/A ratio, E deceleration time (ms). More than the transmitral pattern, the transtricuspid flow rates are influenced by breathing, with an increase in E and the E/A ratio and shortening of the deceleration time during inspiration.
Tissue Doppler echocardiography is able to provide further indices of RV function. The RV systolic excursion velocity, or S’, is a simple and reproducible method to assess RV free wall function; it is performed in apical 4-chamber window by placing the pulsed Doppler sample volume in either the tricuspid annulus or the middle of the basal RV free wall, and a value < 10 cm/s should raise the suspicion for abnormal RV systolic function.(71) Miocardial acceleration during isovolumic contraction (RV IVA) is defined as the peak isovolumic myocardial velocity divided by time to peak velocity and it is measured at the lateral tricuspid annulus, and it has been demonstrated to correlate with the severity of the disease in many condition affecting right heart function.(71) The tricuspid E/E’ ratio represents an index of RV diastolic function.(71)
3.2 NON-INVASIVE ESTIMATION OF PULMONARY ARTERIAL PRESSURE The rationale of the PAP Doppler estimate lies in the following factors:
1 - the frequency variation of the Doppler signal reflected by the moving red blood cells, allowing the acquisition of the maximum instantaneous velocity through the valve orifices, from which it is possible to derive the pressure gradient between cardiac chambers (Bernoulli equation);
2 - the maximum instantaneous velocities of the tricuspid regurgitation jet and of the pulmonary diastolic regurgitation jet, which accurately reflect the maximum pressure gradients between RV and right atrium, and between RV and pulmonary artery;
29 3 - the possibility to derive the value of the systolic and diastolic PAP (sPAP and dPAP, respectively) by adding the respective pressure gradients to right atrial pressure (RAP), whose value can be estimated by evaluating diameter and respiratory collapsibility of the inferior vena cava in the subcostal view, in the portion of the vase closest to the entrance of the right atrium; the measurement of the caval diameter is performed during a normal respiration, and the percentage caliber variation is determined in the inspiratory phase compared to expiration.
sPAP corresponds approximately to RV systolic pressure in the absence of pulmonary artery stenosis and obstruction of RV outflow tract, and it can therefore be measured with techniques for RV pressure estimation.
RV pressure is obtained by adding mean RAP to the peak of the systolic pressure gradient between the RV and the right atrium, calculated as 4V2 according to the simplified Bernoulli equation, where V represents the value of the systolic peak velocity of tricuspid regurgitation at the continuous wave Doppler.(71)
dPAP is calculated by adding the right atrial pressure values to the diastolic pressure gradient between the pulmonary artery and the RV.(71)
Mean PAP is the average PAP value during the cardiac cycle. Since the systole is shorter than diastole, the mPAP is slightly lower than the arithmetic mean between sPAP and dPAP. It can be determined by integrating the area of the pressure curve. In practice, it is possible to obtain a measurement of mPAP by deriving it from the sPAP and dPAP.(71) Alternatively, mPAP can be calculated by measuring the protodiastolic flow rate of pulmonary regurgitation and the corresponding pressure gradient. The protodiastolic pressure gradient between pulmonary artery and RV correlates well with mPAP.(71)
To obtain an echocardiographic quantitative estimate of sPAP, the presence of tricuspid regurgitation is indispensable. The velocity of normal tricuspid regurgitation is up to 2.8 m/s, higher values indicate the possibility of pulmonary hypertension, pulmonary stenosis or
30 obstruction of ventricular outflow. It should be kept in mind that in patients with pre-existing right ventricular dysfunction, with pulmonary hypertension or biventricular insufficiency, a decrease in tricuspid regurgitation velocity indicates a worsening in RV systolic dysfunction, thus representing a very important negative prognostic factor.
The prevalence of tricuspid regurgitation increases with increasing PAP. Unfortunately, not all patients presenting tricuspid regurgitation have a flow profile suitable for performing all measurements, due to the presence of factors limiting the accurate visualization of the profile, such as disease severity, obesity and concomitant lung diseases.
3.3 PROGNOSTIC VALUE OF RIGHT VENTRICULAR DYSFUNCTION
In the natural history of pulmonary hypertension, it is not the increase in pulmonary pressure, but the reduction in cardiac output that determines clinical deterioration. Although the increase in pulmonary vascular resistance is the cause of the pathology, it is indeed RV dysfunction that leads affected patients to death, in fact mPAP value has only a modest prognostic significance.(18)
The prognostic role of standard echocardiographic evaluation of structural changes and of direct or indirect indices of right ventricular function is therefore evident.
Raymond et al(72) demonstrated that, in addition to the NYHA functional class and the reduction in exercise tolerance, the presence of pericardial effusion, right atrial dilation and eccentricity index are important prognostic factors for survival of PH patients.
Given the importance of the longitudinal fibers in RV systolic function, TAPSE has shown an independent and incremental prognostic power: in a study conducted by Forfia et al,(73) a cut-off value ≤ 18 mm was significantly associated with a worse prognosis in a population of PAH patients. Subsequent studies have recognized a prognostic value to right heart dimensions,(74) RV estimated diastolic pressure,(75) maximum velocity during isovolumic contraction (IVV)(76) and dP/dT.(79)
31 4. DEFORMATION AND DYSSYNCHRONY OF THE RIGHT VENTRICLE
4.1 THE CONCEPT OF STRAIN
The strain is the deformation of an object compared to its original size and is expressed as a percentage.
For one-dimensional objects, with only one possible deformation (for example elongation and shortening), the physical definition of strain (S) is the relative variation in length of the object compared to its original length: S = L - L0 / L0, where L is the length of the object after the deformation and L0 its original length.(77)
The strain rate (SR) is the velocity at which the deformation occurs (S) and is expressed in 1 / s: SR = (L - L0 / L0) / T, where T is the time.(77)
The regional strain curve represents the deformation of a given myocardial segment during the entire cardiac cycle. The S / SR parameters are negative when the studied myocardial segment shortens (longitudinal function) or thins (radial function), while they are positive when the studied myocardial segment lengthens (longitudinal function) or thickens (radial function).(77)
Myocardial strain and strain rate can be evaluated by tissue Doppler imaging (TDI), magnetic resonance imaging (MRI) and speckle tracking echocardiography (STE).
4.2 SPECKLE TRACKING ECHOCARDIOGRAPHY
It is a new approach to evaluate RV segmental systolic function, overcoming the technical limitations of tissue Doppler imaging,(78) since it measures myocardial strain regardless of the angle of incidence, as well as magnetic resonance temporal resolution limits. This method has been validated by sonomicrometry and MR.(79)
The literal meaning refers to a system that follows the "speckles" during the cardiac cycle. The speckles are the white and black dots that make up the "texture" of the two-dimensional ultrasound image. Placed in a completely random way, they are the result of the interaction
32 of ultrasound with myocardial tissue.(77)
The principle is not new, in fact the "speckles" could already be followed with the M-Mode technique, deriving their displacement, velocity (both more marked at the base than at the apex) and even the deformation (obviously only along the single-beam line of M-mode echocardiography). This was possible because the M-mode technique has a very high temporal resolution. Today speckles, instead of in a single line, can be recognized in an entire region (the so-called Kernel) and followed throughout the cardiac cycle. This is possible thanks to modern technologies that allow to obtain two-dimensional images with high temporal resolution (of the order of 80-90 frames per second).(77)
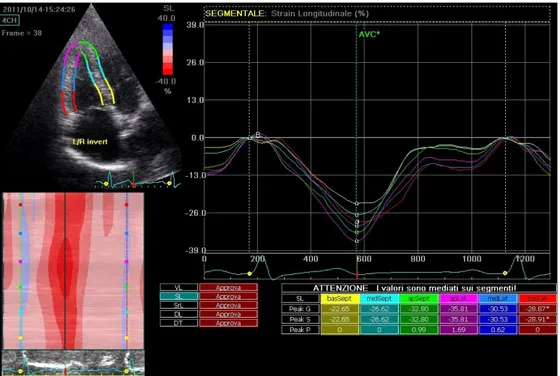
Once the different regions have been recognized, displacement, displacement velocity, deformation (two contiguous regions approaching or moving away from each other) and the deformation velocity can be calculated (Figure 9) .
The clinical utility of this method has already been established in patients with heart failure undergoing electrical resynchronization treatment.(80)
33 4.3 SYSTOLIC DEFORMATION AND DYSSYNCHRONY OF THE RIGHT VENTRICLE Concerning the applications on the right ventricle of echocardiographic methods allowing the valuation of myocardial strain, some studies have shown a good correlation between longitudinal strain measured at tissue Doppler and RV stroke volume at right heart catheterization, and a significant reduction of longitudinal strain in patients with high pulmonary arterial pressures compared to normal controls.(81) Compared to the common indices of right ventricular function, such as TAPSE and RVFAC, longitudinal strain could provide an added value, since it offers quantitative data on the real regional function of the whole RV free wall.
Also speckle tracking echocardiography (STE) has been used for the study of right ventricular myocardial deformation, and preliminary studies have shown that it is able to provide results with good correlation with the other RV function indices measured at echocardiography and MRI.(82) In more recent years, a study confirmed the reliability and feasibility of a three-dimensional (3D) STE compared to MRI to assess RV volume, RV ejection fraction and the contribution of regional RV function to global function.(83)
Speckle tracking echocardiography, compared to the tissue Doppler, besides being independent from insonation angle and not conditioned by the movement of the adjacent segments, has proved to be feasible and highly reproducible even in highly dilated and remodeled ventricles.(77) However, it has a lower temporal resolution and a strong dependence on image quality and therefore on the acoustic window.
The method is applied to images recorded in the apical 4-chamber view, mainly allowing the study of the inflow portion of the RV, which is responsible for 85% of the stroke volume.(84) In fact, the major determinant of RV pump function is the shortening of the longitudinal fibers that are particularly expressed on its free wall.
Meris et al( 85 ) conducted a study on a large number of patients, demonstrating the feasibility of analyzing RV systolic deformation by speckle tracking echocardiography, both
34 in healthy subjects and in subjects suffering from cardiac pathologies, including pulmonary hypertension. The study documented a good correlation between global longitudinal strain and traditional right ventricular systolic function indices. In particular, a global longitudinal strain cut-off of 19% can non-invasively distinguish normal subjects from those with RV systolic dysfunction.
Another interesting work, published by Borges et al,(86) reported the results of a study conducted on 37 patients with pulmonary hypertension, evaluating the parameters of systolic function and deformation of baseline RV and after 1-year therapy with the endothelin receptor antagonist Bosentan, demonstrating an improvement of the invasive hemodynamic parameters and of RV longitudinal strain.
More recent larger studies have demonstrated that RV longitudinal strain in combination with N-terminal pro-brain natriuretic peptide and NYHA functional class provides good discrimination of outcome in PAH.(87,88)
A particularly interesting aspect of STE is the possibility to study RV timing of contraction and to evaluate RV regional contractility. The anomalies in RV regional performance are a sensitive measure of its functional status; by influencing chronic pressure overload specifically on regional motility, this pathological condition contributes to the onset of intraventricular dyssynchrony with significant impact on the overloaded ventricle: an incoordinated contraction, in fact, especially in the longitudinal direction, contributes to further reduce RV systolic function.
Preliminary data had suggested the existence of a mechanical contraction delay, calculated by tissue Doppler,(89) between the interventricular septum and the free wall of RV in patients with pulmonary hypertension. However, the first studies conducted on the evaluation of intra- and interventricular dyssynchrony were heterogeneous in number and population characteristics, thus leading to conflicting results. In fact, while Schwartz et al(90) have demonstrated that the peak of free wall systolic activation at TDI is anticipated with
35 respect to the septum in PAH patients compared to healthy controls, López-Candalez(91) reported a delay in the systolic peak at TDI in affected subjects compared to the control group, on a larger but more heterogeneous sample. The data reported by Kalogeropulos et al( 92 ) agreed with López-Candalez: using STE they have demonstrated a delayed deformation peak of the free wall with respect to the septum and a dyssynchrony index (evaluated as standard deviation of activation of the 6 RV segments) higher in affected subjects than in healthy controls. Furthermore, a study conducted by Marcus et al(65) with cardiac tagged MR confirms the delay of RV free wall, in terms not of systolic activation but rather of time at the deformation peak.
A fundamental contribution to the study of RV dyssynchrony has been provided in the last years by our group,(11,12,13) which analyzed a larger and more homogeneous population than the previous studies, allowing to evaluate a pure model of afterload mismatch, and defining RV dissynchrony as the standard deviation of time to peak systolic strain of the 4 RV mid-basal segments (thus eliminating the apical segments, that cause heterogeneity in the results even in healthy subjects). We have shown in a first study that in patients with idiopathic PAH with narrow QRS, RV dyssynchrony is associated with RV dilation and eccentric hypertrophy, suggesting a role of segmental wall stress heterogeneity as a major determinant of mechanical delay.(11) Our study also showed that post-systolic shortening contributes to pump dysfunction as an inefficient contraction.(11) In a second work we demonstrated that, in a population with idiopathic, inherited and appetite suppressant associated PAH, RV dyssynchrony is an independent prognostic factor and can reverse in case of significant reduction in PVR during specific therapy.(12) A subsequent study demonstrated that a comprehensive echocardiography with speckle tracking-derived assessment of the heterogeneity of RV contraction improves the prediction of aerobic exercise capacity in IPAH, and could even explain the reduced effort tolerance sometimes found in PAH patients with preserved traditional indices of RV function.(13) Finally, a more
36 recent study on a small group of healthy subjects demonstrated that RV contraction is inhomogeneous in hypoxia but not during exercise;(93) both conditions are characterized by mild increase in pulmonary pressure, since PAP increases more during exercise, RV dyssynchrony in hypoxia may be explained by a combination of mechanical (RV afterload) and systemic (hypoxia) factors, suggesting further insight to explain RV dyssynchrony found in patients with borderline PH.(94)
4.4 RIGHT VENTRICULAR STRAIN AND DIASTOLIC FUNCTION
Speckle tracking has been also applied to the evaluation of diastolic function in the left ventricle: global myocardial peak diastolic strain (Ds) and diastolic strain rate (DSr) at the time of E and isovolumic relaxation combined with E (E/Ds and E/10 DSr) have been recently proposed as novel indices to determine LV filling pressure,(95) and strain-derived indices at STE resulted as better predictors of LV end-diastolic pressure compared with TDI in patients with preserved ejection fraction.(96)
Nevertheless, to date, systolic strain and dyssynchrony for the study of RV systolic function are the only application of STE to the RV, while the evaluation of diastolic function by this echocardiography method and in general by strain indices has always been neglected. However, a recent study by Tello and colleagues(10) has shown for the first time a significant association between cardiac MRI-derived RV strain parameters and the pressure-volume loop-derived parameters Ees/Ea, Ea, and Eed. RV strain assessed by the novel method of cardiac MR feature tracking was significantly associated with diastolic stiffness (Eed) and afterload (pulmonary arterial stiffness and Ea), suggesting cardiac MR RV strain as a promising indicator of RV-arterial uncoupling and RV diastolic stiffness.
These results should trigger to apply STE analysis of RV strain to the evaluation of RV diastolic function, profiting of the advantage of ST over MRI in terms of temporal resolution and convenience of routine use.
37 5 - EXPERIMENTAL SECTION
5.1 AIM OF THE STUDY
Pulmonary arterial hypertension (PAH) is a severe disease characterized by a progressive elevation of pulmonary vascular resistance (PVR), ultimately resulting in right ventricular (RV) dilation and systolic dysfunction leading to heart failure and death.(1)
The pathophysiological model of the disease is an afterload mismatch, thus prognosis depends on the ability of the RV to maintain its function in face of increased afterload, underscoring the importance of RV function assessment in clinical practice.(2)
Although it is well known that RV systolic adaptation to increased afterload is of main clinical importance, in the last years there has been a focus on the RV diastolic function in PAH.
The study of RV diastolic function has always been rather difficult, as invasive hemodynamic evaluation and imaging studies provide only indirect, highly load-dependent surrogates measurements of RV diastolic function,(27) the gold standard load-independent measurement by pressure-volume analysis, able to measure RV diastolic stiffness, is too risky in PAH patients because it requires load modifications by vena cava occlusion,(47) while single-beat pressure-volume analysis, though safer, requires invasive measurement and RMI study, not applicable in routine evaluation and not in all patients.(49)
Two-dimensional (2D) Speckle Tracking Echocardiography (STE) has gained importance for RV systolic function evaluation in the last years, allowing the evaluation of RV strain and dyssynchrony,(11,12,13) but STE study of RV diastolic function has been neglected.
The aim of this thesis is therefore to describe strain-derived right ventricular diastolic patterns by speckle tracking echocardiography and their clinical impact in a large population of idiopathic pulmonary arterial hypertension (IPAH) patients.
38 5.2 METHODS
5.2.1 Population and study protocol
The initial study population included 118 consecutive IPAH patients referred to our Center. Diagnosis of IPAH had been made according to European guidelines.(18) Nine patients with suboptimal echocardiographic images were excluded from all subsequent analyses. Thus, the study group consisted of 108 patients.
Baseline evaluation included medical history, physical examination, a non-encouraged 6-minute walk test (6MWT), right heart catheterization (RHC) and the echocardiographic assessment.
Patients treatment was based on the severity of PAH, in accordance to European guidelines.(18). All patients were prospectively followed-up for 24 months with phone calls (every month) and clinical examinations (every 1-3 months) for the presence of clinical worsening (CW), defined as hospitalization for congestive heart failure or death. The first episode of CW was taken into consideration for the analysis.
All patients were included in the study protocol after informed consent. The protocol was approved by the Institutional Review Board for human studies of the Policlinico Umberto I -Sapienza University of Rome.
5.2.2 Right Heart Catheterization
Hemodynamic evaluation was made with standard technique: patients underwent right heart catheterization with a Swan-Ganz triple-lumen thermodilution catheter, in the supine position, with zero calibration at the center of the thorax and detection of pressure at the end of exhalation. Measurements performed included mean pulmonary artery pressure (mPAP), wedge pressure (WP), right atrial pressure (RAP) and cardiac output (CO). Pulmonary vascular resistance (RVP) was calculated with the formula (mPAP - WP) / CO.