Spectroscopic evidence of in-gap states at the SrTiO
3/ LaAlO
3ultrathin
interfaces
G. Drera,1F. Banfi,1F. Federici Canova,1P. Borghetti,1L. Sangaletti,1,a兲 F. Bondino,2 E. Magnano,2J. Huijben,3M. Huijben,3G. Rijnders,3D. H. A. Blank,3H. Hilgenkamp,3and A. Brinkman3
1Dipartimento di Matematica e Fisica, Universitá Cattolica, Via dei Musei 41, 25121 Brescia, Italy 2IOM-CNR, Laboratorio TASC, S.S.14, Km. 163.5, I-34149 Basovizza, Italy
3
Faculty of Science and Technology and MESA⫹Institute for Nanotechnology, University of Twente, 7500 AE Enschede, The Netherlands
共Received 19 August 2010; accepted 22 December 2010; published online 2 February 2011兲 Experimental evidence of differences in the electronic properties of an insulating and a conducting SrTiO3/LaAlO3interface is provided by soft x-ray spectroscopies. While core level photoemission measurements show that only at the conducting interface Ti ions with 3+ ionization state are present, by using resonant photoemission and x-ray absorption spectroscopies, it is shown that in both samples in-gap states with a Ti 3d character are present, but their density is higher at the conducting interface. © 2011 American Institute of Physics.关doi:10.1063/1.3549177兴
Evidence of a conducting interface between the band insulators SrTiO3共STO兲 and LaAlO3共LAO兲1has opened up the possibility of using complex oxide materials in two-dimensional electron gas applications. The initially reported large carrier mobility1 turned out to be caused by oxygen vacancies effectively donating charge to the STO, not being related to the interface per se.2–4 Still, when taking care to avoid oxygen vacancies, the metallic conductivity remains and, from a number of experiments, it has become clear that the conductivity is really confined at the interface. Strong evidence for the latter is provided by the substrate termina-tion dependence of the conductivity,1 the interlayer spacing dependence of coupled interfaces,5 the abrupt onset of con-ductivity above a critical LAO thickness of 4 unit cells,6and conducting atomic force microscopy across cleaved samples.7The mechanism causing the interface conductivity is believed to be charge transfer from the LAO surface to the STO side of the interface to prevent the electrical potential from diverging due to the polar nature of LAO.8This elec-tronic reconstruction picture is supported by ab initio calculations.9–12 Recent theoretical investigations have also explored the possibility that the incorporation of oxygen va-cancies at the LAO surface can be driven by the polar nature of the underlying LAO.13
So far, the electronic structure of LAO/STO heterointer-face has been mainly probed by hard x-ray photoemission spectroscopy14,15 and x-ray absorption spectroscopy.16 Ti3+ states have been detected in core level hard x-ray photoemis-sion by Sing et al.14 and a Ti 3dxy orbital occupation was
observed by x-ray absorption linear dichroism.16 However, the soft x-ray photoemission measurements reported by Yoshimatsu et al.15have not revealed any Ti3+. Furthermore, no spectroscopic evidence of in-gap states or conduction electrons at the LAO/STO interface has been so far reported, preventing any investigation on the nature of the charge car-ries confined at the heterojunction.
In this letter, by matching the results of x-ray core level photoemission and resonant photoemission spectroscopies, we show that Ti3+is present in a conducting sample of 5 unit cells LAO on STO, at a larger extent than in the insulating sample of 3 unit cells LAO on STO. Furthermore, we pro-vide an experimental epro-vidence of in-gap states at the LAO/ STO interface and, from the analysis of constant initial state 共CIS兲 photoemission profiles, a Ti 3d character is ascribed to these in-gap states.
The present samples have been grown, respectively, by depositing 3 and 5 unit cells 共u.c.兲 of LAO on TiO2 termi-nated STO substrates. The growth by pulsed laser deposition has been performed at 850 ° C. Attention has been paid to grow the two samples at the same oxygen partial pressure 共1.2⫻10−3 mbar兲 to exclude differences in the extrinsic in-clusion of oxygen vacancies. The sample with 3 u.c. of LAO is found to be insulating, the two-point resistance at room temperature being larger than 100 M⍀. The sample with 5 u.c. of LAO is found to be metallic with a four-point resis-tance at room temperature of the order of a few kilo-Ohms over a distance of a few millimeters. Unlike previous syn-chrotron radiation studies,15no additional doping was intro-duced to increase the conductivity and quench possible charging effects due to the high photon fluxes. Furthermore, by engineering the samples so as to have very shallow insu-lating interfaces 共3 u.c.兲 and a shallow metallic interface 共5 u.c.兲, we have been able to use conventional x-ray sources and soft x rays to probe the interface layers. The estimated photoelectron escape depth⬃ein the present experiment is
comparable to the thickness of the LAO layer for both samples 共as is shown in Ref.17兲.
X-ray photoemission 共XPS兲 spectra were collected at a base pressure of 2⫻10−10 mbar by using a twin anode 共Al K␣ and Mg K␣兲 x-ray source and a VG-Scienta R3000 spectrometer, Box 15120, 750 15 Uppsala, Sweden. Reso-nant photoemission 共RESPES兲 and x-ray absorption spectra 共XAS兲 across the Ti L-edge have been collected at the BACH beamline of the Elettra synchrotron in Trieste共Italy兲. In Fig.1 共left panel兲, the Ti 2p XPS core lines of the 5
u.c. sample 共dots兲 and the 3 u.c. sample 共line兲 are shown
a兲Author to whom correspondence should be addressed. Electronic mail: sangalet.at.dmf.unicatt.it.
APPLIED PHYSICS LETTERS 98, 052907共2011兲
0003-6951/2011/98共5兲/052907/3/$30.00 98, 052907-1 © 2011 American Institute of Physics
together to single out differences between the Ti 2p spectral weight of these interfaces. The 5 u.c. sample spectrum is normalized to match the Ti 2p3/2 intensity of the 3 u.c. XPS spectrum. In both spectra, two peaks are detectable, which are ascribed to the Ti 2p3/2and Ti 2p1/2spin-orbit split com-ponents. The Ti 2p3/2 core lines have the same full width at half maximum linewidth on both samples 共1.4 eV兲. Such narrow linewidths are comparable to those measured on rutile single crystals, indicating a highly stoichiometric envi-ronment for the Ti ion. These peaks are indicative of Ti in a +4 ionization state. A shoulder on the low binding energy side of the Ti 2p peaks is present in the 5 u.c. sample 共con-sistent with Ref.14兲, while it is missing on the 3 u.c. one, as
is shown in detail in the right panel of Fig.1. When contami-nations are excluded, as in the present case for the buried interface capped by the LAO overlayer, this shoulder is usu-ally ascribed to Ti3+ions and is also present in oxygen defi-cient TiO2rutile layers, where oxygen vacancies are known
to reduce Ti ions.18 The Ti valence reduction could both be related to oxygen defects, as well as to electronic reconstruc-tion. However, because of the similar deposition conditions and the fact that no Ti 3+ signature is detected in the case of the insulating three-layer sample, extrinsic oxygen defects seem to be an unlikely cause.
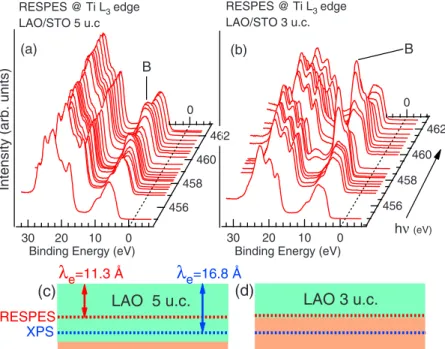
The occupied electronic states in the valence band have been studied by RESPES with photon energies across the Ti L3-edge, as recently done in the case of TiO2rutile.19The RESPES spectra 共Fig. 2兲 show a resonant behavior of the
peak at BE= 6 eV 共marked as B in both RESPES set of data兲, which is usually ascribed to Ti states hybridizing with O-states in the valence band.20 The resonance is largest for the 3 u.c. sample 关Fig.2共b兲兴, where the Ti is closer to the surface than for the 5 u.c. sample.
The RESPES also reveals in-gap electronic states 共marked as A in Fig. 3兲. The analysis of these states is
ac-complished by examining two spectra collected with a pho-ton energy of 457 eV, as shown in Fig. 3. Apparently, the in-gap states have the same weight in both samples.
How-Intensity
(arb.
units)
464 460 456
Binding Energy [eV] 5 u.c. 3 u.c. 460 458 456 5 u.c. 3 u.c. (b) (a) Ti 2p XPS (Mg kαline) Ti 2p 3/2 Ti 2p 1/2
FIG. 1.共Color online兲 Left panel: Ti 2p XPS core level spectra of the 5 u.c. sample共dots兲 and the 3 u.c. sample 共line兲. Right panel: detailed view of the Ti 2p3/2main line region. The spectrum of the 3 u.c. sample关共a兲 crosses兴 has been fit with a Voigt function关共a兲 line兴. The Voigt profile is reported below the data from the 5 u.c. sample关共b兲 filled circles兴.
RESPES @ Ti L3edge LAO/STO 5 u.c RESPES @ Ti L3edge LAO/STO 3 u.c. (a) (b) (c)
λ
e (d) =16.8 Åλ
e=11.3 Å B B hν(eV) 30 20 10 0Binding Energy (eV)
462 460 458 456
30 20 10 0
Binding Energy (eV)
462 460 458 456 Intensity (arb. units ) 0 0
LAO 5 u.c. LAO 3 u.c.
STO STO
XPS RESPES
FIG. 2.共Color online兲 Top panel: RESPES spectra col-lected at the Ti L3edge from the共a兲 5 u.c. sample and from the 共b兲 3 u.c. sample. Bottom panel: schematic representation of the calculated electron escape depth e 共Ref. 17兲 for electrons photoemitted from the Ti
2p3/2core level共dashed line, XPS, h= 1256.6 eV,e
= 16.8 Å兲 and from the valence band 共dashed line, RE-SPES, h= 457 eV,e= 11.3 Å兲; 共c兲 and 共d兲 refer to 5
and 3 u.c. samples, respectively.
Intensity
(arb.
units
)
-30 -20 -10 0
Binding Energy (eV)
5 u.c. 3 u.c. 2 1 0 -1 -2 5 u.c. 3 u.c. A B A -
-FIG. 3. 共Color online兲 Valence band spectra of the 3 共dashed line兲 and 5 u.c. 共line兲 samples collected at a photon energy of 457 eV. The inset show the in-gap states for both samples.
052907-2 Drera et al. Appl. Phys. Lett. 98, 052907共2011兲
ever, because of the thicker LAO overlayer in the 5 u.c. sample, the effective density of the in-gap states is largest for the conducting 5 u.c. sample. The excess of in-gap electronic states is consistent with the Ti3+ states found in XPS Ti 2p core level data of the 5 u.c. sample 共Fig.1兲. If we assume
that the only difference between the two samples is the thick-ness of the LAO overlayer, the attenuation of the signal based on the estimated efor electrons with 457 eV kinetic
energy would give an I共A兲3u.c./I共A兲5u.c.= 1.97 ratio between the intensities I of the A peaks of the two samples. Thus, as the measured intensities appear to be the same, the density of in-gap states for the 5 u.c. sample results to be 1.97 times that of the 3 u.c. sample.
Finally, in Fig. 4, we analyze the CIS spectra for the in-gap states 共A feature兲, as well as for the most resonating feature at BE= 6 eV共B feature兲. The Ti L3-edge XAS spec-trum 共Fig. 4, thick line兲 is in agreement to those already
reported for a set of LAO/STO interfaces.16 The peak at 458.2 eV is ascribed to t2g states arising from crystal field splitting, while the broad peak at 460.6 eV is ascribed to eg
states. As can be observed for both samples, the CIS spectra of the B feature follow the intensity of the Ti L3-edge XAS 共only the XAS for the 5 u.c. sample is shown, the other being quite similar兲 in agreement with their origin from Ti4+ elec-tronic states in the valence band. In turn, the CIS spectrum of the A band shows a different behavior, with a quenching of the intensity below the t2g peak and a shift toward lower photon energies of the egband. In spite of the weaker signal
with respect to the CIS spectrum extracted form peak B, the CIS profiles of peak A show a higher intensity where the most intense XAS bands of a Ti+3 ion are found 关see, e.g., the Ti L3 edge of LaTiO3 共Fig. 4, triangles; adapted from Ref.16兲兴. This adds further evidence that a 3d1character can be ascribed to the in-gap states.
In conclusion, a clear signature of in-gap states in the photoemission spectra collected from LAO/STO heterojunc-tions is provided. An effect of titanium reduction to Ti3+ is detected in the core level data of the conducting 5 u.c. sample alone, but in-gap states are detected in both samples through RESPES experiments. Both samples have been grown under the same conditions, ruling out differences in the extrinsic oxygen vacancy concentration between the
in-sulating and the conducting samples. This should give the same density of in-gap states related to the oxygen vacan-cies. However, when the signal attenuation through the two different LAO overlayers is accounted for, an excess of in-gap states is found in the metallic 5 u.c. sample with respect to the insulating 3 u.c. sample共about 2:1 ratio兲. We rational-ize our findings in terms of excess conducting electrons in the 5 u.c. sample, consistent with electronic reconstruction models.8
This work is part of the research program of the Foun-dation for Fundamental Research on Matter 共FOM兲, finan-cially supported by the Netherlands Organization for Scien-tific Research 共NWO兲 and the NanoNed program.
1A. Ohtomo and H. Y. Hwang,Nature共London兲 427, 423共2004兲. 2W. Siemons, G. Koster, H. Yamamoto, W. A. Harrison, G. Lucovsky, T. H.
Geballe, D. H. A. Blank, and M. R. Beasley,Phys. Rev. Lett. 98, 196802 共2007兲.
3G. Herranz, M. Basletic, M. Bibes, C. Carretero, E. Tafra, E. Jacquet, K. Bouzehouane, C. Deranlot, A. Hamzic, J.-M. Broto, A. Barthelemy, and A. Fert,Phys. Rev. Lett. 98, 216803共2007兲.
4A. Kalabukhov, R. Gunnarsson, J. Borjesson, E. Olsson, T. Claeson, and D. Winkler,Phys. Rev. B 75, 121404共R兲 共2007兲.
5M. Huijben, G. Rijnders, D. H. A. Blank, S. Bals, S. Van Aert, J. Verbeeck, G. Van Tendeloo, A. Brinkman, and H. Hilgenkamp,Nature Mater. 5, 556 共2006兲.
6S. Thiel, G. Hammerl, A. Schmehl, C. W. Schneider, and J. Mannhart, Science 313, 1942共2006兲.
7M. Basletic, J. L. Maurice, C. Carretero, G. Herranz, O. Copie, M. Bibes, E. Jacquet, K. Bouzehouane, S. Fusil, and A. Barthelemy,Nature Mater.
7, 621共2008兲.
8N. Nakagawa, H. Hwang, and D. Muller,Nature Mater. 5, 204共2006兲. 9R. Pentcheva and W. E. Pickett,J. Phys.: Condens. Matter 22, 043001
共2010兲.
10R. Pentcheva and W. Pickett,Phys. Rev. B 74, 035112共2006兲. 11Z. Zhong and P. J. Kelly,Europhys. Lett. 84, 27001共2008兲. 12S. Ishibashi and K. Terakura,J. Phys. Soc. Jpn. 77, 104706共2008兲. 13Y. Li, N. Phattalung, S. Limpijumnong, and J. Yu, e-print
arXiv:0912.4805; Y. Li and J. Yu,J. Appl. Phys. 108, 013701共2010兲.
14M. Sing, G. Berner, K. Goß, A. Müller, A. Ruff, A. Wetscherek, S. Thiel, J. Mannhart, S. A. Pauli, C. W. Schneider, P. R. Willmott, M. Gorgoi, F. Schäfers, and R. Claessen,Phys. Rev. Lett. 102, 176805共2009兲.
15K. Yoshimatsu, R. Yasuhara, H. Kumigashira, and M. Oshima,Phys. Rev. Lett. 101, 026802共2008兲.
16M. Salluzzo, J. C. Cezar, N. B. Brookes, V. Bisogni, G. M. De Luca, C. Richter, S. Thiel, J. Mannhart, M. Huijben, A. Brinkman, G. Rijnders, and G. Ghiringhelli,Phys. Rev. Lett. 102, 166804共2009兲.
17The electron escape depth at different kinetic energies was estimated by using the model developed by S. Tanuma, C. J. Powell, and D. R. Penn, Surf. Interface Anal. 21, 165共1994兲; Assuming a bulk density for LAO of 6.41 g/cm3and a unit cell thickness d
u.c.= 3.811 Å, the following inelas-tic mean free paths ehave been estimated: 20.3 and 16.8 Å for Ti 2p
electrons excited by the Al K␣and Mg K␣x-ray lines, respectively, and 11.3 Å for photoelectrons from low-lying valence band states excited with h= 457 eV photons. Independently, we have also estimated e from
angle resolved XPS data. Ti 2p3/2XPS core line intensities I3u.c.共兲 and I5u.c.共兲 were collected with an Al K␣x-ray source, on the 3 and 5 u.c. sample, respectively, for several take-off angles, measured with respect to the surface normal. Then, the escape depthewas obtained from the
best fit of I5u.c.共兲/I3u.c.共兲=exp关−共5du.c.− 3du.c.兲/共ecos兲兴, which
re-sulted in a e= 19, 32⫾2 Å best fit value, in good agreement with the
model predictions.
18U. Diebold,Surf. Sci. Rep. 48, 53共2003兲.
19G. Drera, M. C. Mozzati, P. Galinetto, Y. Diaz-Fernandez, L. Malavasi, F. Bondino, M. Malvestuto, and L. Sangaletti,Appl. Phys. Lett. 97, 012506 共2010兲.
20K. C. Prince, V. R. Danak, P. Finetti, J. F. Walsh, R. Davis, C. A. Muryn, H. S. Dhariwal, G. Thornton, and G. van der Laan,Phys. Rev. B55, 9520 共1997兲. Intensity (arb. units) 462 460 458 456
Photon Energy (eV) 3 u.c. CIS peak A
3 u.c. CIS peak B XAS Ti L3edge
5 u.c. CIS peak A 5 u.c. CIS peak B LaTiO3
t2g eg
FIG. 4.共Color online兲 XAS of the 5 u.c. sample 共thick line兲 and of LaTiO3 共adapted form Ref.16, triangles兲. CIS profile of the A and B features for the 3 u.c. sample共empty and filled diamonds, respectively兲. CIS profile of the A and B features for the 5 u.c. sample共empty and filled circles, respectively兲.
052907-3 Drera et al. Appl. Phys. Lett. 98, 052907共2011兲