“ICT investment, productivity and efficiency: evidence at firm level using a
stochastic frontier approach”
L
EONARDOB
ECCHETTI, D
AVIDA
NDRESL
ONDONOB
EDOYAAND
L
UIGIP
AGANETTOCEIS Tor Vergata - Research Paper Series, Vol. 10, No. 29 August 2003
This paper can be downloaded without charge from the Social Science Research Network Electronic Paper Collection:
http://ssrn.com/abstract=428560
CEIS Tor Vergata
R
ESEARCH
P
APER
S
ERIES
ICT investment, productivity and efficiency: evidence at firm level using a stochastic frontier approach
Luigi Paganetto
Università Tor Vergata, Roma, Facoltà di Economia, Dipartimento di Economia e Istituzioni, Via di Tor Vergata snc, 00133 Roma. E-Mail : [email protected]
Leonardo Becchetti
Università Tor Vergata, Roma, Facoltà di Economia, Dipartimento di Economia e Istituzioni, Via di Tor Vergata snc, 00133 Roma. E-Mail : [email protected]
David Andres Londono Bedoya
Università Tor Vergata, Roma, Facoltà di Economia, Dipartimento di Economia e Istituzioni, Via di Tor Vergata snc, 00133 Roma. E-Mail : [email protected]
Abstract
We analyse the determinants of ICT investment and the impact of information technology on productivity and efficiency on a representative sample of small and medium sized Italian firms. In order to test the most relevant theoretical predictions from the ICT literature we evaluate the impact of investment in software, hardware and telecommunications of these firms on a series of intermediate variables and on productivity. Among intermediate variables we consider the demand for skilled workers, the introduction of new products and processes and the rate of capacity utilisation. Among productivity measures we include total factor productivity, the productivity of labour, and the distance from the "best practice" by using a stochastic frontier approach.
Our results show that the effect of ICT investment on firm efficiency can be more clearly detected at firm level data by decomposing it into software and telecommunications investment. We find that telecommunications investment positively affects the creation of new products and processes, while software investment increases the demand for skilled workers, average labour productivity and proximity to the optimal production frontier.
We interpret these results by arguing that ICT investment modifies the trade-off between scale and scope economies. While software investment increases the scale of firm operations, telecommunications investment creates a “flexibility option” easing the switch from a Fordist to a flexible network productive model in which products and processes are more frequently adapted to satisfy consumers' taste for variety.
Paper presented at the XII Villa Mondragone Conference on “Knowledge economy, information technologies and growth”, held in Frascati, June 2000. We thank R.Cappellin, F. Daveri, W. Greene, D. Jorgenson, M. Kiley, L. Linch, C. Milana and all participants to the Conference for helpful comments and suggestions. The usual disclaimer applies.
Corresponding author: Leonardo Becchetti: Universita' "Tor Vergata", Via di Tor Vergata snc, 00133 Roma, Italia Fax +39/6/2020500 Tel. +39/6/2025361E-Mail: [email protected].
2 1. Introduction
The relationship between information and communication technology (from now on also ICT)1 and productivity has long been debated over the past three decades. In the 1980s and in the early 1990s, empirical research generally did not find relevant productivity improvements associated with ICT investment (Strassmann, 1990; Lovemann, 1988; Bender, 1986; Franke, 1987; Roach, 1989). Various rationales have been suggested to explain this paradox such as the limit of using simple bivariate correlations between aggregate productivity and aggregate ICT capital stock (Lehr-Licthemberg, 1999), the potential negative effect of augmented variety on productivity (Barua et al., 1991), the delayed effect of ICT investment on productivity gains and its dependence on network externalities and on changes in the complementary infrastructure (David, 1990).
More recently, as new data were made available and new methodologies were applied, empirical investigations have found evidence that ICT is associated with improvements in productivity, in intermediate measures and in economic growth (Oliner and Sichel, 1994; Lehr-Licthemberg, 1999; Sichel, 1997; Brynjolfsson and Hitt, 1996).
A first direction for improving this last vintage of empirical approaches is a disaggregation of the impact of ICT into the contributions of components with different effects and characteristics (such as software, hardware and telecommunications). A second direction is the implementation of the estimating approach usually based on two-stage estimation procedures (production function and then, separately, an estimation in which the dependent variable is the residual from the first equation) which inconsistently assume the independence of the inefficiency effects in the two estimation stages and are likely to be inefficient.
The paper follows these two directions showing that microfounded estimates of efficiency at firm level confirm the result of a positive and significant impact of ICT investment on productive
1
Information Technology is defined by the US Bureau of Economic Analysis as: "Office, computing and accounting machinery". As many researchers do we add to it communication equipment, software and related services.
3
efficiency found by the most recent literature. The paper also shows that it is possible to understand better the impact of ICT investment by decomposing it into software and telecommunications. Software investment has scale effects by increasing labour productivity, the demand for high skilled workers and the overall firm productive efficiency for a given amount of inputs. Telecommunications investment has scope effects by positively affecting the creation of new processes or products. The combination of these two effects, increases productive efficiency and utilisation capacity.
In the theoretical section of the paper these results are explained in the framework of the real option theory. We argue that changes in products and processes induced by ICT investment, reduce lags between knowledge of highly variable consumer tastes and final production. 2 These changes generate a flexibility option which, at any instant in time, gives the opportunity to delay the decision to invest in additional capacity, on the one side, and makes the decision to modify products and processes more likely, on the other side, thereby generating the observed effects on productivity and capacity utilisation.
The paper is divided into five sections. The second section presents descriptive empirical evidence on the intensity of investment in hardware, software and telecommunications in a representative sample of more than 4,000 Italian firms between 1995 and 1997 showing how ICT investment is affected by industry, geographical and qualitative firm characteristics. The third section outlines the four hypotheses to be tested. The fourth section analyses the effects of ICT investment on several intermediate variables such as capacity utilisation, new product/process introduction and hiring rates of high skilled workers at firm level. The fifth section presents several estimates which evaluate the association between ICT investment and the distance from the "efficient frontier."
2
To find significant examples which support this hypothesis see analyses of the effects of the creation of call centers (Aksin- Harker, 1999), of the introduction of CAD/CAM (Computer Aided Design and Computer Aided Manufacture) Milgrom- Roberts, 1988), and ERP (Enterprise Resource Planning) (Clausen-Koch, 1999; Wright-Burns, 1997). All these changes in the organisation of the productive process and customer relationship are induced by ICT investment.
4
2. Descriptive empirical findings on ICT investment intensity in Italy
We evaluate the intensity of ICT investment and its impact of various productivity measures using the Mediocredito Survey. The Survey includes a sample of more than 4,000 firms drawn from the whole set of Italian manufacturing firms. The sample is stratified according to industry, geographical and dimensional distribution of Italian firms for firms from 11 to 500 employees. It is by census for firms with more than 500 employees. For a subsample of 4,404 firms both qualitative and quantitative data (balance sheets for the 1995-1997 period) are collected. 3 Qualitative data provide, among other things, information about internationalisation, R&D investment, and successful introduction of products and processes.
Descriptive features of this sample illustrate some important characteristics of ICT investment in Italy (Table 1). The average ICT cumulative investment per employee in the sample period is 7 million liras. Per capita ICT investment is on average: i) more than a half lower in firms located in the South; ii) much higher in firms located in the North-East; iii) substantially higher for small firms and (as expected) for firms in the Specialised industries according to the Pavitt classification (mechanical equipment and mechanical materials).
By disaggregating ICT investment into hardware, software and telecommunications components we find that: i) software and hardware investment per employee in North-East (in the South) is almost double (half) as much as the national average; ii) software and hardware investment intensity is also
3
All balance sheet data in the Mediocredito database are accurately checked. Balance sheet data come from CERVED
which has the official information from the Italian Chambers of Commerce and is currently the most authoritative and reliable source of information on Italian companies. Qualitative data from questionnaire are based on responses from a representative appointed by the firm collecting information from the relevant firm division. The questionnaire has a system of controls based on “long inconsistencies”, namely inconsistencies between answers to questions placed at a certain distance in the questionnaire (i. e. responses use of government subsidies (export subsidies) are matched with responses on the exact composition of the flow of funds available for investment - internal finance, debt finance, grants, soft loans. – (on the share of exported net sales).
In case of inconsistent information the firm is subject to a second phone interview. Firms which do not provide reliable information after being recontacted are excluded from the sample. A supplementary list of 8000 firms is built for each of the three year surveys in order to avoid that exclusions, generated by nonresponses or inaccuracies in questionnaire responses, alter the sample design. Substitutions follow the criteria of consistency between the sample size and the population of the Universe.
5
relatively higher in Specialised industries and in R&D investing firms. The pattern of telecommunications investment is quite different. Intensity is higher in larger firms and in firms affiliated to groups and its geographical distribution is not so different across macroareas.
3. Four hypotheses on the impact of ICT investment: theoretical rationales and empirical tests
To investigate the effects of ICT investment we disaggregate it into different components and test their impact on productivity at firm level. The survey of the existing literature and the theoretical analysis lead us to formulate 4 hypotheses which we briefly explain and test in the following sections of the paper.
Hypothesis 1: investment in software increases the demand for skilled labour
This hypothesis has been already put forth by Roach (1991), Berndt et al. (1992) and Stiroh (1998) which argue that, even though ICT may substitute for labour, it also increases white collar productivity and hiring rates.
This proposition is the obvious outcome of cost minimisation under the assumption that an increase in the stock of ICT capital raises more the marginal productivity of skilled vis-à-vis that of unskilled labour. In this case, if the market for skilled labour is competitive, or if skilled labour wage is not too upward sloping in the number of skilled workers hired, only an increase in the number of skilled workers may restore the equilibrium condition which states that the ratio of wages between two factors must equal the ratio between their marginal productivities. Descriptive evidence does not contradict our hypothesis as software investing firms have an average yearly hiring rate of 0.6 per cent against a 0.3 per cent of the rest of the sample.
6
In testing econometrically our hypothesis, we use a Tobit model and evaluate the significance of coefficients with percentile and bias corrected bootstrapping techniques since the dependent variable is clearly nonnormal (Table A1.1) and left censored,.4
By estimating our model we empirically find a positive and significant effect of software investment on the demand for high skilled workers5 which supports our theoretical hypothesis (see Table A1.2 in the Appendix). This effect is significant net of the relationship that other controls have on the dependent variable (the positive and significant impact of size, export capacity, government subsidies and industrial group affiliation).
Hypothesis 2: investment in telecommunications positively affects the introduction of new products or processes
Previous papers argue that ICT investment has a positive effect on productive variety (Barua-Kriebel-Mukhopadhyay, 1991). We show here that this hypothesis is confirmed but that the increased variety effect must be attributed to telecommunications only and not to software and hardware investment. If telecommunications investment (such as the introduction or implementation of e-commerce, intranet and internet communication and network production) allows the firm to know in real time consumer tastes and to adapt more quickly its productive process to satisfy consumers' taste for variety, the introduction of new processes and products should be positively affected by it. Descriptive evidence strongly supports this hypothesis as 69 percent of telecommunication investing firms declare they have introduced new products against 30 percent of the rest of the sample. Empirical results show that investment in telecommunications for firms affiliated to groups is positively and significantly related to the decision to introduce new products (Table A1.2). The interesting finding is that the effect is not significant for those firms which invest in telecommunications but are not part of a group. The interpretation is that the scope
4
In a previous version of the paper (Becchetti et al.,2001) we extend the set of regressors to include a number of controls larger than that considered here. Our results on the effects of ICT on the dependent variable are unchanged and
7
and flexibility effect of this kind of ICT investment can be achieved only in an integrated network productive system which is typical of industrial groups. Logit results also show that investment in hardware (R&D investment) seem to affect negatively (positively) the dependent variable. The negative impact of hardware may be interpreted by considering that hardware investment is mainly related to an individual and specific production process, entails much more sunk costs and reduces flexibility and opportunities for introducing new processes. When we consider as a dependent variable the introduction of both products and processes the positive impact of telecommunications investment is confirmed. An interesting result is also the different effect on the dependent variable of investment subsidies - negative - and tax allowances - positive - which shows that when government support - as it is in the case of tax allowance - is not related to a specific investment in physical capital (and, often, to the renovation of the existing capital stock) it increases flexibility and capacity of introducing new products or processes.
Hypothesis 3: the investment in Information and Telecommunication Technology increases the value of the firm by adding a flexibility option whose effect is that of increasing average capacity utilisation .
The hypothesis of a positive relationship between capacity utilisation and ICT has been formulated by Barua-Kriebel-Mukhopadhyay (1991). We find support for it on our data and provide a theoretical rationale by using a simple dynamic programming example.
We may think of an investment in telecommunications as having a B2C (business to consumer) and a B2B (business to business) effect. The first enables producers to know in real time consumer tastes and the demand for differentiated products of the firms (consider for instance the recent development of "call centers" as an emerging marketing tool in which ICT allows to intensify
are available upon request .
5
8
contacts between a firm and its consumers). The second allows, through internet and intranet communication, the reduction of production lags and informational asymmetries among subcontractors and component producers at different levels of the chain value (i.e. the creation of "digital auction markets" for specific product chains increases the number of participants, reduces transaction costs and reduces lags between the definition of new product characteristics adapting to changed consumer tastes and its availability to final consumers). In our model this creates for the ICT investing firm the possibility to invest and adapt production in the same period in which consumer tastes are known.
Consider therefore the decision to increase productive capacity to satisfy a potential increase in demand under uncertainty as a real option in a simple dynamic approach. If telecommunications investment, reduces lags between knowledge of current customer tastes and final production, it also has the effect of enlarging the time window in which the firm may adapt its capacity to satisfy market demand. Telecommunications investment therefore creates an option for flexibility transforming the investment in the capacity increase from a "now or never" investment into a decision which can be postponed. In this framework, for certain values of model parameters, the decision to wait is preferred to the decision to "invest now" in additional capacity by ICT firms. Given the ex post positive probability of the realisation of the negative state of nature, the non ICT firm will find herself with expected lower additional capacity, contrary to the ICT firm which can postpone the investment decision after the observation of the stock.
The following theoretical example may help to explain this point. Consider the case of an entrepreneur which must invest in additional capacity and has not invested in ICT. The entrepreneur knows that in t1 there will be a taste shock which will affect the demand of the product generated with additional capacity. The model is in two periods.
Additional capacity will therefore yield to him extra revenues generated by the following process: X in t0 and X(1+g) in t1 if the shock increases the demand for the product (with prob p) and X(1-d) if
9
decide to invest now because: i) either he has not the technology to know consumer tastes in real time (know in t1 the realisation of the shock occurred in t1) or ii) because its productive process
cannot be adapted in t1 (extra additional capacity cannot be added) to produce in t1. On the
contrary, the ICT entrepreneur may delay the investment since the availability of telecommunication technology has the above mentioned B2C (business to consumer) and B2B (business to business) effects. In our model this creates for the ICT investing firm the possibility to invest and adapt production in t1 after knowing consumer tastes in the same period.
The value of its investment in extra capacity will be: ΩNIT =max{V0−I,0} where V 0=X+[X(1+g)p+X(1-d)(1-p)](1/(1+r)) or V0=X+[X(1+p(g+d)-d)](1/(1+r)). The entrepreneur which has invested in
information and telecommunications technology may know in real time consumer tastes on its web site and has eliminated lags between changes in productive capacity and final production. Therefore the value of its investment changes into: [ ]
+ − = Ω r F E I V IT 1 , max 0 1 0 where E0[ ]F1
=p*max[X(1+g)-I,0]+(1-p)*max[X(1-d) -I,0].6 is the expected value today of the continuation value. The investment in ICT will therefore increase the value of the ICT investing firm by the flexibility option which is equal to
ΩIT-ΩNIT. It is obvious then that there will be values of g,d,p such that: [ ] r F E I V + < − < 1 0 0 1 0 . If this
condition holds the ICT entrepreneur will find it optimal to wait in t0 and the non ICT entrepreneur will find it optimal to invest in additional capacity. As a result, capacity utilisation will be higher for the ICT entrepreneur in t1 if the negative shock is realised (with probability (1-p)) since, with the negative shock, the additional capacity I is too much to produce just X(1-d). The inequality holds when V0-I>0 (NC1) if
X+[X(1+p(g+d)-d)](1/(1+r))-I< [p*max[X(1+g)-I,0]+(1-p)*max[X(1-d) -I,0]] (1/(1+r))
In choosing whether to postpone the investment the ICT entrepreneur therefore trades off the advantage from investing soon (the present cash flow from the investment in t0 (X)) with the
10
advantage from waiting and avoiding to invest under the bad state of nature in t1 and from reducing the expected cost of the investment. Therefore if X>Ir/(1+r), it is convenient to wait only if the investment would give nonpositive returns in case the bad state of nature is realised. It is therefore clear that the value of the option to wait is increasing in the discount rate and - if the value of the project is non positive under the negative shock - in the size of the negative shock, while it is decreasing in the project value.
To check whether the same arguments hold in continuous time and with a slightly more complex stochastic process for returns from the project of investing in additional capacity, consider the following argument developed by following the standard Dixit-Pindick (1994) approach .
Let the return from investing in additional capacity follow the geometric Brownian motion: Ydz
Ydt
dY =α +σ where dz is the increment of a Wiener process so that E[dz]=0 and Var[dz]=dt. Remember that Y represents the present value of the investment in additional capacity and therefore the discounted sum of cash flow from the investment at the time the investment itself is taken. Consider the payoff from investing now: ΩYo=max{Y0−I,0} and the payoff from holding the option to
invest in the future
{
T}
T Y F Y E Y I e ρ − − = =
Ω ( ) max ( ) where T is the period in which the firm finally
decides to expand its capacity. We are in the continuation region if ΩY >ΩYo. In this region the following no arbitrage condition holds: ρF(Y)dt=E[dF(Y)]. On the left hand side we have the
appreciation at the normal market return of a sum corresponding to the value of the option. On the right hand side we have the change in value of the option to wait in the same interval. By applying Ito's lemma, taking expectation and simplifying we get the following second order
(homogenous-constant coefficient) differential equation: 0
2
1 2 2 − =
+
+ YF Y F F
Ft α Y σ YY ρ .
The differential equation has the usual three boundary conditions:
F(0)=0 (A2.1), F(Y*)=Y*-I (A2.2) , F'(Y*)=1 (A2.3)
6
Note that, from a mathematical point of view the flexibility option shifts the probability of the realisation of the state of nature before the max operator. In other terms, the advantage of postponing the investment decision is that the
11
The first is the obvious consequence of what happens to a geometric Brownian motion when Y=0. The second is the value matching condition, which implies that the gain from investing net of the opportunity cost is equal to the cost of investing. Finally (A2.3) is the smooth pasting condition requiring that not only levels but also first derivatives of the holding option and the termination payoff match at the optimum.
The trial solution which satisfies (A2.1) is 1
) (Y AVβ
F = . By replacing this solution in (A2.2) and
(A2.3) we find the usual values for A and Y* with Y I
1 * 1 1 − = β
β . To solve for the value of β1 we replace
the trial solution in the second order differential equation and simplify to obtain:
0 ) ( ) 1 ( 2 1 2 − + − − = + +α Y σ β β ρ δ ρ t YF
F . This second order equation gives two roots: β1>1 and β2<0.
Given the range of values that β1 can take the following inequality may hold: Y*<Y<I. When Y takes values which respect this inequality the non ICT firm will invest in additional capacity but the ICT firm will find it optimal to wait. A subsequent fall in the value of the returns from the project will therefore generate the result of a lower capacity utilisation for the ICT firm.
I Y
Y*< < may occur even in the case of a deterministic process similar to the previous one except
for σ=0. In this case in fact it is possible to find the time at which the option to increase productive
capacity is exercised. We have in fact
{
T T}
Y Ye I e ρ α − − −
=
Ω ( ) . After rearranging first order
condition we get: − = ,0 ) ( log 1 max * Y I E T α ρ ρ
α . It is clear than that if Y is not too higher than I it is better to wait for the ICT firm while it is impossible to do it for the non ICT firm.
Empirical results are consistent with our hypothesis on the effects of telecommunications investment on capacity utilisation. The interesting point is that the effect is positive only when firms are part of a group. This may be interpreted by saying that the crucial factor in generating the flexibility option is the network productive organisation. In the language of our theoretical model the critical factor is not just the capacity of knowing consumer tastes in real time (B2C effect) but
12
mainly the capacity of a more flexible productive organisation (B2B effect) which reduces lags between knowledge of consumers’ taste for variety and the final production of a complex diversified range of products which assemble different components.
Hypothesis 4: investment in software increases the average productivity of labour.
The effect of software investment on average labour productivity is the consequence of hypothesis 1 as new workers are hired, the new software technology increases the marginal productivity of each individual worker and average labour productivity is higher.7
Given the nonnormal distribution of the dependent variable (Table A 1.3) we evaluate the effect of our set of regressors on two points of the distribution of the dependent variable (conditional mean and conditional median). Empirical results on the determinants of labour productivity seem consistent with our theoretical conclusions. In the estimate with all controls software and telecommunications investments have the expected sign even though the impact of telecommunications is significant only on conditional mean and not on conditional median. On the other hand, hardware investment has no significant impact on the dependent variable.
This last result may seem puzzling at first sight. Software and hardware are two complementary factors which jointly determine the ICT endowment of a firm. It seems almost impossible that one of them functions without the other. We believe that there are at least three reasons which justify our result.
The first is that in Italy several laws exist [Law 64, Law 488, Law 46/82(R&D program), Law
1329/65 (Sabatini program), Law 949/52 (SME program)] providing soft loans or grants for buying
hardware together with other investment goods but several times human resources do not possess
7Only with a wage which is insensitive to the total number of employees the marginal productivity of the last worker
13
skills for operating them. It is therefore frequent to see hardware which has been purchased for free with grants but is not used because there are no skills for operating it.
The second is that the same vintage of hardware investment may support different vintages of updated software (up to a certain limit). Therefore software needs more frequent renewal without which the productivity of hardware cannot be enhanced.
As a consequence of these two factors jointly considered it is likely that the positive effect on productivity is realized mainly when positive software investment indicates that the human capital is able to adopt and use the technology incorporated in the hardware and that the hardware potential is implemented with new and more powerful software.
A third explanation is represented by web hosting or housing practices. This indicates the habit of many small firms, 8 as those considered in the sample, of investing in software but not in hardware, renting a shelf in a mother company whose hardware houses the small company software. In this case the software-hardware complementarity vanishes and the software investment alone may generate productivity effects.
4. ICT investment and firm efficiency: a stochastic frontier approach
The empirical approach followed so far has the defect of not being rigorously microfounded. The stochastic frontier approach followed in the next section will amend this problem and test whether different types of ICT investment significantly affect the distance from the optimal production frontier in our sample. We estimate the impact of ICT investment on efficiency at firm level by
8
A 2000 Dresder Kleiner Benson Report (Web hosting /ASP, March 2000) indicates that the web hosting market has almost doubled every year between 1995 and 1997 and that 66 percent of surveyed firms indicated the lack of internal resources as the reason for this choice. The report also says that “managing storage area networking, and providing real time memory space, processing power, shared RM/ROM and transparent load balancing across several local points of presence is complex task. As servers need to be replicated in multiple geographic locations to move content closer to
14
using a traditional stochastic frontier approach (Battese and Coelli, 1995). In this model the inefficiency effects are expressed as an explicit function of a vector of firm-specific variables and a random error9
The first equation is a five input Cobb-Douglas production function and is specified as follows:
it it it it it it it it
j
Ind
j
K
HSL
LSL
RM
II
v
u
m
j
Y
∑
−
+
+
+
+
+
+
−
=
+
=
1
*
1
2
3
4
4
1
0
α
β
β
β
β
β
α
(1).Y is the log of real output of the ith firm at time t (i=1,...,N; t=1,...,T); K is the log of the capital stock evaluated at the replacement cost, HSL, LSL, RM and II represent additional inputs (and are respectively the log of high skilled and low skilled workers, raw materials and intermediate inputs). Since any industrial sector may have in principle a different production function we add to the specification m-1 intercept dummies for 20 sectors aggregated on the basis of the four digit ISTAT-ATECO classification. This solution is not completely satisfactory as industry production functions may also differ in input marginal productivities. We therefore estimate the model separately for each industry for which we have enough degrees of freedom.10 The vit is a random variable which is
assumed to be iid. N(0,σV2), and independent of the uit . The latter is a non-negative random
variable which is assumed to account for technical inefficiency in production and to be independently distributed as truncation at zero of the N(mit,σU2) distribution. Finally, mit = zitδ, (2), zit is a p×1 vector of variables which may influence the efficiency of a firm and δ is an 1×p
vector of parameters to be estimated.
the customer, avoid congestion at single server location and reduce risk through physical network redundancies, the cost complexity of in-house hosting becomes untenable”.
9
This approach has been widely recognised to be superior to the two-stage estimation which inconsistently assumes the independence of the inefficiency effects in the two estimation stages. The two-stage estimation procedure is unlikely to provide estimates which are as efficient as those that could be obtained using a single-stage estimation procedure.
10
Estimates with a simpler two input Cobb-Douglas production function for the overall sample with dummies accounting for differences in industry slopes have also been performed with results on the impact of ICT investment on productive efficiency which are not substantially different from those obtained with the five input aggregate and industry estimates. These additional estimates are available from the authors upon request.
15
Following Battese and Coelli (1993), we replace σV2 and σU2 with σ2=σV2+σU2 and
γ=σU2/(σV2+σU2
). The log-likelihood function of this model is described in Battese and Coelli
(1993).
The nonzero mean residual of the production function is regressed on a series of factors which are expected to affect efficiency:
it k k n k i i m i it
ICT
Cap
Innovat
esfi
nts
Ration
CSSA
Family
Qtnosep
Csat
Group
Old
Young
Macroarea
Ind
u
ε
δ
δ
δ
δ
δ
δ
δ
δ
δ
δ
δ
δ
δ
γ
α
α
+
+
+
+
+
+
+
+
+
+
+
+
+
+
+
+
+
+
=
∑
∑
− = − = 13 12 11 10 9 8 7 6 5 4 3 2 1 1 1 1 1 0Pr
Re
(2)First, we introduce factors traditionally considered in the literature (Hay-Liu, 1997; Nickell, 1996 and Nickell-Nicolitsas-Dryden, 1997) such as CAP (the degree of capacity utilisation), RENTS - ((profits before tax+depreciation+interest payments-cost of capital*capital stock)/value added) and
PRESFI - interest payments/ (interest payment + cash flow). IND, MACROAREA, SIZE, GROUP, QTNOSEP and FAMILY are specified as in Appendix 1.
We then add two dummies (OLD, YOUNG) respectively picking up the older and the younger 20 percent of sample firms. An additional control (which we expect to be positively related to productive efficiency) is represented by CSAT and CSSA, two dummies respectively picking up firms monitoring customer satisfaction and firms which created sale structures abroad.11 INNOVAT is a dummy for firms which successfully introduced new products or processes. Finally, ICT is the average ICT investment per employee.
The model is estimated as a cross-section in which all variables are expressed as three year averages. We adopt two different specifications. In the first ICT investments are considered jointly,
11
The literature investigating the relationship between efficiency and internationalisation usually finds a two-way positive relationship between internationalisation and productivity (Aw-Hwang, 1995; Clerides-Lach-Tybout, 1998 and Becchetti-Santoro, 2000). The variable is therefore an important control to be considered in order to avoid omitted variable biases.
16
while in the second they are disaggregated into software, hardware and telecommunications investment per employee.
On the whole the model seems to fit well our data and the presence of technical inefficiencies is supported by the positive and significant gamma coefficient (Table 3).
Estimate results show that aggregate ICT investment has a positive and significant effect on firm efficiency and that software has a positive (negative) effect when individually considered. Telecommunications investment has a weakly significant negative effect on efficiency. These findings show the existence of a symmetry between effects of ICT inputs on average labour productivity and on productive efficiency for a given level of inputs (Table A1.2).
The effect of telecommunication investment may seem surprising at first sight. We must consider though that in our previous hypotheses we argued that telecommunications investment extends the window in which the decision to increase productive capacity may be taken and gives firms not only the opportunity to expand capacity, but also to change products and processes to satisfy consumers taste for variety. If this is true telecommunications investing firms are more likely, at any instant of time, to shift firm activity to new products or processes by paying, though, when this decision is taken, the cost of reduced productivity of labour inputs which need to be retrained because of these changes (Kyley, 1999). This temporary negative effect should be offset by quality improvement generated by the introduction of new products and processes. If we measure the impact of telecommunication investment on measures of output not adjusted for quality the negative effect is likely to prevail.
Other controls give expected results. Firms located in the South, older firms and firms which declared to be credit rationed are significantly less efficient than average consistently with previous findings (Becchetti-Santoro, 2000). The result on rents is consistent with all the traditional literature on the effects of competition on efficiency.12 The hypothesis that financial pressure increases
12
According to it, competition has positive effects on efficiency (Short, 1994; Nickell, 1995; Vickers, 1995): i) by making it easier for owners to compare managerial performance with that of competitors; ii) by increasing the
17
managerial discipline (Jensen, 1986 and 1988; Aghion et al., 1995) is supported by our data only in the extended specification in which ICT investment is disaggregated into its three different components. Industry estimates show that the aggregate significance of the effect of ICT investment is determined by the behaviour of some and not of all considered sectors (Table 3). Estimates have been performed only for those industries (7 out of 19) for which we dispose of enough observations. The ICT coefficient significantly affects productive efficiency in five industries (Mechanical materials, Mechanical Equipment, Textile, Wood and Wooden Furniture, Paper and Printing) while in the other two (Metal Products, Food and Beverages) is not significant.
5. Conclusions
Simple intuition from experience in various professional fields (including the academia) suggests that the increase in productivity from an improvement in software technology (more powerful word processing and printing, etc.) is positively related to the skills of the labour inputs. In the same way, an improvement in telecommunications techology (such as the opportunity of internet or intranet networking, the introduction of e-mail, e-commerce, etc.) increases the inflow of available information thereby generating a flexibility option which will make more expensive and which will delay irreversible decisions such as new investments. This option will generate at the same time the opportunity to differentiate more quickly processes and products in order to satisfy consumers' taste for variety.
We therefore expect that, at any instant of time, a firm investing in telecommunications will delay investment in additional capacity and introduce new products and processes with a higher probability.
advantage of higher efficiency under the form of cost reductions as the latter are more profitable under competition where demand elasticities are higher; iii) by leading managers to work harder in order to avoid bankruptcy which is more likely to occur in a tight market (Schmidt, 1996; Aghion-Howitt, 1996).
18
What we should observe therefore is an increase in the demand for skilled workers and in average labour poductivity after a software investment and an increase in capacity utilisation together with an increase in the introduction of new products and processes after a telecommunications investment.
These results open interesting directions for future research. Which is the combined effect of higher productivity and reduced investment intensity generated by the option to delay on the rate of growth ? Is the volume of high-tech investment socially optimal and, if not - considered that increased capacity utilisation must be related with a lower rate of growth of the physical capital stock and considered the positive externality of this type of investment on the rest of the economy -, which measures can be taken to reduce the incentive of high-tech firms to delay?
We think that answers may be found on fiscal and monetary policies and on the governance of financial markets and that the different ability to implement measures in these three directions is significantly affecting the capacity of different countries of translating benefits of the new economy into higher rates of growth.
19
Table 1 Descriptive findings on the determinants of ICT investment (95-97 ICT investments per employee - millions of liras)
ICT investment per employee
South and isles Centre North-West North-East ITALY N.of obs Mean N. of obs Mean N. of
obs
Mean N. of obs Mean N. of obs Mean All firms 338 2.87 354 6.05 1386 5.42 802 12.06 2980 7.16 Small size 188 3.00 315 4.65 750 7.23 457 19.57 1710 9.59 Large size 86 2.46 80 13.67 413 3.25 208 3.48 787 4.28 Scale sectors 100 2.21 129 6.43 413 10.22 205 4.29 847 7.26 Traditional sectors 163 2.65 223 2.81 483 2.89 302 2.79 1171 2.82 Specialised sectors 37 4.27 80 4.91 424 3.64 264 31.47 805 12.92 R & D investmenting firms 88 4.53 178 8.77 607 5.98 333 25.23 1206 11.60 Subsidised firms 241 2.60 210 9.40 609 3.20 350 3.93 1410 4.20
Variable South & isles Centre North-West North-East ITALY
Telecommunication investment per employee
N. of obs Mean N. of obs Mean N. of obs
Mean N. of obs Mean N. of obs Mean All firms 333 0.151 443 0.258 1363 0.149 792 0.152 2931 0.167 Small size 186 0.148 304 0.145 737 0.110 449 0.128 1676 0.126 Large size 84 0.190 80 0.789 404 0.206 207 0.191 775 0.261 Scale sectors 98 0.140 126 0.081 405 0.151 201 0.210 830 0.153 Traditional sectors 160 0.129 218 0.081 476 0.116 300 0.104 1154 0.108 Specialised sectors 37 0.271 78 0.570 418 0.164 260 0.164 793 0.209 R & D investing firms 88 0.145 172 0.550 594 0.191 331 0.185 1185 0.238
Variable South & isles Centre North-West North-East ITALY
Hardware investment per employee
N. of obs Mean N. of obs Mean N. of obs
Mean N. of obs Mean N. of obs Mean All firms 333 1.718 443 3.908 1363 2.811 792 8.207 2931 4.311 Small size 186 1.876 304 2.768 737 3.777 449 13.222 1676 5.914 Large size 84 1.304 80 9.867 404 1.675 207 1.728 775 2.494 Scale sectors 98 1.276 126 4.169 405 5.373 201 2.074 830 3.908 Traditional sectors 160 1.614 218 1.443 476 1.461 300 1.399 1154 1.463 Specialised sectors 37 2.507 78 4.735 418 1.858 260 21.642 793 8.437 R & D investing firms 88 2.569 172 5.823 594 3.275 331 17.057 1185 7.442
Variable South & isles Centre North-West North-East ITALY
Software investment per employee
N. of obs Mean N. of obs Mean N. of obs
Mean N. of obs Mean N. of obs Mean All firms 333 1.022 443 1.982 1363 2.475 792 4.356 2931 2.744 Small size 196 0.997 304 1.824 737 3.361 449 6.513 1676 3.664 Large size 84 0.959 80 3.015 404 1.384 207 1.546 775 1.550 Scale sectors 98 0.776 126 2.273 405 4.782 201 1.997 830 3.253 Traditional sectors 160 0.946 218 1.310 476 1.320 300 1.291 1154 1.259 Specialised sectors 37 1.495 78 1.885 418 1.631 260 10.114 793 4.431 R & D investing firms 88 1.819 172 2.587 594 2.537 331 8.126 1185 4.052
20
Tab. 2. ICT investment and productive efficiency: a stochastic frontier estimate (1997 cross-section estimate) Production Function Variables Technical Efficiency Variables
Coef. t-ratio Coef. t-ratio Coef. t-ratio Coef. t-ratio Constant 3.703 7.326 3.870 7.591 Constant -1.371 -1.810 0.118 0.164 Ln(K) 0.142 9.553 0.139 9.126 Ind1 -0.763 -2.385 -0.558 -1.827 Ln(HSL) 1.800 3.443 1.674 3.226 Ind2 0.197 0.694 0.567 1.803 Ln(LSL) 1.452 2.032 1.383 1.930 Ind3 0.085 0.153 0.044 0.091 Ln(RM) 0.119 10.812 0.122 11.272 Ind4 -0.658 -2.303 -0.612 -2.319 Ln(II) 0.144 14.506 0.139 13.576 Ind5 -1.087 -2.186 -0.987 -2.484 Ind1 0.345 2.919 0.317 2.158 Ind6 -0.311 -0.746 -0.389 -1.039 Ind2 0.067 0.546 0.379 1.637 Ind7 -1.349 -2.401 -0.845 -2.077 Ind3 0.252 1.018 0.236 0.872 Ind8 -1.498 -1.638 -1.071 -1.514 Ind4 -0.186 -1.686 -0.258 -1.855 Ind9 -0.157 -0.440 -0.126 -0.342 Ind5 -0.095 -0.805 -0.196 -1.317 Ind10 0.076 0.147 2.586 4.285 Ind6 0.117 0.785 0.048 0.280 Ind11 -0.295 -1.002 -0.293 -0.979 Ind7 -0.163 -1.319 -0.182 -1.235 Ind12 -0.258 -0.719 -0.444 -1.465 Ind8 -0.486 -2.574 -0.546 -2.783 Ind13 -1.127 -2.752 -0.947 -2.808 Ind9 -0.195 -1.276 -0.195 -0.913 Ind14 -0.868 -1.579 -0.814 -1.790 Ind10 0.450 2.231 2.856 4.865 Ind15 -2.719 -2.367 -2.982 -2.666 Ind11 -0.164 -1.391 -0.216 -1.433 Ind16 -2.993 -2.840 -3.157 -3.202 Ind12 -0.189 -1.436 -0.279 -1.807 Ind17 -3.073 -2.911 -2.792 -3.016 Ind13 -0.223 -2.064 -0.300 -2.153 Ind18 -1.016 -1.084 -0.489 -0.537 Ind14 -0.322 -2.173 -0.400 -2.450 Ind19 3.793 3.803 3.117 4.181 Ind15 -0.204 -1.313 -0.309 -1.814 North-West 0.263 1.531 0.124 1.254 Ind16 -0.544 -3.450 -0.631 -3.862 North-East 0.337 1.890 0.167 1.571 Ind17 -0.283 -2.432 -0.395 -2.638 South 1.087 5.177 0.623 5.281 Ind18 -0.437 -1.900 -0.393 -1.030 Young 0.144 1.375 0.057 0.723 Ind19 3.895 4.307 3.588 5.000 Old 0.411 4.217 0.231 3.294 Group 0.127 1.521 0.075 1.235 Csat -0.060 -0.669 -0.023 -0.356 Qtnosep -0.002 -1.263 -0.001 -0.923 Family 0.059 0.703 0.032 0.519 CSSA -0.077 -0.883 -0.046 -0.737 Ration 0.569 2.829 0.391 2.803 Rents 0.019 10.607 0.016 9.085 Presfi -0.007 -0.652 -0.009 -1.773 Innovat -0.043 -0.399 -0.035 -0.510 Cap 0.944 1.552 0.118 0.164 ICT investment - aggregate -0.005 -8.261 Software investments -0.081 -4.110 Hardware investments 0.006 1.059 Telecommunicati on investments 0.063 1.639 Sigma-squared 0.468 18.123 0.366 13.391 Gamma 0.566 12.923 0.481 8.728 Industry Legend
Ind1: Food, beverages, tobacco Ind2: Textile, clothing Ind3: Leather, shoes
Ind4: Wood and wooden furniture Ind5: Paper and printing
Ind6: Chemicals
Ind7: Rubber and plastics Ind8: Glass, ceramics Ind9: Construction materials Ind10: Metal extraction Ind11: Metal products Ind12: Mechanical materials Ind13: Mechanical Equipment Ind14: Electronics
Ind15: Electrical equipment
Ind16: Precision instruments and apparels Ind17: Vehicles and vehicle components Ind18: Energy
Ind19: Other manufacturing Log L 1288.48 1265.78 N. of Obs. 1752 1736
21
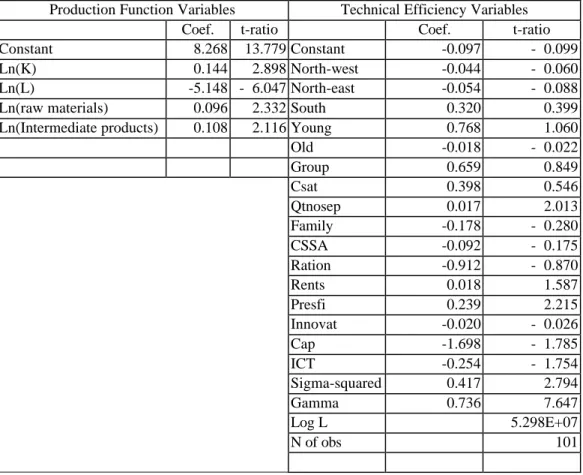
Table 3 ICT investment and productive efficiency: synthesis of results from stochastic frontier estimates at industry level
Obs. Gamma Sig. IT Sig
Food, beverages, tobacco
179 0.148 2.780 0.009 0.277
Textile, clothing 244 0.844 2.572 -0.022 -2.265
Wood and wooden furniture
101 0.735 7.647 -0.253 -1.753
Paper and printing 97 0.364 2.559 -0.019 -4.681
Metal products 159 0.560 6.168 0.010 0.173 Mechanical materials 74 0.454 2.312 -0.075 -3.156 Mechanical Equipment 181 0.136 6.138 -0.027 -5.324
We estimate the model only for those industries for which we have a sufficiently high number of observations (n>70). We use a four factor production function given that low skilled and high skilled labour are highly multicollinear. A few of the other regressors included in the general model presented in tab.2 are singled out on the basis of the VIF factor (VIF>10) which measures multicollinearity with the remaining independent variables. Detailed estimate results are collected in an Appendix available from the authors upon request.
22 References
Aksin, O. Z.; Harker, P. T., 1996, Modeling a Phone Center: Analysis of a Channel Multi-Resource Processor Shared Loss System, INSEAD Working Papers: 97/57/TM, pp. 38. Aw, B.Y., A.Hwang, 1995, Productivity and export marker: a firm level analysis, Journal of
Development Economics, 47, 209-231.
Baily, Martin Neil and Gordon, R. J. [1988], "The Productivity Slowdown, Measurement Issues and the Explosion of Computer Power", Brookings Papers in Economic Activity, 1988(2): 347-431.
Barua, A., Kriebel, C. and Mukhopadhyay, T. [1991], "Information Technology and Business Value: An Analytic and Empirical Investigation," University of Texas at Austin Working Paper, (May).
Battese, G.E., Coelli, T.J., 1998, prediction of firm-level technical inefficiencies: with a generalised frontier production function and panel data, Journal of Econometrics, 7, 185-208.
Becchetti L., Paganetto L., Londono Bedoya D.A., ICT Investment, Productivity and Efficiency: Evidence at Firm Level Using a Stochastic Frontier Approach, CEIS Working Paper n. 126 Becchetti, L., Santoro, M., 2001, The determinants of small-medium firm internationalisation and
its effects on productive efficiency, Weltwirtschaftliche Archiv, 2.
Bender, D. H. [1986], Financial Impact of Information Processing. Vol. 3(2): 22-32.
Berndt, Ernst R. [1991], The Practice of Econometrics: Classic and Contemporary, Wesley, Reading, MA.
Berndt, Ernst R. and Morrison, Catherine J. [1995], "High-tech Capital Formation and Economic Performance in U.S. Manufacturing Industries: An Exploratory Analysis", Journal of Econometrics 65: 9-43.
Berndt, Ernst R., Morrison, Catherine J. and Rosenblum, Larry S., [1992], "High-tech Capital Formation and Labor Composition in U.S. Manufacturing Industries: an Exploratory Analysis," National Bureau of Economic Research Working Paper No. 4010, (March). Brynjolfsson. Erik and Hitt, Lorin. [1996], "Paradox Lost? Firm-Level Evidence on the Returns to Information Systems Spending", Management Science, (April)
Brynjolfsson, Erik and Hitt, Lorin. [1995], "Information Technology as a Factor of Production: the Role of Differences among Firms," Economics of Innovation and New Technology, Vol. 3: 183-199.
Chirinko, R.S., 1993, Business Fixed Investment Spending, Journal of Economic Literature 31.
Clausen, C.; Koch, C., 1999, The Role of Spaces and Occasions in the Transformation of Information Technologies--Lessons from the Social Shaping of IT Systems for Manufacturing in a Danish Context, Technology Analysis and Strategic Management; 11(3), September pp. 463-82.
Clerides, S.K., Lach, S. and Tybout, 1998, Is learning-by-exporting important? Micro-dynamic
evidence from Colombia, Mexico and Morocco, Quarterly Journal of Economics, vol CXIII, August, 903-947
Cubbin, J. S. Leech, D., 1983, The Effect of Shareholding Dispersion on the Degree of Control in British Companies: Theory and Measurement, Economic Journal; 93(37), pp. 351-69.
David, Paul A. [1990], "The Dynamo and the Computer and Dynamo: A Historical Perspective on the Modern Productivity Paradox," American Economic Review Papers and Proceedings, Vol. 80(2): 355-361, (May).
Dixit, Pindick , (1994), Investment under uncertainty.
Kiley, M. T., 1999, The Supply of Skilled Labour and Skill-Biased Technological Progress,
Economic Journal, 109(458), pp. 708-24.
La Porta, R.; Lopez de Silanes, F.; Shleifer, A., 1999, Corporate Ownership around the World, Journal of Finance; 54(2), 471-517.
23
Leech, D. and Leahy, J. 1991, Ownership structure, control type classifications and the performance of large British companies, Economic Journal, 101, 1418-1437.
Lehr, B., Lichtenberg, F., 1999, Information Technology and Its Impact on Productivity: Firm-Level Evidence from Government and Private Data Sources, 1977-1993, Canadian Journal
of Economics; 32(2), pp. 335-62.
Lichtenberg, Frank R. [1995], "The Output Contributions of Computer Equipment and Personal: A Firm-Level Analysis," Economics of Innovation and New Technology, Vol. 3: 201-217. Loveman, Gary W. "An Assessment of the Productivity Impact of Information Technologies," MIT Management in the 1990s, Working Paper # 88 – 05, July 1988.
Loveman, Gary W. [1994], "An Assessment of the Productivity Impact of Information Technologies," in Allen, Thomas J. and Scott Morton, Michael S. (Ed.), Information Technology and the Corporation of the 1990s: Research Studies, Oxford University Press, pp. 84-110.
McConnel, J.J: and Servaes, H., 1990, Additional evidence on equity ownership and corporate value, Journal of Financial Economics, 27, 595-612.
Milgrom P., Roberts R., (1988), The Economics of Modern Manufacturing: Products, Technology
and Organization, Stanford Center for Economic Policy Research Discussion Paper 136
Morrison, Catherine J. and Berndt, Ernst. R. [1991], "Assessing the Productivity of Information Technology Equipment in U.S. Manufacturing Industries," National Bureau of Economic Research Working Paper No. 3582, (January).
Nelson, R. R. [1981], "Research on Productivity Growth and Productivity Differences: Dead Ends and new Departures," Journal of Economic Literature, Vol. 29: 1029-1064.
Nickell, S., 1996, Competition and Corporate Performance, Journal of Political Economy, 104(4), 724-46.
Nickell, S; Nicolitsas, D.; Dryden, N., 1997, What Makes Firms Perform Well?, European
Economic Review; 41(3-5), 783-96.
Oliner, Stephen D. and Sichel, Daniel E. [1994], "Computers and Output Growth Revisited: How Big is the Puzzle?" Brookings Papers on Economic Activity, 1994(2): 273-334.
Roach, Stephen S. [1991], "Services under Siege: the Restructuring Imperative," Harvard Business Review 39(2): 82-92, (September-October).
Roach, Stephen S. [1989b], "America's White-Collar Productivity Dilemma," Manufacturing Engineering , August , pp. 104.
Schwarts, G. and Clements, B., 1999, Government Subsidies, Journal of Economic Surveys, 13, 2, 119-147.
Scott, John T., and Albert N. Link. 1997. "Assessing the Infrastructural Needs of a Based Service Sector: A New Approach to Technology Policy Planning," Best Practices in
Technology and Innovation Policy, Wolfgang Polt (ed.). Organisation for Economic
Cooperation and Development, Paris.
Short E, 1994, Ownership, control, financial structure and the performance of firms, Journal of
Economic Surveys, 8, 203-249.
Sichel, Andrew. 1997. The Computer Revolution: An Economic Perspective. Brookings Institution Press, Washington, DC.
Stiroh, K.J., 1998, Computers productivity and input substitution, Economic Inquiry, 36,2, April, 175-91.
Strassmann, P. A. [1990], The Business Value of Computers: An Executive's Guide. New Canaan, CT, Information Economics Press.
Vickers J., 1995, Concepts of Competition, Oxford Economic Papers; 47(1), January, pp. 1-23. Wright, D. T.; Burns, N. D., 1997, Cellular Green-Teams in Global Network Organisations
24 Appendix 1
To consider the impact of ICT investment on different dependent variables we formulate a comprehensive model with six types of general controls plus specific controls which may be relevant for the selected dependent variable.
The specification adopted is:
ε γ γ γ α γ δ α α
∑
∑
∑
∑
∑
∑
∑
− = − = − = − = − = − = − = + + + + + + + + = 1 1 1 1 1 1 1 1 1 1 1 1 1 1 0 y q q q z r r r w s s s l d l l k n k k j p j j i m iiInd Pavitt Macroarea Identity Finance IPHC ITV
IO
(A1.1)
where IO is the selected intermediate variable (utilisation capacity, hiring rate of skilled workers, introduction of new products or processes, net sales per employee) measured in 1997. Given the distributions of these dependent variables (see Table A.1.1) we adopt a right censored Tobit model for utilisation capacity, a left censored Tobit model for the hiring rate of skilled workers, a Logit model for the introduction of new products or processes and least squares for net sales per employee. Since dependent variables are not normally distributed (see Table A 1.1) we estimate confidence intervals for regressors coefficients with bootsrapping techniques (we adopt the percentile method with 1000 replications). In the case of the net sales per employee estimate we check whether the impact of regressors are significant not only on conditional mean but also on conditional median.
Our groups of general controls are:
i)IND are m-1 industry dummies based on a three-digit ATECO classification (m=1,..,20),
ii)PAVITT are p-1 macrosector dummies (p=1,..,4), 13
iii) MACROAREA are n-1 macroarea dummies (n=1,..,4),
13
These are three of the four Pavitt dummies (Scale, Specialised, High-Tech and Traditional sectors). We adopt both the Pavitt and the 21-sector extended classification since firms within the same sector often belong to different Pavitt
25
iv) IDENTITY (four variables): SIZE are firm’s employees in 1995, BIRTH is the firm’s year of
establishment, EXPORT is a dummy for exporting firms, GROUP is a dummy which takes value of one for firms affiliated to groups (subsidiaries or parent companies) and zero otherwise.
vi) FINANCE (three regressors on the availability and costs of external and internal finance):
SUBSIDY is a dummy indicating if the firm received soft loans, AGEVOL is a dummy for firms
which received tax allowances in the 1995-97 period, LEV is the 1995 ratio of debt versus banks to total assets,14
vii) INNOVATION, HUMAN AND PHYSICAL CAPITAL (four controls for technological
innovation): INNOVAT is a dummy taking value of one if the observed firm declares to have successfully innovated their products or processes, R&DINV is a dummy for firms with nonzero R&D investment in 1995, QLWSK is the 1995 share of low skilled workers (workers without a University degree) on total employees, CAPAD is capital intensity or the stock of physical capital per employee.
viii) ITV (vector of information technology variables): ITXASOF, ITXAHAR, ITXATEL and
ITXTELG are respectively the 1995-1997 investment in software, hardware, telecommunications
and telecommunications for firms participating to groups. All these variables are scaled for the total number of firm employees.
Results of estimates including all controls are shown in tab A1.2.
macrosectors. The inspection of the correlation matrix shows that this choice does not create severe multicollinearity problems in the estimate. The correlation matrix is available from the authors upon request.
14
In balance sheet data the following debt items are registered: i) debt versus banks; ii) debt versus partners; iii) debt versus group; iv) debt versus suppliers - customers anticipated payments; v) bonds. Items ii) and iii) should be considered as equity more than debt, because non individual firms are often participated with a share higher than 50%. Item iv) is commercial debt more linked to operating expenses than to investment financing. We use total assets and not equity capital as a scale variable because all firms are small and medium sized, not listed in the stock exchange and most of them family owned. As a consequence, equity capital is often a symbolic balance sheet item, extremely volatile and not representative of firm’s stock of total assets.
26
Tab A.1.1 Percentile distribution and normality tests for dependent variables of econometric estimates in Tab. A1.2 Percentile Fatad97 Dhsk Cap97
10 133.572 0.000 0.70 20 169.263 0.000 0.70 30 200.000 0.000 0.80 40 231.250 0.000 0.80 50 267.653 0.000 0.85 60 309.989 0.000 0.90 70 369.003 0.000 0.90 80 468.196 0.000 0.95 90 637.343 0.011 1.00 100 19417.850 0.654 1.00 Mean 368.634 0.004 0.831 Obs 4445 3317 4309 Normality tests Shapiro-Wilk Z 19.472 18.109 12.020 P-value (reject the null) 0.9999 0.9999 0.9999 Shapiro Francia Z 4.966 6.565 4.385 P-value(reject the null) 0. 9999 0.9999 0.9999
Variable legend. Fatad97: Net sales per employee in 1997; Dhsk: Demand for high skilled workers in 1997; Cap: capacity utilisation in 1997.
Tab A1.2 The effect of ICT investment on intermediate and productivity variables
Demand for high skilled workers (l.c. Tobit) Introduction of new products Introduction of new products and processes Capacity utilisation (r.c.Tobit)
Net sales per employee (conditional mean)
Net sales per employee (conditional median)
Coef. b.s.e.♦ Coef. z Coef. Z Coef. b.s.e. ♦ Coef. b.s.e.♦ Coef. b.s.e.♦ Scala -0.002 0.004 0.087 0.31 0.152 0.55 - 2.665 1.576 21.666 78.320 - 64.817 35.565 Special 0.0004 0.004 0.356 1.26 0.163 0.59 - 1.538 1.580 11.334 74.819 - 47.177 37.296 Tradiz - 0.008 0.004* - 0.121 - 0.43 - 0.141 - 0.51 - 3.331 1.555 6.034 70.330 - 45.919 40.119 Novest 0.009 0.004** 0.054 0.31 - 0.075 - 0.42 - 1.243 1.141 27.020 57.137 - 6.571 27.458 Nest 0.013 0.005* - 0.064 -0.33 - 0.252 - 1.28 - 1.088 1.236 31.056 90.327 -19.372 27.297 Sud 0.001 0.006 - 0.052 - 0.20 0.077 0.29 - 4.102 1.728** - 127.675 99.829 -21.342 31.217 Size 0.000001 0.000003** 0.0002 1.72 0.002 1.86 0.002 0.001** 0.001 0.035 0.013 0.019 Birth -0.00005 0.00005 0.002 0.93 0.004 1.42 -0.047 0.019** - 0.093 0.699 - 0.202 0.298 Export 0.012 0.005** 0.323 1.98 0.229 1.35 0.019 1.009 - 125.039 108.294 19.991 21.523 Group 0.016 0.003** - 0.074 - 0.53 0.144 1.09 0.072 0.792 64.302 29.655* 38.224 15.219** Subsidy -0.003 0.004 - 0.562 - 1.92 - 0.654 - 2.26 1.849 1.836 0.073 50.814 3.421 29.887 Agevol 0.013 0.005** 0.773 2.61 0.951 3.27 -1.450 1.810 - 111.204 63.409* - 21.300 29.959 Lev 0.001 0.006 - 0.390 - 1.16 - 0.201 - 0.58 6.354 2.254** 608.855 174.171** 220.900 45.383** Innovat 0.001 0.003 - 1.420 0.950 -7.295 37.403 - 13.553 23.448 Rdinv 0.004 0.002 0.963 8.13 0.931 7.50 - 0.861 0.772 47.222 52.118 - 24.924 13.405* Qlwsk 0.410 0.217** 4.765 1.18 2.697 0.95 - 25.219 23.051 253.843 1051.665 1384.187 1014.63* Capad - 0.00001 - 0.00001 -19.62 - 0.001 - 24.74 0.0001 0.003 3.725 1.608** 1.226 0.184** Amm 0.002 0.008 1.376 2.246 Itxasof 0.0008 0.0005** - 0.025 - 0.66 - 0.019 - 0.51 0.043 0.145 56.410 33.748* 13.771 7.851** Itxahar - 0.074 - 2.68 - 0.037 - 2.31 -0.049 0.144 - 2.542 16.293 - 1.702 7.394* Itxatel 0.004 0.004 0.401 0.259 0.777 3.26 - 1.829 1.597 - 118.225 82.019* - 10.341 20.936 Itxtelg - 0.003 0.004* 1.042 2.36 2.814 1.806** Cons -0.063 -6.67** - 1.222 - 3.25 - 1.649 - 4.34 - 156.309 225.094* 163.842 52.373** χ2 222.6 Wald Wald 58.41 F 2.47 R sq. - 0.45 0.10 0.10 0.01 0.22 0.10 N. of obs 1420 1497 1497 1454 957 957
♦ Bootstrap standard error
** significant at 95% under the bias-corrected and percentile approach adopted to compute confidence intervals. * significant at 95% under the bias-corrected approach adopted to compute confidence intervals.
- not included for multicollinearity problems. For industry legend see tab. 2. Industry dummy results are omitted and available upon request.
27
Appendix 2 (not to be published) - Detailed results of stochastic frontier estimates at industry level)
The first equation is a five input Cobb-Douglas production function and is specified as follows:
it it it it it it it
K
L
RM
II
v
u
Y
=
+
+
+
+
+
−
4
3
2
1
0
β
β
β
β
α
(1).Y is the log of real output of the ith firm at time t (i=1,...,N; t=1,...,T); K is the log of the capital stock evaluated at the replacement cost, L, RM and II represent additional inputs (and are respectively the log of the number of workers, raw materials and intermediate inputs). The vit are
random variables which are assumed to be iid. N(0,σV2), and independent of the uit . The latter are
non-negative random variables which are assumed to account for technical inefficiency in production and are assumed to be independently distributed as truncations at zero of the N(mit,σU2)
distribution where mit = zitδ, (2), zit is a p×1 vector of variables which may influence the
efficiency of a firm; and δ is an 1×p vector of parameters to be estimated.Following Battese and Coelli (1993), we replace σV2 and σU2 with σ2=σV2+σU2 and γ=σU2/(σV2+σU2). The log-likelihood
function of this model is described in Battese and Coelli (1993).The nonzero mean residual of the production function is regressed on a series of factors which are expected to affect efficiency:
it k k n k it
ICT
Cap
Innovat
esfi
nts
Ration
CSSA
Family
Qtnosep
Csat
Group
Old
Young
Macroarea
u
ε
δ
δ
δ
δ
δ
δ
δ
δ
δ
δ
δ
δ
δ
γ
α
+
+
+
+
+
+
+
+
+
+
+
+
+
+
+
+
=
∑
− = 13 12 11 10 9 8 7 6 5 4 3 2 1 1 1 0Pr
Re
(2)where RENTS = ((profits before tax+depreciation+interest payments-cost of capital*capital stock)/value added) and PRESFI = interest payments/ (interest payment + cash flow). IND,
MACROAREA, SIZE, GROUP, QTNOSEP and FAMILY are specified as in Appendix 1. OLD, YOUNG respectively picking up the older and the younger 20 percent of sample firms. CSAT and CSSA, two dummies respectively picking up firms monitoring customer’s satisfaction and firms
28
which created sale structures abroad. INNOVAT is a dummy for firms which succesfully introduced new products or processes. Finally, ICT is the average ICT investment per employee.
29
Tab. A2.1 ICT investment and productive efficiency: a stochastic frontier estimate (1997 cross-section estimate) Food and Beverages
Production Function Variables Technical Efficiency Variables Coef. t-ratio Coef. t-ratio Constant 4.635 6.571 Constant 0.150 0.164 Ln(K) 0.227 1.901 North-west -0.001 -0.002 Ln(L) 0.432 0.500 North-east 0.211 0.238 Ln(raw materials) 0.057 1.956 South 0.058 0.088 Ln(Intermediate products) 0.087 3.295 Young -0.053 -0.063 Old -0.151 -0.274 Group -0.189 -0.174 Csat -0.127 -0.184 Qtnosep -0.012 -0.768 Family 0.056 0.058 CSSA -0.116 -0.152 Ration -0.154 -0.136 Rents -0.006 -0.017 Presfi -0.135 -0.121 Innovat 0.253 0.335 Cap 0.150 0.164 ICT 0.009 0.277 Sigma-squared 0.299 4.266 Gamma 0.149 2.780 Log L 1.341E+08 N of obs 179