Spatial diffusion and temporal evolution
of PCDD/Fs, PCBs and PAHs congener
concentrations in the ambient air of
Taranto: an analysis based on the duality
diagram approach
Alessio Pollice
Dipartimento di Scienze Statistiche ”Carlo Cecchi”
Universit`a degli Studi di Bari ”Aldo Moro”
Vittorio Esposito
Dipartimento di Taranto - Polo di Specializzazione Microinquinanti ARPA Puglia
Abstract: Dioxins and dioxin-like compounds are byproducts of industrial pro-cesses, commonly regarded as highly toxic persistent organic pollutants. Polycyclic aromatic hydrocarbons occur in oil, coal, and tar deposits and are produced as byproducts of fuel burning, coke-making, and metal smelting. We propose an anal-ysis of the spatial diffusion and temporal evolution of 46 congeners, based on monthly concentration data for the period October 2008 - December 2010 at three monitor-ing stations. Given the high dimensionality of the data, a descriptive strategy was adopted based on the duality diagram approach, a unifying framework including classical multivariate statistical methods that has become a valuable tool for com-bining data collected from different sources and using different methods.
Keywords: Air quality, Duality diagram, Multiple factor analysis
1
Introduction
Dioxins, dioxin-like compounds and polycyclic aromatic hydrocarbons are of concern because some compounds have been identified as carcinogenic, mutagenic, and ter-atogenic. The urban district of Taranto sits in close proximity to an industrial area where several large combustion plants are located, including an integrated cycle steel plant, an oil refinery, three waste incinerators, two power plants, and cement-works.
2
Materials and Methods
We propose an analysis of the spatial diffusion and the temporal evolution of 46 con-geners split into five groups (PCDD, PCDF, PCB, LPAH, HPAH), based on monthly concentration data for the period October 2008 - December 2010 at three monitoring stations located within the industrial area (MA) and in a traffic/background area (AA and TA). Given the high dimensionality and multicollinearity of the available data, a descriptive strategy was adopted to obtain a synthesis of the spatio-temporal behavior and of the relationships between congeners. The duality diagram approach is a unifying framework including many classical multivariate statistical methods and less well-known recently developed tools for combining data collected from different sources and taking advantage of complex data types (Thiolouse, 2011). Within the
K -table methods class, Multiple Factor Analysis (MFA) studies several groups of
variables defined on the same set of observations and weights each group to achieve a joint representation of individuals and variables inducing a global representation
of the groups of interest (Escoufier and Pag´es, 1994). Weighting of variables groups
is necessary to make the influence of each group comparable in a global analysis. MFA produces a display in which representations of the set of individuals associ-ated to each group of variables are superposed. A global representation of groups of variables is obtained, in which each group is represented by the scalar product matrix it defines on the set of individuals. MFA search for factors which are com-mon to several groups of variables is addressed by first setting up general variables, each one related to all the groups, and then searching for the canonical variable in each group for each variable. Each group defines a structure on the individuals set expressed by the shape of a cloud. A superposed representation which sets up the structure common to the different clouds is obtained in order to compare clouds one to another. A display in which each group is represented by one point allows to get a global comparison of groups.
The first step (interstructure) provides the coefficients of a special linear com-bination of the data tables, leading to an optimal summary called “compromise”. The second step computes the PCA of this linear combination. The third step (intrastructure) is a projection of the rows and columns of each table into the multi-dimensional space of the compromise analysis. Functions implementing the methods used in this case-study are contained in the library ade4 of the statistical computa-tion environment R (Dray et al., 2007).
3
Results
MFA is applied to the available data considering 15 groups of variables obtained crossing the 3 monitoring stations with the 5 groups of congeners. The first two principal components of the compromise account for 54% of the total inertia. With such a complex data structure this amount is considered sufficient for exploring the main features of the data. The behavior of the subsequent principal components
MA_PCDD MA_PCDF MA_PCB MA_LPAH MA_HPAH AA_PCDD AA_PCDF AA_PCB AA_LPAH AA_HPAH TA_PCDD TA_PCDF TA_PCB TA_LPAH TA_HPAH component projection MA_PCDD MA_PCDF MA_PCB MA_LPAH MA_HPAH AA_PCDD AA_PCDF AA_PCB AA_LPAH AA_HPAH TA_PCDD TA_PCDF TA_PCB TA_LPAH TA_HPAH Eigenvalues d = 2 Oct_08 Nov_08 Dec_08 Jan_09 Apr_09 May_09 Jun_09 Jul_09 Aug_09 Sep_09 Oct_09 Nov_09 Dec_09 Jan_10 Feb_10 Mar_10 Apr_10 May_10 Jun_10 Jul_10 Aug_10 Oct_10 Dec_10
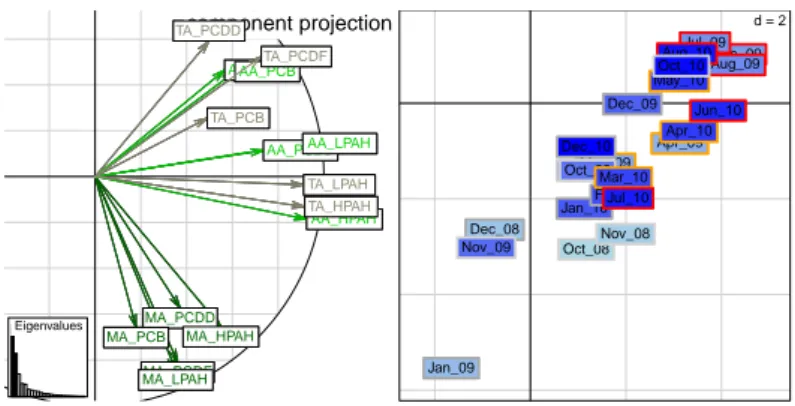
Figure 1: Left, projection of the principal components of each table on the
com-promise. Right, projection of the 23 observations on the compromise principal
axes. Labels with darker background color for most recent time points are framed according to the season (red=Summer, orange=Spring, light grey=Autumn, dark grey=Winter).
(not reported) does not add any relevant information to the results obtained by the observation of the first two.
In Fig. 1, Left the industrial MA monitoring station appears to be quite separate from AA and TA (traffic/background). For the latter two, PAH’s behave differently from all other congeners. A general seasonality can be seen in Fig. 1, Right with Spring/Summer observations in the top-right corner and Autumn/Winter on the opposite side.
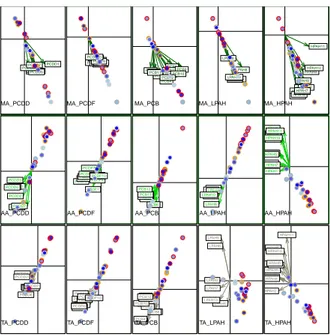
Some more insights can be gained by looking at the biplots of each table in Fig. 2. For the MA monitoring station we observe a reduction in PCDD/F’s and an increase od HPAH’s. An overall reduction of the 46 congeners is registered at AA, while PAH’s show a more evident decrease at TA. A stronger evidence of seasonal congener concentration decrease is found for PAH’s at AA and TA.
4
Concluding remarks
Evidence of proximity to pollution sources is gained for the MA monitoring station given both the less pronounced seasonality, compared to AA and TA, and the con-trasting trend of different pollutant groups, where PCDD/F show a general decrease while HPAH’s are increasing over time. Industrial sources appear to be a major con-tributor to PAH pollution for MA compared to civil sources like traffic or domestic heating. While experiencing the impact of a comparable amount of road traffic, the MA station, where civil and industrial sources mix, has markedly different congener relationships compared to AA and TA.
PCDD1 PCDD2 PCDD3 PCDD5 PCDD4 PCDD6 PCDD7 MA_PCDD PCDF1 PCDF5 PCDF4 PCDF6 PCDF2 PCDF3 PCDF7 PCDF8 PCDF9 PCDF10 MA_PCDF PCB1 PCB2 PCB3 PCB4 PCB5 PCB6 PCB7 PCB8 PCB9 PCB10 PCB11 PCB12 MA_PCB LPAH4 LPAH5 LPAH6 LPAH7 LPAH8 LPAH10 MA_LPAH HPAH1 HPAH2 HPAH3 HPAH4 HPAH5 HPAH6 HPAH7 HPAH8 HPAH9 HPAH10 HPAH11 MA_HPAH PCDD1 PCDD2 PCDD3 PCDD4 PCDD5 PCDD6 PCDD7 AA_PCDD PCDF1 PCDF2 PCDF3 PCDF4 PCDF5 PCDF6 PCDF7 PCDF8 PCDF9 PCDF10 AA_PCDF PCB1 PCB2 PCB3 PCB4 PCB5 PCB6 PCB7 PCB8 PCB9 PCB10 PCB11 PCB12 AA_PCB LPAH4 LPAH5 LPAH6 LPAH7 LPAH8 LPAH10 AA_LPAH HPAH1 HPAH2 HPAH3 HPAH4 HPAH5 HPAH6 HPAH7 HPAH8 HPAH9 HPAH10 HPAH11 AA_HPAH PCDD1 PCDD2 PCDD3 PCDD4 PCDD5 PCDD6 PCDD7 TA_PCDD PCDF1 PCDF2 PCDF3 PCDF4 PCDF5 PCDF6 PCDF7 PCDF8 PCDF9 PCDF10 TA_PCDF PCB1 PCB2 PCB3 PCB4 PCB5 PCB6 PCB7 PCB8 PCB9 PCB10 PCB11 PCB12 TA_PCB LPAH4 LPAH5 LPAH6 LPAH7 LPAH8 LPAH10 TA_LPAH HPAH1 HPAH2 HPAH3 HPAH4 HPAH5 HPAH6
HPAH7 HPAH9 HPAH8 HPAH10 HPAH11
TA_HPAH
Figure 2: Biplots of the 15 tables (rows projected on the principal axes, columns projected on the principal components of the compromise). Dots with darker color for most recent time points are circled according to the season (red=Summer, or-ange=Spring, light grey=Autumn, dark grey=Winter).
References
Dray S., Dufour A.B., Chessel D. (2007) The ade4 Package - II: Two-table and K-table Methods, R News, 7 (2).
Escoufier B., Pag´es J. (1994). Multiple factor analysis (AFMULT package).
Com-putational Statistics and Data Analysis, 18, 121-140.
Thioulouse J. (2011) Simultaneous analysis of a sequence of paired ecological tables: a comparison of several methods, Annals of Applied Statistics, to appear.