Fault2SHA Central Apennines
database and structuring active
fault data for seismic hazard
assessment
Joanna Faure Walker
1✉, Paolo Boncio
2, Bruno Pace
2, Gerald Roberts
3, Lucilla Benedetti
4,
Oona Scotti
5, Francesco Visini
6& Laura Peruzza
7We present a database of field data for active faults in the central Apennines, Italy, including trace, fault and main fault locations with activity and location certainties, and slip-rate, slip-vector and surface geometry data. As advances occur in our capability to create more detailed fault-based hazard models, depending on the availability of primary data and observations, it is desirable that such data can be organized in a way that is easily understood and incorporated into present and future models. The database structure presented herein aims to assist this process. We recommend stating what observations have led to different location and activity certainty and presenting slip-rate data with point location coordinates of where the data were collected with the time periods over which they were calculated. Such data reporting allows more complete uncertainty analyses in hazard and risk modelling. The data and maps are available as kmz, kml, and geopackage files with the data presented in spreadsheet files and the map coordinates as txt files. The files are available at: https://doi. org/10.1594/PANGAEA.922582.
Background & Summary
Presenting a new conceptual framework to gather fault data useful for SHA (seismic hazard assessment) was identified as a key challenge by the Fault2SHA Working Group (http://fault2sha.net/)1, established within the
European Seismological Commission (ESC) in 2016. To improve fault-based SHA, field geologists should provide the relevant observations, analysts should interpret field data appropriately2, and the full range of uncertainties
associated with the characterization of faults should be correctly understood and propagated in computations3.
To overcome the barriers that exist for the above, due to the different experience and expertise of participants, we, the Fault2SHA Central Apennines Laboratory, have brought together representatives from research groups across multiple institutions comprising field geologists, seismic hazard modellers and practitioners to create the Fault2SHA Central Apennines Database4.
Fault geometries and associated slip-rates are critical in determining earthquake locations and occurrence rates2,3,5
in SHA: we acknowledge that including these data is key to improving earthquake hazard and risk estimates. Currently, most hazard models rely principally on historical earthquake rates, but these may not be representa-tive of longer term rates (either overestimating or underestimating as typical recurrence intervals may be hun-dreds to many thousands of years yet historical records are rarely complete for more than a few hundred years), resulting in a bias in the probability and/or the potential magnitude of earthquakes (e.g. 2011 Great East Japan Earthquake, 2010 Haiti Earthquake3). For example, in the central Italian Apennines, where average recurrence
intervals on individual faults range from a few hundred to several thousand years6–9, there are discrepancies
1UCL IRDR, Institute for Risk and Disaster Reduction University College London, Gower Street, London, WC1E 6BT,
UK. 2DiSPUter Department, Università degli Studi G. d’Annunzio chieti e Pescara, chieti, italy. 3Department of
Earth and Planetary Sciences, Birkbeck College, Malet Street, London, WC1E 7HX, UK. 4Aix-Marseille Université,
CEREGE CNRS-IRD UMR 34, Aix en Provence, France. 5Bureau d’Evaluation des Risques Sismiques pour la Sûreté des
Installations, IRSN, Fontenay-aux-Roses, France. 6INGV - Istituto Nazionale di Geofisica e Vulcanologia, Pisa, Italy. 7National Institute of Oceanography and Applied Geophysics - OGS, Borgo Grotta Gigante 42/C, 34010, Sgonico
(trieste), italy. ✉e-mail: [email protected]
DATA DESCrIPTOr
in strain-rates calculated within areas of approximately 2,000 km2 using measurements of 15 ± 3kyr long-term multi-seismic-cycle fault offset data and strain-rates calculated using a 700-year-long historical earthquake record (magnitude of completeness, Mc ≥ Mw5.6 since 134910)11. Such discrepancies arise because relying on historical
earthquake records alone will omit contributions from faults capable of hosting large earthquakes that have not ruptured during the historical record. An enlightening example is the Mt Vettore Fault which hosted the 2016 central Apennines earthquakes that killed three hundred people12,13–18; this fault had not ruptured within the
historical record, but prior to 2016 it was a mapped fault with palaeoseismic evidence of rupture19,20.
In recognition of the need to include long-term slip-rate data, fault-based hazard models have been developed (California21, Italy22, Greece23). Proprietary and open-access tools have been created to help researchers with such
endeavours24–29. The most commonly used tools infer maximum magnitudes of earthquakes on individual faults
from empirical relationships e.g.30 and use fault slip-rates to determine average earthquake recurrence rates.
These fault-based hazard models are progressing to include more detail and complexity29. The Mw7.8
Kaikoura, New Zealand, earthquake31 highlighted that complex rupture scenarios occur including partial
and multi-fault ruptures. Variable fault geometry has been shown to influence ground-shaking intensities32.
Slip-rates, identified as a key source of uncertainties in earthquake probability calculations21,33, both coseismic
and long-term, can vary significantly along the length of a fault15,32,34; utilising detailed multi-point slip-rate data
(rather than a single value) can change calculated earthquake rates beyond that expected by intrinsic natural variability32,34. Efforts at improving in the provision of data are being made e.g.35; however, current seismic source
datasets (e.g. https://www.seismofaults.eu/,36) generally do not provide sufficient detail in mapped traces and
slip-rate data to include the above, and do not give guidelines on how to aggregate mapped structures into a seismic source; this limits the interrogation of alternative rupture scenarios and the inclusion of detailed fault geometry and slip-rate profiles.
Herein, we present a recommended database format with trace, fault and main fault maps using the central Italian Apennines as our prototypal area. The data can be easily incorporated into fault-based SHA calculations37,
consistent with FAIR principles38, and the schema can be adapted for other regions. Included slip-rate data should
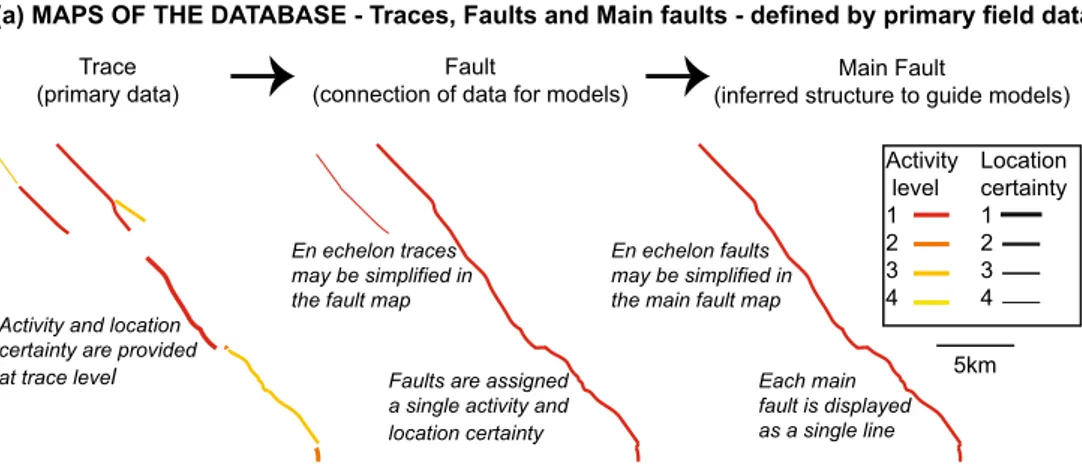
have published coordinates and time caps. The advantages this database brings are that (1) trace-level data shows local map confidence, (2) the fault map allows modellers to interrogate different seismic rupture scenarios involv-ing partial or multi fault ruptures, (3) the main fault map guides towards seismic sources, and (4) the provision of point data allows freedom for different interpolations of slip-rates and geometry (Fig. 1).
Methods
The database provides separate maps at the trace, fault and main fault scale (see following sections for definitions and Fig. 2 for the maps) and provides tables with associated properties for these three resolutions of mapping (see Fig. 3 for a list of fields in each table). The database further provides point level data for local geometry and slip rates including the techniques used for their measurement, the original coordinate systems used for the locations, and the reference from which the data was obtained (Fig. 3). The maps and accompanying data have been assem-bled from the literature, with some new work contributing to the maps. We aim to include all faults in the region with evidence of Late Pleistocene - Holocene activity.
Trace, Fault and Main Fault Maps.
In the central Apennines database, we have defined 43 or 44 individual main faults (depending on main fault selection chosen, selection is made from a choice of 49 main faults, but only 43 or 44 are independent) made up of 87 faults which are discretised into 312 traces.Traces. Traces report data at the primary level, with the location certainty and activity scale being defined at this
level. The extent of a trace is determined by the distance over which the criteria for determining location certainty and activity remain the same. There are no length restrictions for trace-level mapping. The trace-level mapping is envisioned to be of interest to those collecting primary data in the field including those wanting to undertake high-resolution structural studies. Trace-level mapping is of interest for fault displacement hazard, where the detail of fault mapping is of primary importance. This detail of mapping allows end-users to identify what evi-dence has been used to define the trace location certainty and activity certainty at this scale and hence how the lower resolution mapping location and activity certainties have been determined.
The trace map and table data have been created using a combination of published papers including capable fault maps6,8,11,15,17,22,32,39–44, (http://sgi2.isprambiente.it/ithacaweb/Mappatura.asp), published geological maps45–55,
(https://www.isprambiente.gov.it/Media/carg/index.html) and further publications including palaeoseismologi-cal trench site data, macroseismic earthquake data, geomorphologipalaeoseismologi-cal and geologipalaeoseismologi-cal observations, seismic pro-filing, air photographs, LiDAR and InSAR7–9,15,16,19,56–97, new fieldwork, and new DEM and aerial photography
interpretation.
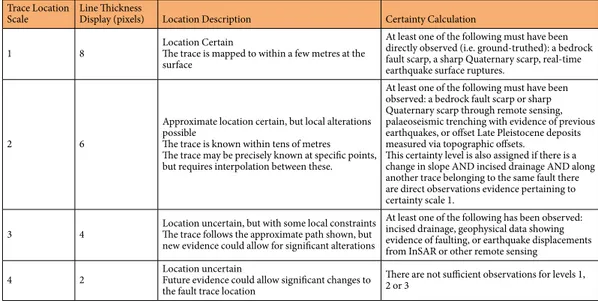
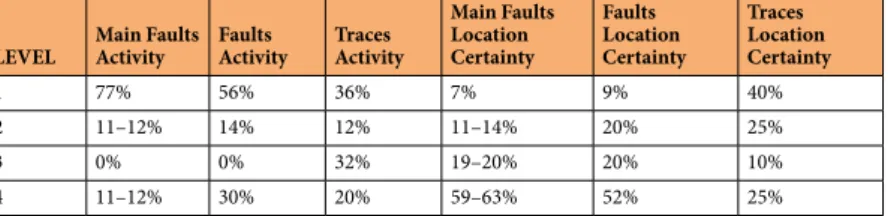
The traces are displayed according to their location certainty scale (how precisely their location is known conveyed by varying line thickness) and activity scale (the degree of evidence for tectonic displacement along the trace during the Holocene-Late Pleistocene conveyed via different coloured lines); see Tables 1 and 2 for obser-vations leading to the location and activity scales for individual traces. Each scale has four levels, with 1 denoting the highest confidence and 4 the lowest. The “Trace” table includes the trace attributes so that the calculation of location and activity certainty can be traced back to the primary observations that describe this in the database.
The “trace location” certainty is greatest for level 1 location where the fault trace is certain within a few metres at the surface and confirmed during field investigations evidencing Late Pleistocene - Holocene displacement. Level 2 location represents traces known within a few or tens of metres, so local uncertainty in the mapped position of the trace is possible; the trace may be constrained precisely at particular points (e.g. by palaeoseis-mic trenches or geophysical observations) but not continuously and thus some parts require local interpolation. Level 3 location traces have location uncertainty, but have some local constraints such that the trace follows the
Activity and location certainty are provided at trace level
En echelon traces may be simplified in the fault map
Each main fault is displayed as a single line
(a) MAPS OF THE DATABASE - Traces, Faults and Main faults - defined by primary field data
Main Fault
(inferred structure to guide models) Fault
(connection of data for models)
(b) MODELS USING THE DATABASE - Seismic source geometries - requires some judgement Trace
(primary data)
5km
5km
Gap the modeller retains not significant for earthquake rupture
Gap the modeller retains significant for earthquake rupture Models may use
the Main Fault and/or Fault maps from the database
plane projection of fault planes
Main Fault Map
(from database) 3D extrapolation fromsurface data SeismogenicSources
Main fault the modeller judges as having an insufficient activity certainty Some models allow multi-fault ruptures with defined constraints such as a distance criteria of <5km. Modeller can decide which faults to incorporate
based on activity and location certainty
The modeller decides how to interpolate
point data
Slip rate data is provided
with point
locations Some models allow a variable slip-rate
Slip rate data
(from database) Model capabilities and modeller decisions along seismic sourcesSlip rate profiles
(c) MODELS USING THE DATABASE - Slip rate profiling Activity level 1 2 3 4 En echelon faults may be simplified in the main fault map Faults are assigned
a single activity and location certainty
5km
Distance along fault Distance along fault
Slip-rate Slip-rate Activity level 1 2 3 4 Location certainty 1 2 3 4 Location certainty 1 2 3 4
Fig. 1 From primary data to modeller decision making. (a) An example showing the relationship between
traces, faults and main faults. In the trace, fault and main fault maps, the thicker the line, the higher the location certainty and the colour shows the activity certainty (red, dark orange, light orange, yellow show levels 1, 2, 3 and 4 respectively) – see Tables 1 and 2 for details. (b) An example of how a modeller may turn main faults in the database into seismic sources using a multi-fault rupture model and a minimum activity certainty level criterium for inclusion; in this example, the maximum extent of ruptures across multiple faults is determined using a distance between faults criteria. Blue text signifies modelling decisions, black text represents information directly from the database. Locations affected by such modeller decisions are shown with blue ovals with the parts of the faults affected shown in blue. Note a modeller can alternatively choose to use the fault map to create alternate rupture scenarios. (c) An example of how a modeller may interpolate the point level slip-rate data for inclusion in a fault-based seismic hazard model.
approximate path shown with evidence for a local fault but not locating the trace precisely (i.e. not continuously within a few or tens of metres), new evidence could allow for significant alterations. Level 4 represents the lowest level of certainty in location, the location is uncertain by tens of metres or more and there could be significant alterations in future versions of the fault map. Table 1 provides the full criteria for certainty levels at each location. All traces included in the map have some geologic or geomorphic evidence of activity, however not all have this constrained to the Late Pleistocene - Holocene with certainty (see Table 1 for details).
The “trace activity” criteria have been inspired by the classification schemes in previous works39, however
we have identified specific requirements among criteria listed within the database so that users can see where the scale values have come from and what observations have been made along each trace (see Table 2). Level 1 represents traces that have displacement during the Late Pleistocene – Holocene that has been dated at points along the trace. There must be dated evidence of tectonic surface ruptures during historical or contemporary rupture. Therefore, at least one of the following must have been observed for a trace to be assigned activity level 1: ground-truthed real-time earthquake surface ruptures, earthquake displacements from InSAR or other remote sensing, a palaeoseismic trench with evidence of tectonic offsets that have date constraints (this can include pal-aeoseismic trench site dating techniques that rely on in situ samples that are geochemical matches, for example tephrachronology), or cosmogenic dating providing evidence of tectonic offsets within the Late Pleistocene - Holocene. Level 2 activity has evidence of Late Pleistocene displacement with dates inferred from regional level dating, but without in situ dated Late Pleistocene - Holocene displacement. For example, a scarp profile showing offsets features that have regional dating constraints. Level 3 activity for a trace is assigned where there is geologic
Trace Location
Scale Line Thickness Display (pixels) Location Description Certainty Calculation
1 8 Location CertainThe trace is mapped to within a few metres at the
surface
At least one of the following must have been directly observed (i.e. ground-truthed): a bedrock fault scarp, a sharp Quaternary scarp, real-time earthquake surface ruptures.
2 6
Approximate location certain, but local alterations possible
The trace is known within tens of metres The trace may be precisely known at specific points, but requires interpolation between these.
At least one of the following must have been observed: a bedrock fault scarp or sharp Quaternary scarp through remote sensing, palaeoseismic trenching with evidence of previous earthquakes, or offset Late Pleistocene deposits measured via topographic offsets.
This certainty level is also assigned if there is a change in slope AND incised drainage AND along another trace belonging to the same fault there are direct observations evidence pertaining to certainty scale 1.
3 4 Location uncertain, but with some local constraintsThe trace follows the approximate path shown, but new evidence could allow for significant alterations
At least one of the following has been observed: incised drainage, geophysical data showing evidence of faulting, or earthquake displacements from InSAR or other remote sensing
4 2 Location uncertainFuture evidence could allow significant changes to
the fault trace location
There are not sufficient observations for levels 1, 2 or 3
Table 1. Trace location scale adopted in the database.
Trace Activity
Scale Activity Display Activity Description Activity Calculation
1 Red Dated displacement during Late Pleistocene - Holocene
At least one of the following must have been observed: ground-truthed real-time earthquake surface ruptures, earthquake displacements from InSAR or other remote sensing, a palaeoseismic trench with evidence of tectonic offsets that have date constraints, or cosmogenic dating providing evidence of tectonic offsets within the Late Pleistocene - Holocene.
2 Dark Orange Evidence of Late Pleistocene - Holocene displacement, but without in situ dated Late Pleistocene Holocene displacement
Local displacement constrained to be within the Late Pleistocene – Holocene through regional dating constraints: a scarp profile showing offsets features that have regional dating constraints (Late Pleistocene - Holocene age constraints) but that have not been dated specifically along the trace (scarp profiles that offset Late Pleistocene-Holocene).
3 Light Orange
Geologic (displaced Middle Pleistocene deposits) or geomorphic evidence of potential fault activity, but this has not been confirmed as Late Pleistocene. The trace is on the same fault as a trace with activity (1) or (2).
Criteria needed for activity (1) or (2) are present for a different trace belonging to the same fault, but not present on this trace.
4 Yellow
Geologic (displaced Middle Pleistocene deposits) or geomorphic evidence of potential fault activity, but this has not been confirmed as Late Pleistocene
There are not sufficient observations for levels 1, 2 or 3. Table 2. Trace activity scale adopted in the database.
Rome Naples 12o 13o 14o 15o (a) (d) (c) Figure (b,c,d ) Key for (b), (c), (d)
Activity scale 1 Location Certainty 1 Activity scale 2 Location Certainty 2 Activity scale 3 Location Certainty 3 Activity scale 4 Location Certainty 4
Slip vector azimuth measurement Slip rate measurement site
Strike, dip, slip vector measurement site
43o 42o 41o Main Faults 100km Faults
Boundary of database area Boundary of database area
(b) Traces
Boundary of database area Avezzano L’Aquila Avezzano L’Aquila Avezzano L’Aquila
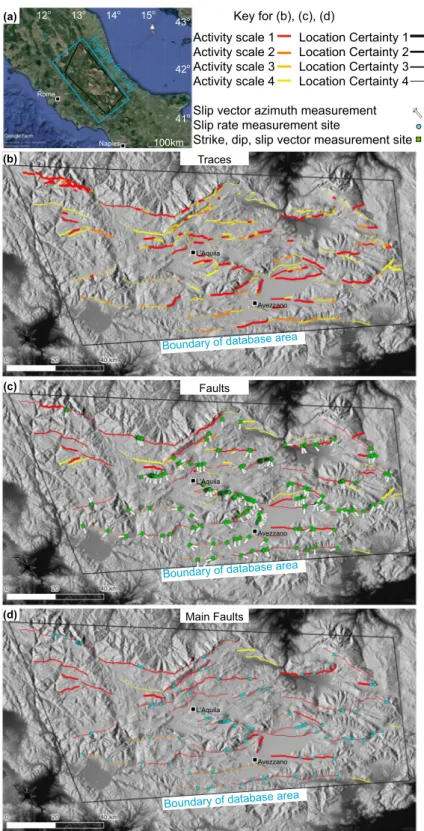
Fig. 2 Location maps showing the traces, faults and main faults in the database. (a) Location map, (b,c,d) maps of the geographical area covered by the database showing the individual traces (b), faults (c), and main faults (d). The MainFaultOption choices shown are A1, B1 and C1 (see MainFaultSelection table for explanation). The thickness of the lines signifies the certainty in the trace location (thickest = most certain, see “traceLocationScale” for detailed explanation). The colours of the lines signify the certainty in there being earthquake activity during the Late Pleistocene – Holocene (hierarchy of highest to lowest certainty is red, dark orange, light orange, yellow) see “traceActivityScale”. Faults are drawn with the lowest traceLocationScale and highest traceActivityScale of the traces they comprise. Main faults are drawn with the lowest faultLocationScale and highest faultActivityScale of the faults they comprise. The sites of local surface strike, dip and or slip vector azimuth and plunge within the LocalGeometryKinematics table are shown in (c) as a green diamond with measured slip vector azimuths recorded in the database shown as arrows. The locations of slip-rate and/or throw-rate measurements from the SlipRate table are shown in (d) as blue circles. Imagery is from GoogleEarth and DEM from TINITALY102.
(displaced Middle Pleistocene deposits) or geomorphic evidence of potential fault activity, but this has not been confirmed as Late Pleistocene - Holocene, this can represent traces where the trace is on the same fault as a trace with activity 1or 2, but itself does not meet the criteria for activity level 1 or 2. Level 4 activity traces have geologic (displaced Middle Pleistocene deposits) or geomorphic evidence of potential fault activity, but this has not been confirmed as Late Pleistocene - Holocene.
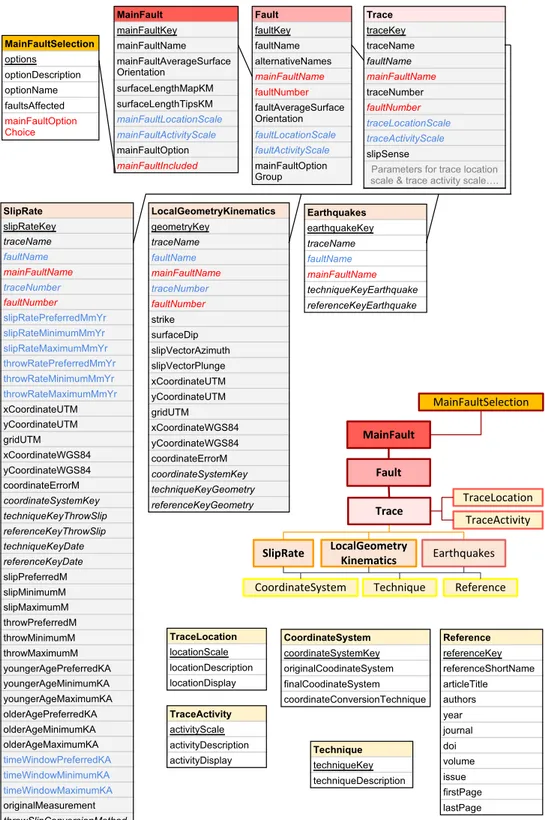
Fig. 3 Database schema showing how different tables relate to each other and the fields within the tables. The unique identifier for each table is underlined. Fields that connect to other tables are in italics. Derived quantities calculated from other fields are shown in blue. Field headings shown in red represent those that change dependent on the main fault option selected. Tables shaded grey have map layers associated with them.
Faults. Faults display how the traces are connected at the surface and/or at depth. How the traces connect to
form faults is based on fault geometry continuation (two traces can start and finish within a few metres from each other or may be kilometres apart), continuation of Late Pleistocene-Holocene offset and total offset across the fault and known earthquake ruptures. In showing how traces are connected, the fault map is of use to those wanting to understand the structures of the region.
All traces belong to one of the faults in the database. However, each fault is represented by a single, contin-uous map line in the “Fault” map, therefore what are interpreted as secondary traces parallel, quasi parallel or branching to the main fault rather than forming a continuation of the fault, interpreted as a branch, splay or other synthetic or antithetic structures do not appear at the “fault” level (see Figs. 1a, 2c,d). Traces may overlap in an en echelon form, in these cases either one or more of the overlapping traces will be excluded from the fault map and/ or adapted so that a single line can be drawn. The single lines allow the faults to be more easily incorporated into models. Within the database, faults have a minimum length of 1 km. Note that faults can contain traces with dif-ferent levels of location and activity certainty. Faults are assigned the highest level of activity among their constitu-ent traces, while they have the lowest level of location certainty from among the constituconstitu-ent traces. This is because if activity can be confirmed along a fault, it is assumed the fault has that activity level and other traces either have not been studied sufficiently or the evidence is not apparent. All traces belonging to a fault contribute to the fault activity score. For the location certainty, only the traces contributing directly to the mapped line are considered (so as to avoid decreasing the certainty due to less well constrained splays, synthetic and antithetic structures).
Main faults. Main faults represent how faults have been interpreted to be linked at depth. Connection of one
or more faults into a single main fault has been inferred using factors such as continuation of surface geometry (fewer constraints than for faults), total offsets across the faults with the total offsets decreasing to zero at main fault tips, surface slip vectors convergence, and laterally-continuous rupture during contemporary, historical and palaeo earthquakes. We recommend that this scale of mapping is useful for input into current seismic hazard models.
In some cases more than one main fault is known to have ruptured in a single earthquake, in such cases, multiple faults across more than one main fault may represent a rupture, such as during the 1915 M 7.0 earth-quake which ruptured the Fucino Ovindoli Pezza, Magnola (or Fucino Magnola), Cerchio Pescina Parasano, and Trasacco main faults comprising (among others), the San Benedetto Dei Marsi, Marsicana Highway, Parasano, Magnola and Trasacco and Luco Dei Marsi faults57,60,69,96. In those cases, the identification and naming of faults
and main faults is guided by both geological and historical literature reasons, in the sense that some faults are left separated as defined and named in the literature, even though they have ruptured contemporaneously in past earthquakes. Therefore, there is no one-to-one relation between faults or main faults and “earthquake segments” within which ruptures are expected to be confined. To allow for different interpretations of seismic sources, modellers may wish to utilise either the main faults (Fig. 2d) or the faults (Fig. 2c). Each main fault is represented by a single, continuous map line in the “main faults” map, therefore the geographic representation of the main fault on the map may differ locally from its constituent faults as some detail is necessarily simplified if there are, for example, en echelon faults, and main faults may comprise synthetic or antithetic faults, but only the main fault line will be displayed at the main fault level map (see Figs. 1a, 2b,c). Within the database, main faults have a minimum length of 5 km. Note that main faults can contain faults with different levels of location and activity certainty. Main faults are assigned the highest level of activity among their constituent faults. Main faults have the lowest level of location certainty from among the constituent faults which form the mapped main fault (excluding synthetic and antithetic faults).
Further considerations for the maps. We recognise that there may be different interpretations of how faults join
to form main faults. Therefore, we have provided three sets of options for particular main faults in order to allow different interpretations to be considered in hazard modelling. For example, the first concerns how the northern end of the San Benedetto Dei Marsi fault continues near Celano. Total fault offsets suggest that the San Benedetto Dei Marsi fault likely joins the Ovindoli Pezza to form a single main fault (herein named Fucino Ovindoli Pezza) as otherwise there would be very sharp decreases in total throw towards Celano43. However, there is no known
direct geologic or geomorphic evidence of continuation of the Ovindoli Pezza fault through Celano town and the Celano paleolandslide or across the Miocene rocks and Lower-Middle Pleistocene continental units around Celano. In addition, interpretation of seismic reflection data could indicate that the total geologic displacement along the San Benedetto Dei Marsi fault goes to zero at Celano85. Therefore, considering the ruptures during
the 1915 Fucino earthquake, we have also provided the option of the San Benedetto Dei Marsi Fault joining the Magnola Fault to form the Fucino Magnola main fault. The second option concerns whether the Frattura and Castel Di Ieri faults connect to form the Scanno main fault or not. The third option concerns connection of faults within the Upper Aterno Valley, specifically whether the Mt Stabiata fault connects to the Paganica and San Demetrio Ne Vestini faults or to the San Pio Delle Camere fault. We suggest that any hazard calculations must consider the alternate hypotheses as there is not a consensus for these main faults.
Providing the three map levels allows users to interrogate how the fault and main fault maps have been built up from the trace level observations. The trace map shows where observations have been made, to what levels of certainty have been achieved, and where gaps in knowledge exist. This differs from the approach of the existing seismogenic fault mapping for the region. ITHACA (ITaly Hazards from CApable faulting) is an Italian database produced by ISPRA (Istituto Superiore per la Protezione e la Ricerca Ambientale) that provides detailed fault traces for capable faults in Italy and surrounding areas (http://sgi2.isprambiente.it/ithacaweb/Mappatura.asp). The ITHACA map aims to include all faults referred to in the literature and provides geological information at a high spatial resolution; however, it does not display how the mapped structures connect and the high detail
– though a highly valuable resource for local study and geological investigations – may be beyond current seismic hazard model capability. Conversely, DISS (Database of Individual Seismogenic Sources)98 provides a lower
res-olution map, which aims to give both single-rupture (individual) or multi-rupture (composite) seismic sources (within DISS a seismogenic source is an existing or hypothesized fault capable of producing magnitude Mw 5.5 and larger earthquakes, but a seismogenic source does not necessarily correspond/coincide with real fault field data). To accomplish the complexities and divergency in data interpretations (shown to be needed by the L’Aquila 2009 and Amatrice 2016 earthquake sequences) DISS now provides a table of “debated” seismogenic sources which comprise faults within the literature for which the authors of DISS do not consider have sufficient evidence, or are “reliable enough” for inclusion in the main database. Despite this, the “seismic sources” in the DISS are inferred simple structures and do not show how faults (and higher resolution traces) have been mapped in the field. The resolution of the data is not at a scale that we advocate as being needed for improving seismic hazard assessments, especially for the case of high-resolution calculations required for critical infrastructure, and it does not allow for modellers to build alternate rupture scenarios through consideration of higher resolution geological structures.
Point data: slip rate, local surface geometry, and kinematics.
Slip rate, local surface geometry and kinematic data were extracted from existing publications9,11,13,17,18,32,40–42,68,80,99,100. The database does notaim to include all data that has been published; for data to be included, it must: (1) have been published in a peer-reviewed journal prior to the publication of the database; (2) have been provided with sufficient location precision for point data location to be recorded (if the coordinates were not published (for example a publica-tion may only show a map with points marked), but the original authors have locapublica-tions recorded, this data can be included in the database; an attempt was made to contact authors for inclusion of such data, but a lack of recorded coordinates prevailed); (3) pass quality control (for example data with better constraints is available for the same location, the less well-constrained data are considered redundant); and (4) slip-rate or throw-rate measurements, either published directly or as slip or throw measurements, must have the time period for the cal-culation recorded. We hope the database will encourage future data to be published with location coordinates so it can be included. The authors of the database recognise that there may be data in the literature that was missed, but ought to have been included, in compiling the database. If readers have data to contribute to the database, we ask that they fill in the “Fault2SHA_CentralAPennines_Database_NewDataForm_2021_v1” and send it to the corresponding author via email with title “Fault2SHA Central Apennines Database New Data Form”. In the form the columns are editable where not reliant on other columns for information, but cells shown in yellow should not be edited. The user will be contacted if further information is required.
We compared the data included from different sources to check whether there was consistency. We found consistency between, for example, slip-rates measured using different techniques which adds to the robustness of the data. For example, along the PianoDiCampoFelice trace of the CampoFelice fault, the Forme trace along the Magnola fault, the ParasanoEast trace along the Parasano fault, the SanSebastianoOrtonaDeiMarsi trace along the San Sebastiano fault, the TrasaccoCollelongo trace along the Trasacco fault, the TreMontiPaterno trace along the Tre Monti fault, and the Fiamignano trace along the ValleDelSalto fault, the slip-rate data in the database measured from topographic offsets are consistent with that reported using cosmogenic dating of the fault scarp8.
Methods used within the database for values within the point data tables. The original values within the SlipRate
and LocalGeometryKinematics tables come from published sources. Within the database, the method used to collect the original data is cited and we direct readers interested in particular values to the original sources. For each method listed in the “Technique” table we provide a short summary. We also state where data have been converted and how – for example slip may be derived from throw data using a nearby measurement of fault dip or plunge as stated.
Creation of gpkg, kmz and xlxs files.
The data tables were compiled using Google Sheets and Microsoft Excel and then extracted as individual csv files. The maps were drawn in GoogleEarth. The map kml files were extracted for use within QGIS, where they were joined to the corresponding data tables. The map lines were assigned colours and thicknesses based on the values in the attributes tables for the activity and location certainty. The geopackage and kml files were then extracted from QGIS and the final kmz was saved within GoogleEarth.Data records
Database availability.
The database including the maps and attribute tables and the data extraction codes for example SHA codes are available at https://doi.org/10.1594/PANGAEA.9225824 in the following formats:Database:
(1) Zipped keyhole markup language (Fault2SHA_CentralApennines_Database_2021_v1.kmz and Fault-2SHA_CentralApennines_Database_2021_v1.kml) file for use in GoogleEarth – these currently display map lines of the main faults, faults, and traces each accompanied by metadata and point locations of slip rate and local geometry and kinematics accompanied by the metadata. The “MainFault” folder contains the individual main fault lines showing how the faults have been interpreted to be connected at depth. The MainFault Option Groups appear as folders and allow one option within each group to be selected to avoid double mapping of any fault. Any fields in the tables within the kml and kmz files which are dependent on the MainFaultOptionChoice have the different possibilities listed within the tables with the options they belong to stated in brackets. The “Fault” folder shows how the traces have been interpreted to be connected. The “Trace” folder comprises the individual traces. See Tables 1 and 2 for the key to the colours and line
thickness. The “Trace”, “Fault” and “MainFault” Table fields associated with each trace, fault and main fault can be accessed by clicking on the trace, fault and main fault name respectively within the folders or clicking on the relevant line on the map. The “SlipRate” and “LocalGeometryKinematics” folders contain map points for each measurement in the database, named according to the trace that the measurement belongs to. The fields from the tables can be accessed through clicking the entry within the list in the folder or the relevant point on the map. We have provided alternate MainFault selection options in the shapefiles. Therefore, only one option from each option group should be chosen when displaying a map at the Main Fault level. This file has been tested in GoogleEarth Pro 7.3.3.7699
(2) Geopackage (Fault2SHA_CentralApennines_Database_2021_v1.gpkg) file compatible with open access GIS programmes containing both the maps and attribute tables for the data in the database. The “Main-Fault”, “Fault” and “Trace” layers contain both the maps of the main faults, faults and traces respectively and their attributes tables. The “SlipRate” and “LocalGeometryKinematics” layers contain both the point locations for the relevant measurements and their attributes tables. The remaining tables (TraceLocation, TraceActivity, Earthquakes, CoordinateSystem, Technique, Reference) appear as attribute tables as no geometry layers. Within the gpkg file, the user will need to select which main faults to display is the Main-Fault layer to avoid duplication of faults (the MainMain-Fault layer contains all the possible main faults). For example, within QGIS 3.8 this can be achieved through selecting the MainFault layer, opening Layer – Lay-er PropLay-erties – Source “QuLay-ery BuildLay-er” and using a quLay-ery to select the desired MainFaults, for example to select option 1 within each group use the query: “mainFaultOption” = 0 OR “mainFaultOption” = ”A1” OR “mainFaultOption” = ”B1” OR “mainFaultOption” = ”C1”. Any fields in other tables which are dependent on the MainFaultOptionChoice have the different possibilities listed within the tables with the options they belong to stated in brackets. This file has been tested in QGIS 3.8.
(3) An excel spreadsheet (Fault2SHA_CentralApennines_Database_2021_v1.xlsb and Fault2SHA_Central-Apennines_Database_2021_v1.xlxs) of the database attribute tables, with each table on a separate tab. Unlike the kml, kmz and gpkg files, the excel sheet allows dynamic updating of the fields dependent on the MainFaultOptionChoice and thus only the current option is displayed. These files have been tested in Excel 16.35 and Excel 2013 respectively. By default, the worksheets other than “MainFaultSelection” are locked, the password is “Fault2SHA”.
(4) Tab delimited text files for the longitude and latitude coordinates of the main fault and fault maps, organised in two zipped folders with each main fault or fault represented by an individual file, with folder names: “Fault2SHA_CentralApennines_Database_MainFaults_lonlat_2021_v1” and “Fault2SHA_CentralApennines_Database_Faults_lonlat_2021_v1”.
Additional files:
(1) An excel spreadsheet (“Fault2SHA_CentralApennines_Database_NewDataForm_2021_v1.xlbs” and “Fault2SHA_CentralApennines_Database_NewDataForm_2021_v1.xlsx) in the format of the database but with most fields empty. This file is available to anyone who would like to propose data to be included in future versions of the database.
(2) A MATLAB script (data2FiSH_2021_v1.m) for extraction of the data from the database in a ready-to-use format for the FiSH code and an accompanying readme text file (README_script_data2FISH_2021_ v1.txt) with instructions for its use. These are contained within the “Data2FiSH_2021_v1” folder along with 2 supporting MATLAB scripts: “utm2deg.m” and “deg2utm.m”.
If the user has compatibility issues with software versions please contact the corresponding author.
Database tables.
Here we provide an overview of the database structure, how the tables are connected and the different fields within each table (Fig. 3).The unique identifier for each table is underlined. Fields that connect to other tables are in italics. Derived quantities calculated from other fields are shown in blue and fields that are dynamic depending on the Main Fault option selection made are shown in red in the database. The type of data within each column is shown in brackets following the name of the column.
MainFaultSelection. The main fault selection table provides the opportunity for the user to select different
pos-sible main fault configurations from the dropdown lists. Main fault options are only provided for where there are alternative configurations, i.e. where there is only one configuration given, there is no option in this table. options (String) – a unique identifier for each available option for main faults where there is more than one main fault configuration provided. Each option is split into a lettered group and within the group each option is given a number, such that each option has a string form of XX, where the first digit is a capital letter pertaining to the group of options and the second digit is an integer referring to the options within that group.
optionDescription (String) – describes the main fault configuration within the option
optionName (String) – provides a descriptive name for the option group, it has the form XXX – X, where “XXX” before the dash represents the name (can be of any length) and the “X” after the dash is the option group letter faultsAffected (String) – lists the different faults that will be affected by the selection made within the option group
mainFaultOptionChoice (Dropdown, String) – this is a dropdown list in which one of the options within the group must be selected. The choice selected here will change the dynamic fields in other tables that are affected by the main fault selection.
MainFault. The main fault table provides a list of the main faults included in the database together with their
strike and main fault-level activity and location certainty scale. Main faults comprise one or more faults. It further shows which main faults are independent of main fault options and which will only be present under particular main fault option selections (see MainFaultSelection table).
mainFaultKey (Integer) – a unique identifier for each main fault
mainFaultName (String) – a unique identifier for each main fault, the name assigned to each main fault in the database, provided in alphabetical order. Names were chosen including consideration of prevalence in the litera-ture and geographic or political fealitera-tures to help identify them.
mainFaultAverageSurfaceOrientation (Integer) – an approximate measure of the strike of the main fault, meas-ured in degrees from north, taken as the angle between the fault tip locations at the surface. Although this value gives an overall gauge of the orientation of the fault, we note that the geometry of individual traces is preferable in modelling and that the fault average strike has uncertainties due to uncertainties regarding the locations of fault tips.
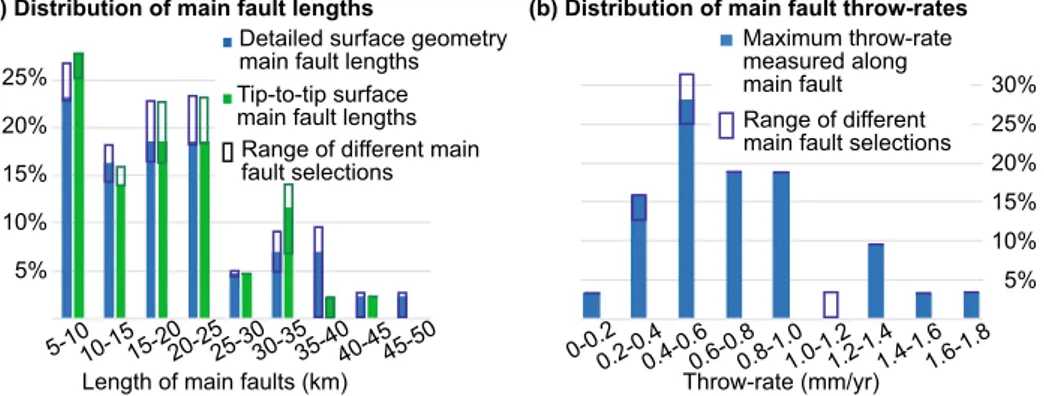
surfaceLengthMapKM (Integer) – Length in km of the main fault measured as the length of the detailed mapped line at the surface (sum of the distances between each coordinate point) along the main main fault (i.e. it does not consider branches, splays, synthetic or antithetic structures etc.)
surfaceLengthTipsKM (Integer) – Length in km of the main fault measured as the length of the line drawn between the two surface tips of the main fault (i.e. it does not consider branches, splays, synthetic or antithetic structures etc.) The surfaceLengthTipsKM will be less than or equal to the surfaceLengthMapKM.
mainFaultLocationScale (Integer) – see TraceLocation table. This provides a gauge on how certain the location of the main fault is. The score is derived from the sections that comprise the fault and is the lowest level of location certainty of the faults that form the main fault (excluding antithetic and synthetic structures not along the main main fault line), in turn the scores of the faults are derived from the trace scores that comprise the fault (excluding antithetic and synthetic structures not along the fault line).
mainFaultActivityScale (Integer) – see TraceActivity table. This provides a gauge on how certain the activity of main fault is during the Late Pleistocene-Holocene. The score is derived from the scores of the faults that com-prise the main fault (including synthetic and antithetic structures), being the highest level of activity of the faults that form the main fault, in turn the activity score of the faults are derived from the traces that comprise them. mainFaultOption (String) – shows whether and which options apply to the main fault. If there is only one option for the main fault, then this field is 0. For main faults which are affected by the main fault option choice, the main fault option which includes the main fault is listed.
mainFaultIncluded (Integer) – This is a dynamic field that shows whether the main fault is included in the cur-rent main fault options selected (1) or not (0). Note this field is not included within the kml, kmz or gpkg files.
Fault. The fault table provides a list of the faults included in the database and the main faults they have been
assigned to. Faults within a main fault can be across strike or along strike from each other. Faults can comprise one or multiple traces.
faultKey (Integer) – a unique identifier for each fault
faultName (String) – a unique identifier for each fault, the name assigned to each fault in the database, provided in the order of the faultName and faultSectionNumber (see below). Names were chosen including consideration of prevalence in the literature and geographic or political features to help identify them. Some main faults com-prise only one fault and hence share the same properties, in these cases the main fault and fault will share a name. alternativeNames (String) – as some faults are referred to (either entirely or in part) by different names within the literature, here we provide a list of common alternative names used to describe the fault. Note that the alternative names may refer to different faults, main faults or traces by different authors too. This list is not exhaustive, but we hope it captures the majority of references to the faults and thus helps readers by identifying where fault names may have changed and to help them when searching for further information on the desired faults.
mainFaultName (String) – this is a dynamic field, see explanation under Main Fault table. Each fault is assigned to a main fault.
faultNumber (String) – this is a dynamic field, each fault is provided with a fault number showing its position along the main fault it has been assigned to. If there is only one fault for a main fault, then the fault number will be 1. Where a main fault has been interpreted as comprising multiple faults, the faults are ordered sequentially from one end to the other (for the central Apennines database this is generally ordered from northwest to southeast). Note there are some examples of main faults where not every fault is considered to be part of the main fault line shown at the surface, for example, the faults may be across strike from each other arranged as synthetic or anti-thetic structures to the main fault at the surface; in such cases the faults are assigned a number in the hundreds to differentiate them from the faults aligned along strike from each other. Note that for faults along strike from each other the main fault line may not simply be the individual sections amalgamated together so as to allow a single line representation of the fault, for example en echelon structures may be simplified.
faultAverageSurfaceOrientation (Integer) – an approximate measure of the strike of the fault, measured in degrees from north, taken as the angle between the fault tip locations at the surface. Although this value gives an overall gauge of the orientation of the fault, we note that the geometry of individual traces is preferable in mod-elling and that the tip-to-tip strike of the fault has uncertainty due to uncertainties regarding the locations of the fault tips.
faultLocationScale (Integer) – see TraceLocation table. This provides a gauge on how certain the location of the fault is. The score is derived from the observations in the Trace table, being the lowest level of certainty of the traces that form the fault (excluding branches, splays, synthetic or antithetic structures).
faultActivityScale (Integer) – see TraceActivity table. This provides a gauge on how certain the activity of fault is during the Late Pleistocene-Holocene. The score is derived from the observations in the Trace table, being the highest level of activity of the traces that form the fault (including branches or splays, synthetic or antithetic structures).
mainFaultOptionGroup (String) – this field shows whether the main fault a fault belongs to is affected by a main fault option. If there is a one to one or many to one mapping from the fault to the main fault then the field appears as “NULL”. However, if there is a many to one or many to many, i.e. that the main fault the fault belongs to can change depending on the main fault option selected, then the main fault option group (a capital letter) is listed.
Trace. The trace table provides a list of individual fault traces, the faults and main faults they have been assigned
to, their location and activity certainty, and the attributes that have been considered to determine these. The traces are provided in the order of the faultName and traceNumber (see below). A trace is the lowest level of observation and is based on primary observations.
traceKey (Integer) – a unique identifier for each trace, presented in increasing integer order.
traceName (String) – a name assigned to each trace to help identify it. A combination of geographical and polit-ical locations as well as natural and man-made features has been used.
faultName (String) – see explanation under Fault table. Each trace is assigned to a fault.
mainFaultName (String) – obtained from fault name, see MainFault table. Each trace is assigned to a fault and each fault is assigned to a main fault.
traceNumber (Integer) – each trace is provided with a trace number showing its position along a fault. If there is only one trace for a fault, then the trace number will be 1. Where a fault has been interpreted as comprising mul-tiple traces, the traces are ordered sequentially from one end to the other (for the central Apennines database this is generally ordered from northwest to southeast). Note there are some examples of faults where not every trace is considered to be part of the main fault, these are still assigned a number, but note the fault may not simply be the individual traces amalgamated together. Traces across strike from the main fault line are assigned a number in the hundreds in order to differentiate them from the main fault line. Traces with the same hundred number are located along strike from each other.
faultNumber (String) – obtained from fault name, see Fault table. Identifies position of fault within main fault. traceLocationScale (Integer) – see TraceLocation table. This provides a gauge on how certain the location of the trace is. The score is derived from the observations in the Trace Table.
traceActivityScale (Integer) – see TraceActivity table. This provides a gauge on how certain the activity of the trace is during the Late Pleistocene-Holocene. The score is derived from the observations in the Trace Table. slipSense (String) – the type of slip experienced in the Late Pleistocene – Holocene along the fault – i.e. normal, strike or reverse
bedrockFaultScarpGroundTruthed (Integer) – a significant proportion of the trace has a bedrock fault scarp exposed, or bedrock fault scarps are exposed at regular intervals along the trace, these have been checked directly (on site). This field is displayed as “1” if the observation has been made and “0” or NULL if not.
sharpQuaternaryTectonicScarpGroundTruthed (Integer) – a significant proportion of the trace has a sharp Quaternary tectonic scarp, or scarps are exposed at regular intervals along the trace, these have been checked directly (on site). This field is displayed as “1” if the observation has been made and “0” or NULL if not.
bedrockFaultScarpIdentifiedThroughRemoteSensingOrSatelliteImagery (Integer) – a significant proportion of the trace has a bedrock fault scarp exposed, or bedrock fault scarps are exposed at regular intervals along the trace, these have been checked through remote techniques, but not necessarily in situ. This field is displayed as “1” if the observation has been made and “0” or NULL if not.
sharpQuaternaryTectonicScarpIdentifiedThroughRemoteSensingOrSatelliteImagery (Integer) – a significant proportion of the trace has a sharp Quaternary tectonic scarp, or scarps are exposed at regular intervals along the trace, these have been checked through remote techniques, but not necessarily in situ. This field is displayed as “1” if the observation has been made and “0” or NULL if not.
changeInSlope (Integer) – there is a change of slope identified along the trace. This can have been identified in situ or through remote techniques such as using a DEM. This field is displayed as “1” if the observation has been
made and “0” or NULL if not.
incisedDrainage (Integer) – incised drainage has been identified along the trace either in situ or via remote tech-niques such as satellite imagery or using a DEM. This field is displayed as “1” if the observation has been made and “0” or NULL if not.
changeInSlopeAndIncisedDrainageAndAlongFaultGroundTruthedScarpOrPrimarySurfaceRuptures (Integer) – a change in slope and incised drainage have been identified along the trace, and on other traces belong-ing to the same fault (only includbelong-ing along-strike traces, i.e. only those with the same hundred number in the trace-Number), that a ground-truthed scarp (bedrock or other Quaternary) or primary earthquake surface ruptures have been identified. This field is displayed as “1” if the observation has been made and “0” or NULL if not.
geophysicalData (Integer) – data from geophysical equipment such as ground penetrating radar or seismic reflection profiling has been used to locate the fault trace at particular site(s). This field is displayed as “1” if the observation has been made and “0” or NULL if not.
realTimePrimaryEarthquakeSurfaceRupturesDirectlyObservedInField (Integer) – primary earthquake rup-tures have been identified through direct observation (e.g. during a field campaign) within good time following an event. This field is displayed as “1” if the observation has been made and “0” or NULL if not.
earthquakeDisplacementFromInSAROrSimilar (Integer) – primary earthquake ruptures have been identified through remote sensing such as InSAR within good time following an event. This field is displayed as “1” if the observation has been made and “0” or NULL if not.
palaeoseismicTrench (Integer) – tectonic offsets have been identified in at least one trench site along the trace, with some form of dating constraining the offset to within the Late Pleistocene – Holocene. This field is displayed as “1” if the observation has been made and “0” or NULL if not.
cosmogenicDating (Integer) – cosmogenic isotope exposure dating has identified tectonic offset at least one site along the trace with the modelled data constraining offsets to within the Late Pleistocene - Holocene. This field is displayed as “1” if the observation has been made and “0” or NULL if not.
offsetLatePleistoceneHoloceneDepositsMesauredThroughTopographicOffsets (Integer) – tectonic offsets have been identified, the ages have been constrained through regional dating such as dating of a palaeosurface. This field is displayed as “1” if the observation has been made and “0” or NULL if not.
datedOffsetAlongFaultWithLocalOrRegionalDating (Integer) – along other traces belonging to the same fault (only including along-strike traces, i.e.only those with the same hundred number in the traceNumber), tectonic offsets have been identified; these will have either local dating or dating constrained through regional markers. This field is displayed as “1” if the observation has been made and “0” or NULL if not.
TraceLocation. The trace location table contains the scale used to describe how certain the location of the trace is. locationScale (Integer) – an integer value (1–4, 1 = highest) indicating the certainty in the trace location. locationDescription (String) – explanation of the trace certainty scale.
locationDisplay (Number) – how the trace is displayed in the map, i.e. the line thickness (in pixels) with a thicker line representing higher location certainty
TraceActivity. The trace activity table contains the scale used to describe the level of certainty that there has been
tectonic activity along the trace since the Late Pleistocene - Holocene
activityScale (Integer) – an integer value (1–4, 1 = highest) indicating the certainty in the trace activity. activityDescription (String) – explanation of the trace activity scale.
activityDisplay (String) – how the trace is displayed in both the GIS map and GoogleEarth, i.e. the line colour with red indicating the strongest evidence for Late Pleistocene-Holocene activity and grey being the least.
SlipRate. The slip rate table provides slip rate and throw rate measurements and their locations along the traces.
Slip-rates are associated with individual traces and grouped by fault. slipRateKey (Integer) – unique identifier for each slip rate row traceName (String) – see Trace table
faultName (String) – obtained from trace name, see Fault table. Each trace is assigned to a fault.
mainFaultName (String) – this is a dynamic field obtained from fault name, see MainFault table. Each trace is assigned to a fault and each fault is assigned to a main fault.
traceNumber (Integer) – obtained from the trace name, see Trace table.
faultNumber (Integer) – this is a dynamic field obtained from the fault name, see Fault table.
slipRatePreferredMmYr (Number) – the “preferred” slip-rate expressed in mm yr−1. This is the slip-rate cal-culated using the author’s most likely slip and most likely time window over which the slip was accumulated. Note the “preferred” value is interpreted to be the mean value, unless an explicit “preferred” value is reported. Calculated as slipPreferredM/timeWindowPreferred, unless a direct measurement for slip-rate itself is provided. Note the slip-rate has to be defined at a specific location.
slipRateMinimumMmYr (Number) – the “minimum” slip-rate expressed in mm yr−1. This is the slip-rate cal-culated using the author’s minimum slip (ie “preferred” or “mean” slip minus the error) and maximum time window over which the slip was accumulated (i.e. the time window + error in the time window; this is calculated as the time between the oldest older age and youngest younger age deemed possible). Calculated as slipMini-mumM/timeWindowMaximum, unless a direct measurement for the minimum slip-rate itself is provided. Note the slip-rate has to be defined at a specific location.
slipRateMaximumMmYr (Number) – the “maximum” slip-rate expressed in mm yr−1. This is the slip-rate calcu-lated using the author’s maximum slip (ie “preferred” or “mean” slip plus the error) and minimum time window over which the slip was accumulated (i.e. the time window - error in the time window; this is calculated as the time between the youngest older age and oldest younger age deemed possible). Calculated as slipMaximumM/ timeWindowMinimum, unless a direct measurement for the maximum slip-rate itself is provided. Note the slip-rate has to be defined at a specific location.
throwRatePreferredMmYr (Number) - vertical component of slipRatePreferredMmYr expressed in mm yr−1 throwRateMinimumMmYr (Number) - vertical component of slipRateMinimumMmYr expressed in mm yr−1 throwRateMaximumMmYr (Number) - vertical component of slipRateMaximumMmYr expressed in mm yr−1 xCoordinateUTM (Number) - the x UTM coordinate of the site where the measurement was taken. See coordi-nateSystemKey that informs whether this was the original coordinate system used to determine the location or whether it has been derived.
yCoordinateUTM (Number) – the y UTM coordinate of the site where the measurement was taken. See coordi-nateSystemKey that informs whether this was the original coordinate system used to determine the location or whether it has been derived.
xCoordinateWGS84 (Number) – the longitude coordinate of the site where the measurement was taken in deci-mal degrees in the WGS 84 system. See coordinateSystemKey that informs whether this was the original coordi-nate system used to determine the location or whether it has been derived.
yCoordinateWGS84 (Number) – the latitude coordinate of the site where the measurement was taken in decimal degrees in the WGS 84 system. See coordinateSystemKey that informs whether this was the original coordinate system used to determine the location or whether it has been derived.
coordinateErrorM (Number) – the estimated error, measured in metres, of the location (ie in the x and y coordinate)
coordinateSystemKey (Number) – specifies the original coordinate system used to measure the location – see Coordinate System Table.
techniqueKeyThrowSlip (Integer) – the method used for measuring the throw or slip. See Technique Table. referenceKeyThrowSlip (String) – the publication from which the throw or slip measurement has been taken. See Reference Table.
techniqueKeyDate (Integer) – the method used for measuring the time period over which the throw and/or slip occurred. See Technique Table.
referenceKeyDate (String) – the publication from which the time period has been taken. See Reference Table. slipPreferredM (Number) – the “preferred” slip expressed in metres. Note the “preferred” value is interpreted to be the mean value, unless an explicit “preferred” value is reported. See originalMeasurement to determine whether the slip was measured directly, or calculated from the throw measurement. The younger and older age between which the slip occurred is shown in the Age columns.
slipMinimumM (Number) – the minimum slip expressed in metres. See originalMeasurement to determine whether the slip was measured directly, or calculated from the throw measurement.
slipMaximumM (Number) – the maximum slip expressed in metres. See originalMeasurement to determine whether the slip was measured directly, or calculated from the throw measurement.
throwPreferredM (Number) – the “preferred” throw expressed in metres. Note the “preferred” value is inter-preted to be the mean value, unless an explicit “preferred” value is reported. See originalMeasurement to deter-mine whether the throw was measured directly, or calculated from the slip measurement. The younger and older age between which the throw occurred is shown in the Age columns.
throwMinimumM (Number) – the minimum throw expressed in metres. See originalMeasurement to determine whether the throw was measured directly, or calculated from the slip measurement.
throwMaximumM (Number) – the maximum throw expressed in metres. See originalMeasurement to deter-mine whether the throw was measured directly, or calculated from the slip measurement.
youngerAgePreferredKA (Number) – the “preferred” age for the younger age of the time window over which the slip or throw was measured, measured in thousands of years before present. Note the “preferred” value is inter-preted to be the mean value, unless an explicit “preferred” value is reported.
youngerAgeMinimumKA (Number) – the youngest age for the younger age of the time window over which the slip or throw was measured, measured in thousands of years before present.
youngerAgeMaximumKA (Number) – the oldest age for the younger age of the time window over which the slip or throw was measured, measured in thousands of years before present.
olderAgePreferredKA (Number) – the “preferred” age for the older age of the time window over which the slip or throw was measured, measured in thousands of years before present. Note the “preferred” value is interpreted to be the mean value, unless an explicit “preferred” value is reported.
olderAgeMinimumKA (Number) – the youngest age for the older age of the time window over which the slip or throw was measured, measured in thousands of years before present.
olderAgeMaximumKA (Number) – the oldest age for the older age of the time window over which the slip or throw was measured, measured in thousands of years before present.
timeWindowPreferredKA (Number) – the “preferred” time window over which the slip or throw was measured, measured in thousands of years. Calculated as olderAgePreferredKA – youngerAgePreferredKA.
timeWindowMinimumKA (Number) – the minimum time window over which the slip or throw was measured, measured in thousands of years. Calculated as olderAgeMinimumKA – youngerAgeMaximumKA.
timeWindowMaximumKA (Number) – the maximum time window over which the slip or throw was measured, measured in thousands of years. Calculated as olderAgeMaximumKA – youngerAgeMinimumKA.
originalMeasurement (String) – states whether the original measurement stated in the reference was a throw or slip.
throwSlipConversionMethod (Number) – refers to the technique used to convert from throw to slip or slip to throw. See technique table.
LocalGeometryKinematics. The local geometry and kinematics table provides local surface slip vector, strike
and dip measurements and the locations at which they were measured. Note only direct point measurements are included. Geometry measurements are associated with individual traces and grouped by fault. There are no data included regarding the depth of the fault or how surface measurements may project to depth as we do not consider that currently there are sufficient constraints for this to be included; a modeller will need to add their own assumptions.
geometryKey (Integer) – unique identifier for each row traceName (String) – see Trace table
faultName (String) – obtained from trace name, see Fault table. Each trace is assigned to a fault.
mainFaultName (String) – this is a dynamic field obtained from fault name, see MainFault table. Each trace is assigned to a fault and each fault is assigned to a main fault.
traceNumber (Integer) – obtained from the trace name, see Trace table.
faultNumber (Integer) – this is a dynamic field obtained from the fault name, see Fault table. strike (Integer) – strike measurement at the location specified
surfaceDip (Integer) – dip measurement at the location specified, measured at the surface
slipVectorAzimuth (Integer) – slip vector azimuth at the location specified, measured at the surface slipVectorPlunge (Integer) – slip vector plunge at the location specified, measured at the surface
xCoordinateUTM (Number) – the x UTM coordinate of the site where the measurement was taken. See coordi-nateSystemKey that informs whether this was the original coordinate system used to determine the location or whether it has been derived.
yCoordinateUTM (Number) – the y UTM coordinate of the site where the measurement was taken. See coordi-nateSystemKey that informs whether this was the original coordinate system used to determine the location or whether it has been derived.
gridUTM (String) – the UTM grid box of the UTM coordinates.
xCoordinateWGS84 (Number) – the longitude coordinate of the site where the measurement was taken in deci-mal degrees in the WGS 84 system. See coordinateSystemKey that informs whether this was the original coordi-nate system used to determine the location or whether it has been derived.
yCoordinateWGS84 (Number) – the latitude coordinate of the site where the measurement was taken in decimal degrees in the WGS 84 system. See coordinateSystemKey that informs whether this was the original coordinate system used to determine the location or whether it has been derived.
coordinateErrorM (Number) – the estimated error, measured in metres, of the location (ie in the x and y coordinate)
coordinateSystemKey (Number) – specifies the original coordinate system used to measure the location – see Coordinate System table.
techniqueKeyGeometry (Integer) – the method used for measuring the slip vector or surface fault geometry. See Technique Table.
referenceKeyGeometry (String) – the publication from which the measurements have been taken. See Reference Table.
Earthquakes. The earthquakes table provides a summary of references to instrumental, historical and
palae-oearthquakes along the traces. Note the list is not exhaustive. earthquakeKey (Integer) – unique identifier for each row traceName (String) – see Trace table
faultName (String) – obtained from trace name, see Fault table. Each trace is assigned to a fault.
mainFaultName (String) – this is a dynamic field obtained from fault name, see MainFault table. Each trace is assigned to a fault and each fault is assigned to a main fault.
tehniqueKeyEarthquake (Integer) – the method used for determining contemporary or palaeoearthquakes along the trace. See Technique table.
referenceKeyEarthquake (String) – the publication from which the data have been taken. See Reference table. CoordinateSystem. States the coordinate system that relates to the coordinate system key, which is used in point
data tables to identify the original coordinate system used for locating data collection sites and the technique for converting between the original coordinate system of the measurement and those displayed in the data tables. coordinateSystemKey (Integer)– unique identifier for each coordinate system of the original location reported in the reference
originalCoordinateSystem (String) – the coordinate system corresponding to the coordinateSystemKey finalCoordinateSystem (String) – the coordinate system that the original coordinates were converted to coordinateConversionTechnique (String) – the method used for converting the coordinates
Technique. States the technique used for the measurement techniqueKey (Integer) – unique identifier for each technique
techniqueDescription (String) – the technique used for taking the measurement Reference. A table of references cited in the database.
referenceKey (String) – unique identifier for each reference in the table, it has the format of the author name(s) followed by year of publication.
referenceShortName (String) – reference abbreviation in Harvard citation format. articleTitle (String) – title of reference
authors (String) – full list of authors year (Integer) – year of publication journal (String) – name of journal doi (String) – doi of publication
volume (Integer) – volume of publication
issue (Integer) – issue number, this field will be a “NULL” if there is no issue number
firstPage (Integer) – first page of article, this field will be a “NULL” if there are no page numbers lastPage (Integer) – first page of article, this field will be a “NULL” if there are no page numbers