UNIVERSITÀ DEGLI STUDI DEL PIEMONTE ORIENTALE
“AMEDEO AVOGADRO”
Dipartimento di Medicina Traslazionale
Corso di Dottorato di Ricerca in Medicina Clinica e Sperimentale
Ciclo XXVITitolo tesi
Hormonal aspects in paediatric obesity
SSD (Settore Scientifico Disciplinare) della tesi MED38Coordinatore Tutor
Prof.ssa Marisa Gariglio Prof. Gianluca Aimaretti
Dottorando Simonetta Bellone
I
I
N
N
D
D
E
E
X
X
1
1.. IINNTTRROODDUUCCTTIIOONN
1.1. Obesity prevalence in childhood page 4
1.2. Ghrelin system in paediatric obesity page 14 1.3. Cortisol axis in paediatric obesity page 19
2. EXPPEERRIIMMEENNTTAALLRREESSUULLTTSS
2.1. Study 1. (Materials & Methods, Results, Discussion) page 24 2.2. Study 2. (Materials & Methods, Results, Discussion) page 43 2.3. Study 3. (Materials & Methods, Results, Discussion) page 55 2.4. Study 4. (Materials & Methods, Results, Discussion) page 73
3. CONCLUSIONS page 93
4. BBIIBBLLIIOOGGRRAAPPHHYY page 97
1.1 Obesity prevalence in childhood
Overweight and obesity are a major public health concern both in adults and in children. In 1997, the World Health Organization has declared obesity a global epidemic (WHO, 2001), and the Healthy People 2010 has identified overweight and obesity an indicator of the health of a given population (Healthy People, 2000). In fact, childhood obesity is most strongly associated to insulin resistance with an increased prevalence of type 2 diabetes, dyslipidemia and hypertension at the pediatric age, developing to an increased cardiovascular mortality in adulthood (Maffeis et al., 2001). The prevalence of obesity in children and adolescents has increased over several decades in many industrialized countries (Wang Y. et al., 2006).
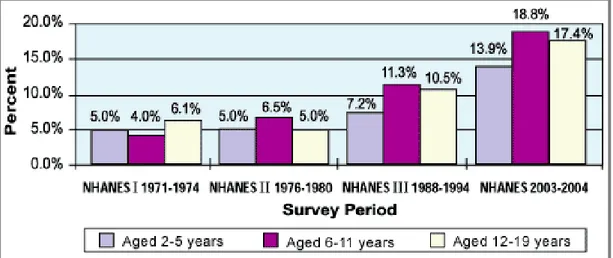
Epidemiological studies of National Health and Nutritional Examination Surveys (NHANES) representing United States Population demonstrated that the prevalence of obesity between 1971-1974 and 2003-2004 has been increased in pre-school children (2-5 yrs) from 5% to 13.9%, from 4% to 18.8% in the age 6-11 years, and from 6.1% to 17.4% in adolescent age (12-19 yrs) (Figure 1).
In the last period of observation it has been shown that an increase is present in particular ethnic groups like African American or Hispanic American in the scholar and adolescent age (National Centre for Health Statistics, 2003-2004) (Ogden CL. et al., 2008).
Figure 1. Trends in child and adolescent overweight.
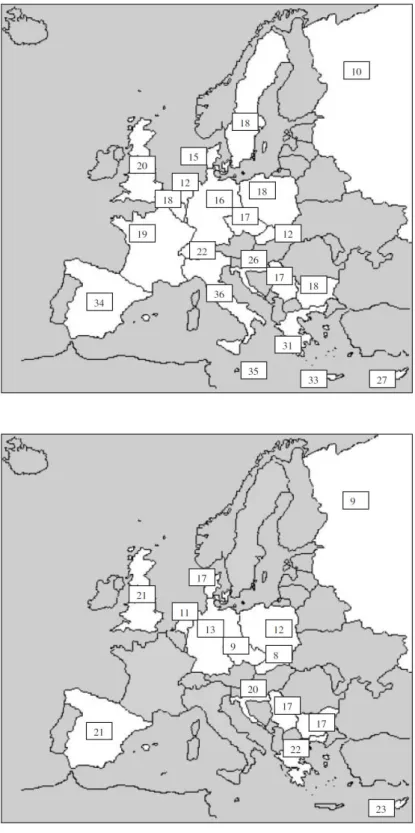
In 2003 the study of Lostein et al. demonstrated that in Europe it is possible to detect two apparent trends. The first is the generally lower levels of overweight found among children in the countries of central and eastern Europe whose economies suffered varying degrees of recession during the period of economic and political transition in the 1990s. This has been particularly noticeable in Russia, in Czech Republic and in Poland; mainly in rural areas, and among children under age 10, the figure was even lower at 7% overweight. The second trend apparent in the data is for the prevalence of overweight to be higher among the southern countries of Europe, especially those outside of the former eastern bloc. The non-eastern bloc countries surrounding the Mediterranean show prevalence rates for overweight children in the range 20–40%, while those in northern areas show rates in the range 10–20% (Lobstein et al., 2003, Figures 2-3).
Figure 2. Prevalence (percentage) of overweight children aged around 7–11 years
(higher panel) and 14-17 (lower panel) using the cut-off points recommended by International Obesity TaskForce (overweight includes obese).
Figure 3. Sources of data on the body mass indices of children in Europe.
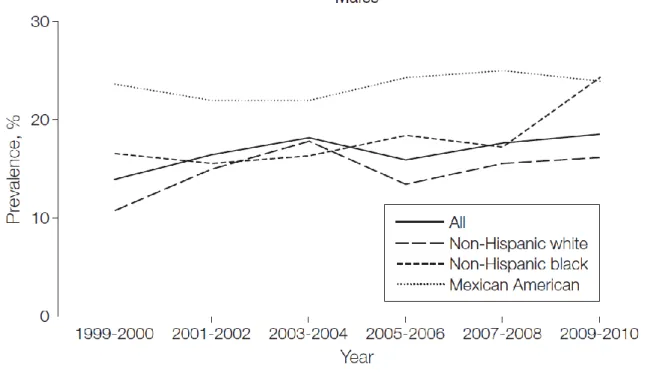
Starting from 2004-2006 the prevalence of childhood obesity in the United States remains unchanged at approximately 17% and the rapid increases in obesity prevalence previously seen have not continued in this decade and may be leveling off (Ogden CL. et al., 2008, Ogden CL et al., 2010).
Nevertheless NHANES has consistently reported significant differences in obesity prevalence by race/ethnicity and among adolescent males but not females of any age. This is consistent with previously published results showing an increase in prevalence of BMI for age at or above the 97th percentile among males but no change in females at any cutoff based on data through 2007-2008 (Figure 4, Ogden CL et al., 2010) (Flegal KM et al., 2010).
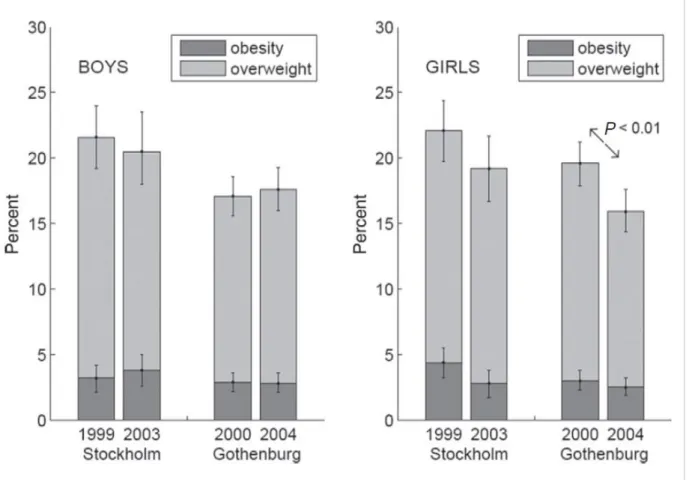
Also in Europe recent epidemiological studies demonstrated the achievement of a plateau in the prevalence of obesity (Great Britain, France, Sweden) (Olds T. et al., 2011, Lissner L. et al., 2010, Figure 5).
Figure 5. Percentages of fourth graders with obesity and overweight (+ obesity) with
95% confidence limits for 4-year changes in Stockholm and Gothenburg, among boys (left panel) and girls (right panel).
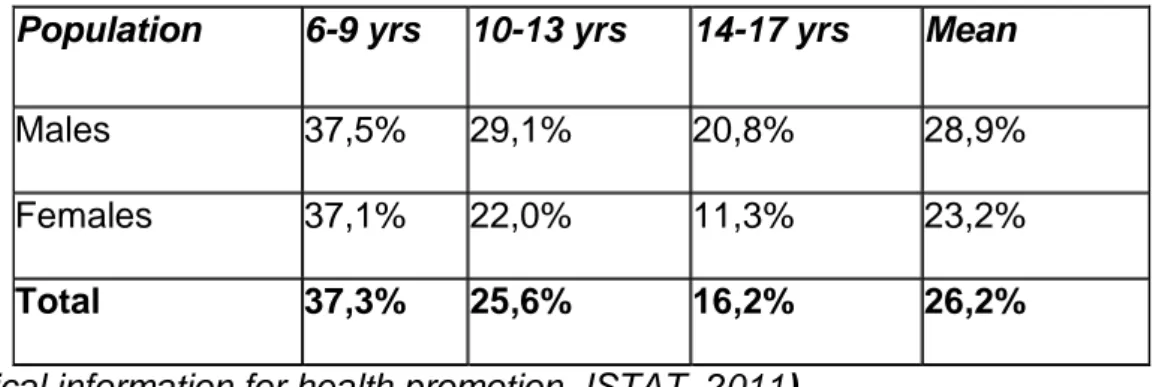
Concerning the Italian picture, a study conducted in 2010 including children and adolescents among 6-17 years of age, demonstrated a percentage of overweight and obesity of about 26% based on the cut-off proposed by the International Obesity Task Force; the study subdivided children in males and females and in three age categories (6-9 yrs, 10-13 yrs and 14-17 yrs) (see Table 1).
Table 1. ISTAT study, 2010. Percentage of overweight and obesity in Italy.
Population 6-9 yrs 10-13 yrs 14-17 yrs Mean
Males 37,5% 29,1% 20,8% 28,9%
Females 37,1% 22,0% 11,3% 23,2%
Total 37,3% 25,6% 16,2% 26,2%
(statistical information for health promotion, ISTAT, 2011).
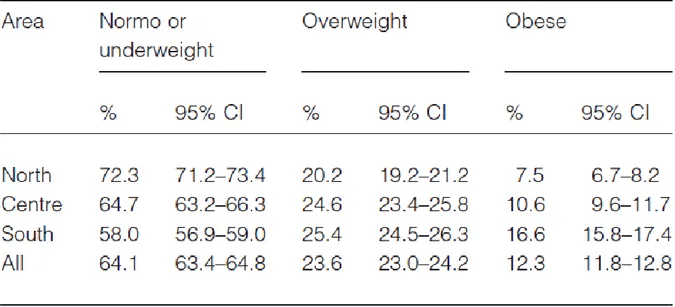
Interesting results come from studies on the Piedmont population, comparing school children living in Turin in 1977 and in Novara in 1999. After 20 years the percentage of obesity increased since 4% in males and 5% in females to 11,64% and 17,24%, respectively, in children of 7 years of age; while since 10% in females and 25% in males to 22,4 % and 28.2%, respectively in children of 11 years of age. These data confirm previous analysis demonstrating an important increase in pediatric overweight. At the end of 2007, the Centre for Disease Control within the Italian Ministry of Health commissioned the creation of a national system to estimate the prevalence of childhood overweight and obesity by geographic area of Italy (‘OKkio alla SALUTE’ project) involving more than 45 000 third-grade students. This project demonstrated a high level of childhood obesity in the overall population, 23,6% of overweight and 12,3% of obesity, which was higher than that of most Western countries; furthermore there were substantial geographic differences, with the prevalence of obesity twice as
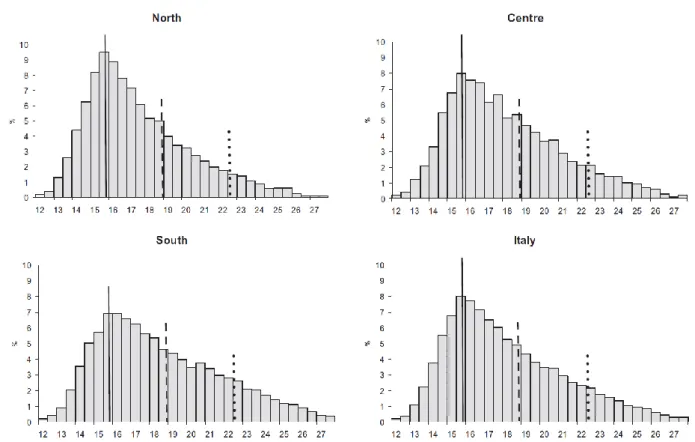
high in the south as in the north (49% in Campania and 23% in Valle D’Aosta) (Binkin N. et al., 2010) (Table 2 and Figure 6).
Figure 6. Distribution of body mass index by geographic area for children 8–9 years of age, Italy. Cut-offs refer to children 8 years and 10 months of age, the median age of the study population (solid line, International Obesity Task Force median; dashed line, cut-off for overweight; dotted line, cut-off for obesity).
1.2 Ghrelin system in pediatric obesity
Ghrelin has an emerging role on appetite, glucose and lipid metabolism, and body composition and has provided an important strength to this research field opening new perspectives within neuroendocrinology and metabolism. In particular it is the only known appetite-stimulating hormone in humans and seems one of the principal factors involved in appetite, craving and regain weight after weight-loss (Adams CE. et al., 2011, Delhanty PJ. et al., 2012 ).
Ghrelin is a 28 amino-acid peptide predominantly produced by the stomach (Kojima M. et al., 1999). It has been discovered as the first natural ligand of the orphan GH Secretagogue Receptor (GHS-R) type 1a (Kojima M. et al., 1999, van Der Lely AJ. Et al., 2004, Kojima M. et al., 2005). Ghrelin presents a characteristic acylation with a medium fatty n-octanoic acid on the Ser3 residue (Kojima M. et al., 1999) (Figure 7). The n-octanoyl group seems essential for its binding to and activation of the GHS-R1a (Kojima M. et al., 1999, van Der Lely AJ. Et al., 2004).
Figure 7. Acylated ghrelin
The ghrelin human gene (GHRL) that is located on 3q25-36, encodes a molecule named pre-proghrelin of 117 aminoacids (Kojima M. et al., 1999, Kojima M. et al., 2005) from which derived by alternative splicing also other ghrelin forms, named des-Gln14ghrelin (Hosoda H. et al., 2000) and In1-ghrelin variant, which retains the GHRL
intron-1 sequence (Gahete MD. Et al., 2011); both variants can be acylated. Despite this background, unacylated ghrelin (UAG), that is devoid of the n-octanoil group at Ser3, is the most abundant circulating form (Kojima M. et al., 1999, Kojima M. et al., 2005, Korbonits M. et al., 2004). Increasing findings demonstrate that also UAG is a biologically active molecule. This evidence is consistent with the hypothesis of the existence of some GHS-R subtypes that are activated by ghrelin independently of its acylation (Caballero B. 2005).
The mechanism of acylation of the pre-proghrelin or of UAG is largely unknown. Yang and coworkers have identified the acyltransferase that octanoylates ghrelin. It has been named GOAT (Ghrelin O-Acyltransferase) (Yang J. et al., 2008). From the pre-proghrelin sequence, another ghrelin-associated peptide of 23 amino acids has been found, named obestatin (Zhang JV. Et al., 2005). The first studies have shown that obestatin possesses opposing action to ghrelin, inhibiting food intake, weight gain and jejunal movement, but the later ones do not fully confirm the previous reports (Hassouna R. et al., 2010 ).
Ghrelin emerged as one of the most powerful orexigenic and adipogenic agents known so far (van Der Lely AJ. Et al., 2004, Korbonits M. et al., 2004, Leite-Moreira AF. Et al., 2007, Cummings DE. et al., 2008, Tschop M. et al., 2000). In all, as a result of central and peripheral actions, acylated ghrelin (AG) administration in rodents causes weight gain that occurs even in absence of overfeeding (Wiedmer P. et al., 2007). AG influences energy balance involving NPY and AgRP in the arcuate nucleus as well as decreasing melanocortin tone and reducing the α- and β-melanocyte-stimulating hormone by neurons that produce pro-opiomelanocortin (van Der Lely AJ. Et al., 2004, Wiedmer P. et al., 2007, Shintani M. et al., 2001, Chen Y. Et al., 2004). Ghrelin regulation of energy homeostasis seems also mediated by efferent and afferent fibres of the vagal nerve (van Der Lely AJ. Et al., 2004, Wiedmer P. et al., 2007). The active
vaccination of mature rats with ghrelin immunoconjugates decreases feed efficiency, relative adiposity, and body weight gain (Zorrilla EP. Et al., 2006). More recently, by acting on GOAT the modification of fatty acid chain length enhances or reduces systemic and central chronic actions of AG on adiposity in rodents (Heppner KM. et al., 2012). On the other hand, the role of UAG in food intake is not fully clarified but it seems able to induce a negative energy balance by decreasing food intake and delaying gastric emptying via the hypothalamus (Delhanty PJ. et al., 2012).
In humans ghrelin secretion is pulsatile, with higher secretion night-time; it undergoes circadian variations with decreases after food ingestion, thus suggesting a metabolic control of it in vivo. Ghrelin could contribute to meal initiation or to nutrient type ingestion (van Der Lely AJ. Et al., 2004, Cummings DE. et al., 2006, Heppner KM. et al., 2012). The circulating levels of ghrelin are modulated by chronic and acute energy imbalance. In fact, ghrelin levels are negatively associated with body mass index; ghrelin secretion is increased in anorexia and cachexia, reduced in obesity and normalized by recovery of ideal body weight (van Der Lely AJ. Et al., 2004, Leite-Moreira AF. et al., 2007, Cummings DE. et al., 2008, Tschop M. et al., 2001). More recently, GOAT was detected in human circulation in healthy, obese and anorexic adults with a positive correlation with body mass index and a negative correlation with ghrelin levels, suggesting that GOAT counteracts the adaptive changes of ghrelin observed under these conditions (Goebel-Stengel M. et al., 2013). Whether an increase of ghrelin levels has been reported after weight loss induced by either diet and lifestyle modifications, this increase may help to promote regaining weight. Accordingly, GOAT inhibition attenuated food foraging, food intake, food hoarding, and hedonic in mice (Teubner BJ. Et al., 2013, Davis JF. Et al., 2012). Furthermore, the overall ghrelin profile is partially abnormal in adult obesity: there is absent or changed ghrelin elevation during fasting (Perreault M. et al., 2004), abolished or blunted increase during
the night or sleep deprivation (Yildiz BO. Et al., 2004, Vazquez RMI. Et al., 2006), and blunted suppression after a meal (English PJ. Et al., 2002). The only clinical exception to this picture seems to be Prader-Willi syndrome (PWS), a genetic disease characterized, among many other features, by severe obesity and hyperphagia. Interestingly, unlike essential obesity, patients with PWS show elevated ghrelin levels, both total and AG levels. Ghrelin hypersecretion has been hypothesized to participate in the development of at least some symptoms of PWS syndrome such as hyperphagia and weight excess (Yi CX. Et al., 2011).
As anticipated, circadian ghrelin secretion is profoundly modulated by acute variations in the energy balance and nutritional status. Though some stimulatory effects of short-term fasting on ghrelin secretion has been suggested by some Authors (van Der Lely AJ. Et al., 2004, Heppner KM. et al., 2012, Kim MS. Et al., 2003 Muller AF. Et al., 2002) but not definitively confirmed (Natalucci G. et al., 2005, Avram AM. Et al., 2005, Espelund U. et al., 2005), probably because the assay methods allowing only to evaluate total ghrelin levels. Notably, during fasting, AG decreases to nadir levels seen post-prandially and UAG remains near to peak levels seen pre-prandially, suggesting that long-term fasting inhibits acylation and that this one may be regulated independently by nutrient availability in the gut, or esterases which cleave the acyl group (Liu J. et al., 2008, Nass R. et al., 2008). In fact, the lipid group that is attached by GOAT is likely derived from free fatty acids in the lumen of the gut rather than circulation (Kirchner H. et al., 2009). Indeed, with prolonged fasting, AG levels are suppressed, whereas UAG is tonic secreted (Liu J. et al., 2008). However, the mechanisms mediating the metabolic control of ghrelin secretion are at present still matter of debate. Gastric secretion per se has been reported not to play a role, while interesting results derive from studies evaluating the effects of nutritional and metabolic determinants (van Der Lely AJ. Et al., 2004, Cummings DE. et al., 2008, Yi CX. Et al.,
2011, Prodam F. et al., 2006). The depth and duration of ghrelin decrease after a meals is related to the total amount of calories ingested and to the type of the macronutrients, in particular carbohydrates and proteins in spite of less effective suppression led by lipids (van Der Lely AJ. Et al., 2004, Leite-Moreira AF. et al., 2007, Prodam F. et al., 2006). It has also been shown that ingested medium-chain fatty acids are directly used for ghrelin acylation, thus theoretically modulating its biological activity (Heppner KM. et al., 2012, Nishi Y. et al., 2005). Consistent with its role in nutritional status, insulin and glucose seem among the major determinants of ghrelin secretion that, in turn, modulates insulin secretion and glucose metabolism as also been predicted by the negative correlation between ghrelin levels and body mass index (van Der Lely AJ. Et al., 2004, Leite-Moreira AF. et al., 2007, Cummings DE. et al., 2008, Tschop M. et al., 2001), and GOAT KO models (Zhao TJ. Et al., 2010).
Overall, published data suggest that ghrelin acts to optimize energy metabolism in period of food restriction as well as preparing the metabolism to percept and use fuel. Data derived by rodent models reveal an essential function of ghrelin, perhaps accounting for its evolutionary conservation - namely, maintenance of viability during periods of famine. Food intake, appetite and energy balance are strictly regulated during lifespan with critical changes in each specific period (infancy, adulthood, aging). There is increasing evidence, although not conclusive, that some of ghrelin changes may contribute to the regulation of food intake and weight also in children, starting from neonates.
1.3 Cortisol axis in paediatric obesity
Cortisol has been reported to have a role in obesity, hypertension, and the altered glucose and lipid profile in Cushing’s syndrome, and some studies have suggested that moderately increased morning fasting cortisol may be associated with the presence of cardiovascular risk factors in adults (Whitworth JA. Et al., 1995, Pasquali R. et al., 2008, Sukhija R. et al., 2006).
The metabolic syndrome (MetS) is a cluster of common abnormalities including hyperglycemia, abdominal obesity, reduced high-density lipoprotein cholesterol levels, and elevated triglycerides and blood pressure (Obunai K. et al., 2007, 2002 NCEP report). The components of MetS are associated with endothelial dysfunction and atherosclerosis and increase the risk for type 2 diabetes mellitus as well as vascular morbidity and mortality (Obunai K. et al., 2007, 2002 NCEP report, Lakka HM. Et al., 2002, Kolovou GD. Et al., 2007, Athyros VG. Et al., 2004). It is unclear whether a single primary abnormality triggers a cascade of diverse events that lead to the manifestation of the components of MetS.
Because the diagnostic features of MetS are shared by Cushing’s syndrome (CS), which results from endogenous or exogenous hypercortisolism, it was proposed that cortisol contributes to the pathogenesis of both states although only mild hypercortisolism occurs in MetS in contrast with CS (Pasquali R. et al., 2006, Walker BR. Et al., 2006).
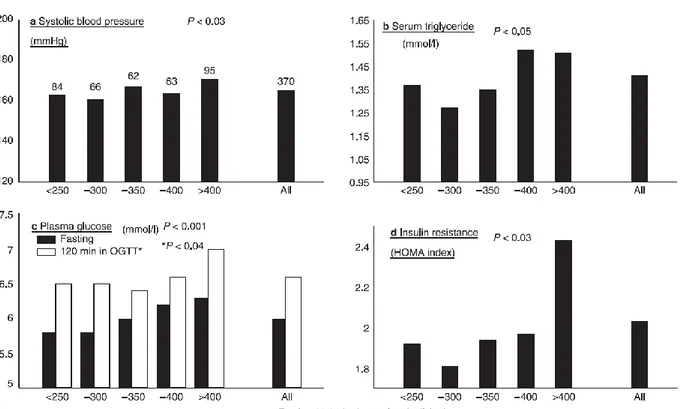
In adults some studies suggest that circulating cortisol concentrations are higher in patients with MetS compared with healthy subjects, in particular in patients with hypertension or impaired glucose tolerance (Sen Y. et al., 2008, Duclos M. et al., 2005, Weigensberg MJ. Et al., 2008, Phillips DI. Et al., 1998, Misra M. et al., 2008) (Figure 8, Walker BR. Et al., 2006).
Furthermore subjects presenting visceral obesity possess an hyperactivity of HPA axis with a functional hypercortisolism (Pasquali R. et al., 2000).
Figure 8. Positive correlations between 09.00 h fasting plasma cortisol and features of the metabolic syndrome. Results are from 370 men aged 59–70 years studied in Hertfordshire, England. OGTT, Oral glucose tolerance test; HOMA, homeostasis model assessment.
Reinher and Andler found significant associations between the degree of cortisolemia and fasting insulin levels in obese children, and levels of both hormones decreased following weight loss (Reinher and Andler, 2004).
Abnormalities in the central regulation of the hypothalamic-pituitary-adrenal (HPA) axis due to stress may lead to a mild hypercortisolism in adults with obesity and metabolic syndrome (Walker BR. Et al., 2007, Anagnostis P. et al., 2009).
Two recent studies in overweight Latino youths with a family history of type 2 diabetes, confirmed higher fasting cortisol levels in those with lower insulin sensitivity (Walker BR. Et al., 2006) or metabolic syndrome, and an association with hypertension and high glucose levels (Sen Y. et al., 2008). However, a study in a small group of prepubertal children showed higher morning plasma cortisol levels in those with higher total cholesterol and triglycerides (Duclos M. et al., 2005).
These findings suggested that, in children, there are similar mechanisms to those reported in adults, but higher cortisol levels could be first a consequence rather than a cause of comorbidities in obesity (Reinher and Andler, 2004).
It is also to be emphasized that in CS, once the tumor is removed and consequently glucocorticoid excess, symptoms improve; in the MetS, weight loss reverses both hypercortisolism and phenotypic abnormalities (Obunai K. et al., 2007, 2002 NCEP report, Lakka HM. Et al., 2002, Kolovou GD. Et al., 2007, Athyros VG. Et al., 2004, Prodam F. et al., 2011) and improves insulin resistance (Prodam F. et al., 2011).
Despite the fact that cortisol levels are within the normal range, there is evidence of increased activity of cortisol in the periphery and dysregulation of the hypothalamic-pituitary-adrenal (HPA) axis (Walker BR. Et al., 2006, Sen Y. et al., 2008).
The pathogenesis of the activation of HPA axis in metabolic syndrome remains unclear. It could be in part mediated by a pro-inflammatory state which characterize the obesity state. In fact it is known that cortisol secretion increase in response to inflammatory states and interleukin-6 levels, increased in overweight subjects, are negatively correlated to the cortisol–binding-globuline (CBG) levels (Bernier J. et al., 1998). It has also been demonstrated that CBG levels negatively correlate to BMI (Gagliardi L. et al., 2010). Therefore a reduction in CBG concentration in obese patients could be an explanation for the higher cortisol concentration in obesity. Recently it has been demonstrated that CBG is present also in the anterior pituitary and in supraoptic and
paraventricular nuclei, where it is suggested to have a role in HPA axis regulation (Henley DE. et al., 2011). Other cytokines produced in adipose tissue instead stimulates enzymatic activity of 11β-hydroxysteroid dehydrogenase1 (11βHSD1) which convert the metabolically inactive corticosterone in cortisol (Wake DJ. Et al., 2003). Higher levels of 11 βHSD1 mRNA have been demonstrated In obese subjects compared to that in normal weight subjects (Mariniello B. et al., 2006).
Furthermore in obese subjects higher leptin levels have been demonstrated. Leptin is a peptide produced by adipose tissue which possess an important role in appetite and metabolism regulation, but also induce an increase in glucocorticoid secretion (Nelson DL. Et al., 2006).
Therefore it seems that different pathophysiological mechanisms could contribute to a dysregulation of HPA axis in obesity state.
Although cortisol is associated with metabolic alterations, it appears that adrenocorticotropic hormone (ACTH) may directly contribute to comorbidities in obesity. It has been shown in vitro that ACTH interacts with adipocytes, promotes insulin resistance and is pro-inflammatory (Iwen KA. Et al., 2008). To date, however, the role of ACTH has not been determined in obese children.
2.1 Study 1
Title
Acylated and unacylated ghrelin levels in normal weight and obese
children: influence of puberty and relationship with insulin, leptin and
adiponectin levels.
Aim of the Study
In order to understand the biological implications of acylated (AG) and unacylated (UAG) ghrelin in the pediatric population, we evaluated AG and UAG levels in normal weight and obese children, prepubertal and pubertal. Furthermore we measured insulin, leptin and adiponectin levels in the same subjects.
Subjects and Methods
It has been evaluated a total 140 children followed by the Division of Pediatrics of our Hospital, “Azienda Ospedaliero Universitaria Maggiore della Carità” in Novara, Surgery of Pediatric Endocrinology and Auxology.
All subjects underwent a clinical evaluation by a trained research team. Pubertal stages were determined by physical examination, using the criteria of Marshall and Tanner (Appendix 1). Height was measured to the nearest 0.1 cm using a Harpenden stadiometer, and body weight with light clothing to the nearest 0.1 kg using a manual weighing scale. Body mass index (BMI) was calculated as body weight divided by squared height (kg/m2). Children were subdivided using Italian growth charts (Cacciari E. et al., 2006, Appendix 2). We considered obese children with BMI above the 95th
percentile. Waist circumference was measured at the high point of the iliac crest around the abdomen and was recorded to the nearest 0.1 cm (Appendix 3). Systolic BP (SBP) and diastolic BP (DBP) were measured three times at 2-minute intervals using a mercury sphygmomanometer with an appropriate cuff size after participants were seated quietly for at least 15 minutes, with their right arm supported at the level of the heart and feet flat on the floor, prior to other physical evaluations, and at least 30 minutes after blood sampling, using a standard mercury sphygmomanometer. Mean values were used for the analyses. Hypertension was determined if BP values recorded on enrollment day and on blood samples day are always elevated. (Appendix 4).
Normal weight children presented to the clinic for an evaluation of growth, pubertal status, suspected thyroid disease, general health checkup, but no disease was confirmed at the end of the evaluations. Exclusion criteria were the presence of any psychiatric or organic diseases in particular neurological, endocrine (short stature), liver, and kidney abnormalities. Nobody was under pharmacological treatments. The
study protocol was approved by an Independent Ethical Committee and the informed consent had been obtained from each children’ parents.
After a 12-hour overnight fast, children arrived at the clinical center at 7.30 AM and rested comfortably for half an hour prior to blood testing. At 8.00 AM, blood samples were taken for measurement of plasma AG, UAG, leptin, adiponectin, glucose, insulin, testosterone (in males) or estradiol (in females).
Human ghrelin (fm/ml) was measured by ELISA (DRG Instruments GmbH, Marburg, Germany). Acylated ghrelin: sensitivity: 1 fm/ml. Intra- and inter-assay CV ranges:3.5-3.8% and 2.6-3.9%. Unacylated ghrelin: sensitivity 10 fm/ml Intra e inter-assay CV ranges: 2.1-4.7 % and 4.2-7.2%.
Insulin (μUI/ml; 1μUI/ml = 7.175 pmol/l) was measured by a chemiluminescent enzyme-labelled immunometric assay (Diagnostic Products Corporation, Los Angeles, CA). Sensitivity: 2 μUI/ml, with an intraand inter-assay CV range: 2.5-8.3 and 4.4-8.6%. Plasma glucose levels (mg/dl; 1 mg/dl:0,05551mMol/liter) were measured by the gluco-oxidase colorimetric method (GLUCOFIX, by Menarini Diagnostici, Florence, Italy). Adiponectin was measured by an ELISA kit E09, (Mediagnost, Reutlingen, Germany). Sensitivity: 0.06 μg/ml, with an intra e inter-assay CV range: 4.7% e 6.7%.
Leptin was measured by Direct ELISA (Diagnostics Biochem Canada). Sensitivity: 0.5 ng/ml. Intra e inter-assay CV ranges: 7.4% e 8.7%.
Testosterone and estradiol were measured with Centaur instrument, Siemens kit, by chemiluminescent method. Testosterone: sensitivity 10 ng/dl, with an inter-assay: 6.2%; estradiol: sensitivity 7 pg/ml, with an inter-assay: 7.4%.
Insulin resistance was calculated using the formula of HOMA-IR = [fasting glucose (mg/dL)/18 ×fasting insulin (mUI/L)]/22.5. Beta cell function at fasting was calculated using the formula of HOMA-B =(20×fasting insulin)/(fasting glucose-3.5).
Insulin sensitivity fasting was calculated from the QUICKI index (1/[log fasting insulin + log fasting glucose]) (26).
Data are expressed as mean±SD or median and 25th-75th percentiles. For continuous
variables, the variation between groups was compared by means on nonparametric Wilcoxon and Mann-Whitney U tests, where appropriate. A correlation analysis was performed using the Pearson’s correlation test thought a logarithmic transformation of the parameters when necessary. A partial correlation analysis was performed to adjust for BMI, age, gender, and pubertal status. A stepwise regression model with two-tailed probability values and 95% confidence intervals for each significant parameter in the correlation analysis was used to measure the strength of association between variables.
Statistical significance was assumed for p<0.05. All statistical analyses were performed with SPSS for Windows version 15.0 (SPSS INC; Chicago, IL, USA).
Results
Hormonal parameters
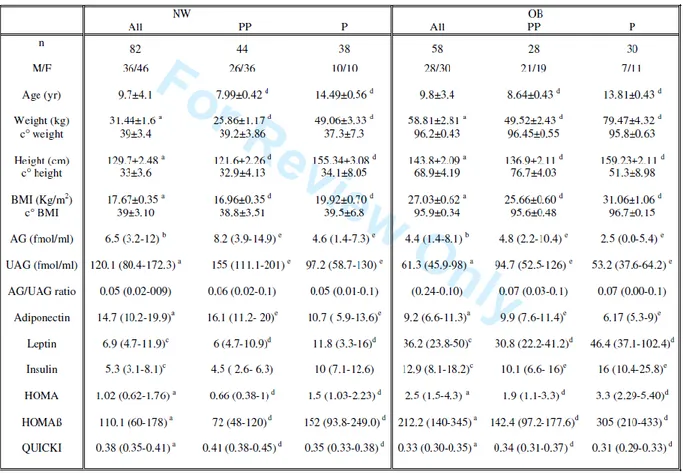
Eighty-two children (mean±SD) (age: 9.7 ± 4.1 yr) were normal weight (NW): 46 females and 36 males, 44 prepubertal children and 38 with pubertal stage from II to V. The remaining 58 children (age (mean±SD): 9.8±3.4 yr) were obese (OB): 30 females and 28 males, 28 prepubertal and 30 pubertal children. All auxological parameters of two groups are reported in Table 3.
We observed that the median (IQR) of AG (6.5; 3.2-12.0 fmol/ml) in NW was higher (p<0.02) than in OB (4.4; 1.4-8.1 fmol/ml) (Fig.1). Likewise, the median of UAG (120.1; 80.4-172.3 fmol/ml) in NW was higher (p<0.0001) than in OB (61.3; 45.9-98 fmol/ml) (Figure 9), while the AG/UAG ratio was similar for both groups.
Figure 9. AG (fmol/ml), UAG (fmol/ml) levels and AG/UAG ratio in normal weight (NW) and obese (OB) children.
No differences in ghrelin levels were found between males and females.
Interestingly in NW, AG and UAG were higher in prepubertal than in pubertal children (8.2 vs 4.6 fmol/ml and 155.0 vs 97.2 fmol/ml, p<0.01), with a similar profile observed in the OB group (4.8 vs 2.5 fmol/ml and 94.7 vs 53.2 fmol/ml, p<0.01) (Figure 10).
Figure 10. AG (fmol/ml) and UAG (fmol/ml) levels in normal weight (NW) and obese (OB) children, prepubertal (PP) and pubertal (P).
Therefore AG/UAG ratio were similar in prepubertal and in pubertal children, either in normal weight or in the obese group (Figure 11).
0 10 20 A G (f m ol /m l) 0 10 20 A G (f m ol /m l) 0 100 200 300 U A G (f m ol /m l) 0 100 200 300 U A G (f m ol /m l) PP NW P NW PP OB P OB
Figure 11. AG/UAG ratio in normal weight (NW) and obese (OB) children, prepubertal (PP) and pubertal (P).
When metabolic parameters were evaluated, it was observed that adiponectin levels were higher (p<0.0001) in NW (14.7; 10.2-19.9 μg/ml) than in OB (9.2; 6.6-11.3 μg/ml), whereas in contrast leptin levels in NW (6.9; 4.7-11.9 ng/ml) were lower (p<0.001) than in the OB group (36.2; 23.8-50.0 ng/ml) (Fig.4). It was observed that insulin levels in the NW group (5.3; 3.1-8.1 μUI/ml) were lower (p<0.001) than in OB (12.9; 8.1-18.2 μUI/ml).
No gender differences were observed for adiponectin and insulin, while leptin levels in females (15.2; 7.2-38.8 μg/ml) were higher than in males (8.95; 4.3-32.6 μg/ml) (p<0.01). 0 1 0 2 0 A G / U A G r a ti o ( % ) 0 1 0 2 0 A G / U A G r a ti o ( % ) P P N W P N W P P O B P O B
During pubertal development in both NW and OB children, adiponectin levels were significantly lower (p< 0.005), while leptin levels were higher in pubertal when compared to prepubertal children (p<0.0001). Insulin levels were higher in OB pubertal than prepubertal (p<0.01), while in NW they increased during puberty, but this variation did not reach the statistical significance (Figure 12).
Figure 12. Adiponectin, leptin, insulin levels in normal weight (NW) and obese (OB) children, prepubertal (PP) and pubertal (P).
0 1 0 2 0 3 0 A d ip o n e c ti n ( g / m l) 0 3 0 6 0 9 0 L e p ti n ( n g / m l) 0 1 0 2 0 3 0 I n su li n ( U I / m l) 0 1 0 2 0 3 0 A d ip o n e c ti n ( g / m l) 0 3 0 6 0 9 0 L e p ti n ( n g / m l) 0 1 0 2 0 3 0 I n su li n ( U I / m l) P P N W P N W P P O B P O B
NW showed HOMA and HOMAβ indices lower than OB (p<0.0001) with a QUICKI index higher (p<0.0001).
Glucose levels maintained similar levels between groups. As expected, in both groups testosterone and estradiol levels increased with puberty (p<0.0001 and p<0.01, respectively).
HOMA and HOMAβ were higher and QUICKI index lower in puberal children than prepubertal in both groups (p<0.0001).
Correlation and regression analysis
When correlation analyses were performed in all the subjects together, it was found that both AG and UAG were negatively correlated with age, height, weight and BMI (p<0.0001) (Table 4).
Table 4. Pearson coefficients using correlation analysis for AG and UAG levels in all subjects. a:p<0.05; b:p<0.01; c:p<0.001; d:p<0.0001
We observed that AG was negatively correlated with leptin and insulin (p<0.001) and showed a weak positive correlation with adiponectin (p<0.05). UAG showed a negative correlation with leptin, testosterone, estradiol, glucose and insulin levels (p<0.001), with a stronger positive correlation with adiponectin levels (p<0.0001) (Figures 13-14).
Figure 14. Correlations between AG or UAG and leptin or adiponectin.
AG and UAG were negatively correlated with HOMA and HOMAβ (p<0.0001), and positively with QUICKI (p<0.0001).
AG maintained the negative correlation with leptin and insulin (p<0.0001) when correcting for pubertal stage, and only with insulin (p<0.001) when corrections were made for pubertal stage and/or BMI. UAG showed a negative correlation with adiponectin, leptin and insulin (p<0.0001), when correcting for pubertal stage, whereas
correlations were maintained for leptin and insulin (p<0.001) when correcting for pubertal stage and/or BMI.
Analyzing the two groups separately, AG and UAG were negatively correlated with age, height, weight and BMI (p<0.0001) in OB children. UAG was correlated with anthropometric parameters (p<0.01) in NW, not AG. Moreover AG and UAG showed the same correlations with metabolic parameters and insulinemic indices, with exception of adiponectin. Only UAG was correlated with adiponectin in both OB (p<0.02) and NW (p<0.0001) children. Moreover, AG was negatively correlated with insulin (p<0.05) when corrected for pubertal stage, whereas UAG maintained its negative correlation with insulin and leptin (p<0.0001) in both groups. AG kept its correlation with insulin only in OB group, not in NW, and UAG with insulin and leptin (p<0.001) in OB group and with insulin (p<0.0001) in NW group when corrected for pubertal stage and/or BMI. In normal weight children auxological parameters resulted not correlated with AG levels.
Multiple regression analysis revealed that AG levels were negatively predicted (R2: 0.214; p<0.001) by insulin (standardized β: 0.462; unstandardized β: 0.379; IC 95% -0.516/-0.241), when corrected for pubertal stage or BMI. UAG levels were negatively predicted (R2: 0.407; p<0.0001) by BMI (β: 0.553; unstandardized β: 5.386; IC 95% -6.919/-3.853) and insulin (β: -0.271; unstandardized β: -1.999; IC 95% -3.381/-0.618) and positively by adiponectin (β: 0.260; unstandardized β: 2.467; IC 95% 0.881/4.053) when corrected for pubertal stage. Alternatively, UAG levels were negatively predicted (R2: 0.422; p<0.0001) by insulin (β: -0.571; unstandardized β: -5.150; IC 95% -6.549/-3.750) and leptin (β: -0.224; unstandardized β: -0.479; IC 95% -0.903/-0.056) and positively predicted by adiponectin (β: 0.277; unstandardized β: 2.640; IC 95% 1.153/4.127) when corrected for BMI.
Discussion
The present study demonstrates that obese children show AG and UAG levels lower than those in normal weight children; this reduction is similar between the two forms, with maintenance of the same AG/UAG ratio. We observed that ghrelin levels are lower during puberty in both groups, with no differences emerging for gender. Interestingly, when the two ghrelin forms were evaluated separately, a peculiar yet strong relationship between UAG levels and metabolic parameters has been observed, suggesting a significant role for UAG in metabolic functions.
To the present day, only few studies have reported AG and UAG levels in childhood, being mainly focused on adolescents and small cohorts of subjects (Harada T. et al., 2008, Mackelvie KJ. Et al., 2007). To our knowledge, this is the only larger study evaluating both forms of ghrelin in obese and healthy children and it clearly shows lower levels of both AG and UAG in the obese state.
Circulating ghrelin is comprised primarily of UAG (Van der Lely AJ. Et al., 2004, Soares JB. Et al., 2008), however, at present the regulation of the different forms of ghrelin is poorly understood. In adulthood it has been demonstrated that both forms of ghrelin are similarly inhibited by feeding, while in the fasting state a dissociation of the two forms is evident (Soares JB. Et al., 2008). During long-term fasting, AG levels decrease while UAG and total ghrelin remain unchanged (Soares JB. Et al., 2008, Liu J. et al., 2008). Available data in adulthood suggest that AG and UAG may have different and opposite effects on glucose homeostasis, where AG, most likely via GHS-R1a receptors, inhibits insulin secretion thus increasing glucose levels and exerting a direct effect on hepatocytes to modulate gluconeogenesis and glycogen synthesis (Van der Lely AJ. Et al., 2004). In contrast, UAG counteracts the AG effect on insulin secretion via as yet to be described receptors (Wiedmer P. et al., 2008).
In accordance with this data, in our study OB children show lower levels of both AG and
UAG when compared to NW subjects, either in prepubertal or in pubertal children maintaining the same AG/UAG ratio during childhood. In both groups AG, but more strongly UAG, correlated with adiponectin, leptin, insulin. Furthermore both forms are well related with insulinemic indices, negatively with HOMA and HOMAß and positively with QUICKI. Also when corrected for pubertal stage and BMI, AG levels were negatively predicted by insulin while UAG were predicted by insulin, leptin and adiponectin. The consensual reduction independent of pubertal stage of AG and UAG in obesity without modification of the AG/UAG ratio, as well as a negative correlation of both forms with insulin metabolism, further suggests that all the ghrelin secretion is strictly modulated by insulin lifespan. Analyzing the two groups separately both AG and UAG maintained their correlations with insulin levels and indices, while only UAG was correlated with adiponectin levels suggesting their interplay metabolic functions in children. In normal weight children auxological parameter resulted not correlated with AG levels, probably due to the little number of subjects or skewed distribution.
The regulation of AG and UAG circulating levels has not yet been clearly defined. It is thought that UAG could be produced directly from the ghrelin gene, therefore via a different pathway to the acyl form, or alternatively it could be derived by the deacylation of ghrelin (Soares JB. Et al., 2008, Liu J. et al., 2008 ).
Very recently GOAT, an enzyme catalyzing the addition of the octanoyl-group has been identified (Gualillo o. et al., 2008). It is not known at present whether the GOAT levels regulate changes in ghrelin acylation or, on the contrary, if GOAT itself depends on different metabolic conditions. Its discovery has introduced intriguing questions and new possibilities to understanding better the regulation of energy balance.
As such, the presently published data demonstrates that total ghrelin does not adequately reflect AG and UAG ghrelin levels, suggesting a role of ghrelin acylation in the modulation of energy intake (Harada T. et al., 2008). In this context, the measurement of AG/UAG ghrelin ratio could be a more useful tool to understanding ghrelin changes in different conditions. In our study, we observed that both forms of ghrelin did not show gender differences. Most studies are concordant with our results (Purnell JQ. Et al., 2003, Vilarrasa N. et al., 2005), but some have demonstrated that they are modulated by sex. For example, adult women studied in the late follicular phase showed higher levels of ghrelin with respect to men of a similar age and BMI (Van der Lely AJ. Et al., 2004). Studies evaluating total ghrelin levels in children are more homogeneous and confirm the present results (Bellone S. et al., 2004, Whatmore AJ. et al., 2003). Of particular relevance is the study by Ghizzoni et al. which demonstrated in prepubertal children that within a 24 hour period, ghrelin is secreted in a pulsatile manner and with a circadian rhythm, showing no differences for
gender (Ghizzoni L. et al., 2004).
In the present study, AG and UAG ghrelin levels are lower during pubertal development, reflecting the pattern for total ghrelin as previously observed in normal weight children during puberty (Soriano-Guillen L. et al., 2004, Whatmore AJ. et al., 2003). When correcting for pubertal stage, AG maintains the negative correlation exclusively with insulin, while UAG showed a negative correlation with adiponectin, leptin and insulin.
To date, the physiological mechanisms for the regulation of ghrelin secretion is not yet fully understood. More certainly the gonadal system appears to play a role, with GHS receptors identified in the ovary and testis, with Leydig cells shown to synthesize ghrelin (Gil-Campos M. et al., 2003). Studies in polycystic ovary syndrome, a condition of hyperandrogenism, and in hypogonadal males support the hypothesis of a role of
androgens on ghrelin secretion (Pagotto U. et al., 2002, Pagotto U. et al., 2003). Lebenthal et al. also studied total ghrelin levels before and after priming with sexual steroids (Lebenthal Y. et al., 2006) demonstrating, in male subjects, a clear reduction in circulating ghrelin levels while no changes were observed in females. In line with these findings, we observed in the present study that both ghrelin forms were similarly lower during pubertal development and their levels negatively correlated with circulating testosterone and estradiol levels. On the other hand this different hormonal pattern could be due to changes in body composition, characteristic of puberty. Body proportions and fat distribution change over pubertal period due to differences in endocrine status, genetic factors, ethnicity and the environment with males assuming an android and females a gynecoid shape, respectively. In fact, during puberty, males gain greater amounts of lean and skeletal mass whereas females mainly acquire fat mass (Loomba-Albrecht LA. et al., 2009).
During puberty we also observed lower adiponectin levels and higher leptin levels in both groups. Insulin levels are higher only in obese children, not in normal weight ones with glucose maintaining similar levels. This effect is probably due to an increase in body fat mass that is correlated with the insulin secretion.The regulation of body weight and energy homeostasis is a complex system that involves signals converging on the central nervous system. The hypothalamic nucleus such as the arcuate nucleus, ventral tegmental area and the substantia nigra are the primary sites where peripheral signals are integrated for the control of weight balance (Van der Lely AJ. Et al., 2004, Gil-Campos M. et al., 2003). It has been demonstrated that ghrelin as well as other anorectic peptides signal to the same system exerting opposite functions. A negative relationship between leptin and ghrelin has been shown in several studies (Tolle V. et al., 2003, Weigle DS. Et al., 2003, Loomba-Albrecht LA. et al., 2009), with leptin being able to inhibit gastric ghrelin secretion (Kalra SP. Et al., 2005). To date, the existence
of a negative feed-back between these two hormones is still matter of debate. In addition there is evidence that adiponectin levels are lower in obese subjects and increase with weight loss while being directly correlated to insulin sensitivity (Svarbrick MM. et al., 2008). This correlation is lost after matching for pubertal development suggesting a different role for puberty on these two peptides. In the same
population, adiponectin was positively correlated with AG and UAG levels. When correcting for puberty and BMI, we observed that AG was negatively correlated with insulin, while UAG was predicted primarily by leptin in OB and insulin in NW, suggesting diverse roles for the two forms of ghrelin in metabolism and gonadal maturation. The loss of correlation between UAG and leptin at puberty in NW but not in OB suggests that puberty is a key modulator of ghrelin, more specifically UAG with the data confirming the role of leptin as a trigger of gonadal maturation with implication of leptin- and insulin-resistance in obesity (Chan JL. Et al., 2001). The positive correlation between UAG and adiponectin, independent of puberty, strongly suggests a common metabolic regulation.
In conclusion the present study demonstrates in a large cohort of subjects that AG and UAG levels in obese children are lower than those in normal weight ones, with the same ratio between the two forms maintained. While no gender differences were observed, the levels of both ghrelin forms were comparable lower during puberty, suggesting the same inhibitory influence by sexual hormones on AG and UAG. Importantly, a separate evaluation of AG and UAG demonstrated a peculiar strong relationship between UAG levels and metabolic parameters suggesting a role for UAG in metabolic functions. Further studies focusing on the feeding state are needed to increase knowledge of the role of ghrelin acylation on energy homeostasis. Importantly, we feel that for clinical purposes the measurement of AG/UAG ratio should be a more useful tool in understanding the variation of ghrelin under different conditions.
2.2 Study 2
Title
Acylated/unacylated ghrelin ratio in cord blood: correlation with
anthropometric and metabolic parameters and pediatric lifespan
comparison
Aim of the Study
We hypothesize that, at birth, AGA NN show ghrelin levels similar to prepubertal children, with the same AG/UAG ratio. To understand the lifespan regulation and the biological implications of the two ghrelin forms at the neonatal age, we evaluated AG and UAG levels at birth compared with those of NW and OB children, both prepubertal and pubertal.
Subjects and Methods
We studied three groups of consecutive Caucasian subjects: neonates (NN), normal weight children (NW), and obese (OB) children according to Italian growth charts (Cacciari E. et al., 2006, Appendix 2). Group of newborn was composed of adequate for gestational age (AGA) Caucasian NN. AGA was defined as a birth weight from the 10th to the 90th percentile for gestational age according to Italian charts (Appendix 5). All babies were born after uncomplicated pregnancies by vaginal or cesarean delivery and were otherwise healthy. All the mothers were healthy and in particular none of the mothers had gestational diabetes. None of the babies showed signs of distress at delivery. Birth weight and length were recorded at birth by the attending nurse.
This neonatal population has been compared to the pediatric population described in study 1. Group NW included 82 children (46 females and 36 males) born AGA. Of these 44 were prepubertal and 38 in a pubertal stage from II to V according to Tanner scale (Appendix 1). NW subjects have their weight included between the 3rd and 75th percentile of Italian charts (Appendix 2). Group OB was composed of 58 children (30 females and 28 males), 28 of which were prepubertal and 30 pubertal. All OB children were born AGA. All NW and OB children were randomly enrolled according to the clinical criteria at Division of Pediatrics, University of Piemonte Orientale, Novara, Italy. Exclusion criteria were the presence of any psychiatric or organic diseases in particular neurological, endocrine (short stature), liver, and kidney abnormalities.
None of the children were under pharmacological treatments. The study protocol was approved by an Independent Ethics Committee and the informed consent was obtained from each child’s parents.
Auxological measurements on children have been described in study 1. In cord blood at birth in NN, and at 0830–0900 h following an overnight fast in NW and OB plasma, we measured AG, UAG, and insulin. The AG/UAG ratio was calculated. In NN, at
delivery, the cord was immediately clamped and venous blood samples were drawn by catheterization.
Human ghrelin (fmol/ml) was measured in acidified plasma stored at K80 8C using ELISA kits from DRG Instruments GmbH, Marburg, Germany. AG: sensitivity: 1 fmol/ml intra- and inter-assay coefficient of variation (CV) ranges: 3.5–3.8 and 2.6–3.9% and UAG: sensitivity: 10 fmol/ml intra- and inter-assay CV ranges: 2.1–4.7 and 4.2–7.2%. Insulin (mUI/ml; 1 mUI/mlZ7.175 pmol/l) was measured by chemiluminescent enzyme-labeled immunometric assay (Diagnostic Products Corporation, Los Angeles, CA, USA). Sensitivity: 2 mUI/ml intra- and inter-assay CV ranges: 2.5–8.3 and 4.4–8.6%. Data are expressed as mean ± S.E.M. Distributions of continuous variables were examined for skewness and were logarithmically transformed, where appropriate. Differences between the groups were assessed by the Student’s t-test or the one-way ANOVA with post-hoc analysis by the Bonferroni test. A correlation analysis was performed by the Pearson’s correlation test. Statistical significance was assumed for P!0.05. All statistical analyses were performed with SPSS for Windows version 15.0 (SPSS, Inc., Chicago, IL, USA).
Results
Group of newborn was composed of 82 Caucasian NN (40 males and 42 females), born to term (37–41 weeks of gestation) and adequate for gestational age with a normal ponderal index. Thirty-eight were born by vaginal delivery and 44 from cesarean delivery.
All auxological parameters of the three groups are reported in Table 5.
Table 5. Clinical parameters of NN, NW and OB children.
AG levels (mean±S.E.M.) were lower in NN compared with both NW (1.68±0.24 vs 8.43±0.87 fmol/ml; P<0.0001) and OB children (1.68±0.24 vs 5.30±0.68 fmol/ml; P<0.0001; Fig. 1). AG levels were particularly lower in NN than in prepubertal NW and OB children (9.77±1.06 and 6.23±0.73 fmol/ml, respectively; P<0.007). UAG levels were higher in NN (213.2±9.1 fmol/ml) compared with NW (135.9±8.7 fmol/ml; P<0.0001) and OB children (79.5±7.6 fmol/ml; P<0.0001; Figure 15 and Table 5).
Figure 15. Acylated and Unacylated ghrelin levels in neonates and in normal weight (NW) and obese (OB) children, prepubertal (PP) and pubertal (P)
Furthermore, AG/UAG ratio was lower in NN than in NW (0.01±0.0 vs 0.07±0.01; P<0.0001) and OB children (0.01±0.0 vs 0.07±0.01; P<0.0001). AG/UAG ratio was similar between NW and OB (Figure 16).
Figure 16. AG/UAG ratio in neonates and in normal weight (NW) and obese (OB) children, prepubertal (PP) and pubertal (P).
Figure 17. Acylated, Unacylated ghrelin levels and AG/UAG ratio in males and females neonates.
NN showed insulin levels (6.40±0.76 mUI/ml) similar to NW (6.26±0.51 mUI/ml) and lower than OB children (14.4±G1.24 mUI/ml; P<0.0001).
AG, UAG levels and the AG/UAG ratio were not different in NN according to the type of delivery (Figure 18).
Figure 18. Acylated, Unacylated ghrelin levels and AG/UAG ratio in neonates born from cesarean or vaginal delivery.
No gender differences were detected in each of the three groups.
At birth UAG was positively correlated with AG (Pearson: 0.425; P<0.0001) and negatively with insulin (-0.253; P<0.02). No association was found between UAG and anthropometric parameters. AG did not demonstrate any associations with anthropometric or hormonal parameters, with the exception of UAG. In NW and OB, UAG was positively correlated with AG (0.537; P<0.0001) and negatively with insulin and BMI (-0.566 and -0.541; P<0.0001). Similarly, AG was positively correlated with UAG and negatively with insulin and BMI (-0.442 and -0.323; P<0.0001).
In a model composed of all three groups, UAG was negatively correlated with weight and insulin (β: -0.661 and -0.489, respectively; P<0.0001) and AG was weakly associated in a negative manner exclusively with insulin (β: -0.214; P<0.003).
Discussion
Our study is mainly focused on a physiological investigation of the two forms of ghrelin, AG and UAG, in healthy AGA newborns compared with later in life. The results demonstrate that in full-term NN, the venous cord blood at birth presents a very different profile of the two ghrelin forms compared with that found in children. NN show lower AG and higher UAG levels than NW and OB children, independent of pubertal status. As a consequence, the AG/UAG ratio in cord blood of NN is lower compared with that found in NW and OB children.
To date, most authors have studied total ghrelin independent of the two forms in NN and children (Soriano-Guillen L. et al., 2004, Ng PC. Et al., 2005, Chanoine JP. Et al., 2003, Chanoine JP. Et al., 2002, Kitamura S. et al., 2003, Farquhar J. et al., 2003, Whatmore AJ. Et al., 2003), with a few studies published regarding the ghrelin isoforms, particularly in newborns.
It has been clearly demonstrated that total ghrelin levels are similar in female and male newborns (Soriano-Guillen L. et al., 2004, Martos-Moreno GA. Et al., 2009, Pirazzoli P. et al., 2005, Bellone S. et al., 2003) and are higher in SGA compared with AGA newborns (Onal EE. Et al., 2004, Kitamura S. et al., 2003, Farquhar J. et al., 2003), while controversial data exists regarding correlations between ghrelin levels and gestational age or auxological parameters (Martos-Moreno GA. Et al., 2009, Farquhar J. et al., 2003, Chiesa C. et al., 2088, Bellone S. et al., 2004). Soriano-Guillen et al. (Soriano-Guillen L. et al., 2004) demonstrated that
total ghrelin levels in newborns were similar between full term and preterm, increasing during early postnatal life and decreasing thereafter during puberty with a negative correlation between ghrelin, age, and Tanner stages.
Only a few studies have shown that AG is present in fetal and neonatal circulation (Martos-Moreno GA. Et al., 2009, Pirazzoli P. et al., 2005, Bellone S. et al., 2004)
equally between preterm and SGA newborns, and full term and AGA, without differences with respect to gender. Moreover, no correlations were found between AG and auxological parameters (Martos-Moreno GA. Et al., 2009, Pirazzoli P. et al., 2005, Lanyi E. et al., 2004). Recently, Mendez- Ramirez et al. (Mendez-Ramırez F. et al., 2009) measured UAG levels in AGA and SGA newborns at the age of 1 week of life, showing that UAG was higher in SGA compared with AGA NN. To date, no authors have studied UAG levels in cord blood. In our study, we opted to use an assay based on a double-antibody sandwich technique where a monoclonal antibody specific to the C-terminus of ghrelin is coated onto the multiwell plate and detection is performed by an acetylcholinesterase labeled antibody specific to the N-terminus of ghrelin, therefore sandwiching AG when present. This ELISA kit has been demonstrated to have greater assay specificity, particularly with respect to nutritional states (Prudom C. et al., 2010). Using the same assay, we have previously discussed data related to AG and UAG in prepubertal and pubertal NW and OB children (Bellone S. et al., 2004, study 1). In this study, our data demonstrates that the AG/UAG ratio is very different in the venous cord blood of NN compared with later in life, demonstrating lower AG and higher UAG levels than NW and OB children. Interestingly, AG/UAG ghrelin ratio is lower in NN than in children, considering the prepubertal age and pubertal age. This is supported by studies in rat embryos, where elevated plasma concentrations of UAG and lower AG were demonstrated, with a circulating AG/UAG ratio that increased from fetal day 20 to postnatal days (Chanoine JP. Et al., 2004). A possible hypothesis is that UAG levels could be higher at birth, reflecting the fetal state, due to the immaturity of the GOAT system that turns UAG into the AG form. This enzyme has recently been discovered to be responsible for ghrelin octanoylation, but its physiological role and regulation is at present unclear, particularly in the fetal state and childhood. Furthermore, the placenta has been demonstrated to express very low levels of the GOAT transcript (Young J. et
al., 2008, Gutierrez JA, 2008). Some authors have described the regulation of UAG and AG with respect to metabolic impairments in adulthood. Rodriguez et al. (Rodriguez A. et al., 2009) demonstrated that OB subjects with respect to lean individuals had increased levels of AG and decreased UAG. Barazzoni et al. (Barazzoni R. et al., 2007) demonstrated that AG/UAG ratio in patients with metabolic syndrome was increased and positively correlated with insulin resistance indexes compared with non-OB subjects. Pacifico et al. (Pacifico L. et al., 2009) showed lower UAG levels and higher AG/UAG ratio in patients with metabolic syndrome than in those without metabolic syndrome. Therefore, at present, the available information seems to suggest that pathological conditions may likely influence ghrelin form levels and their ratio.
In the literature, acute AG administration in adult subjects induced a rapid increase in glucose and insulin levels with AG related to insulin resistance. On the contrary, UAG prevented AG effects when co-administered with AG and its levels have been found to be negatively associated with insulin levels and insulin resistance (Broglio F. et al., 2004, Van der Lely AJ. Et al., 2009). Also in our study UAG levels and insulin showed a negative correlation, suggesting a major metabolic implication of UAG rather than AG in the neonatal period. Taking into account data in the literature together with our data, we can speculate that the peculiar state of ghrelin secretion in venous cord blood and the negative correlation between UAG and insulin levels, is focused to improve insulin sensitivity in the fetal state. Therefore, at birth, UAG could have a different role with respect to AG. Our data strengthens the importance of the different AG/UAG ratio, proposing a role in metabolic function and fetal growth. Accordingly, NN showed insulin levels similar to NW and lower than in OB children. Insulin levels primarily contribute to neonatal growth as insulin is one of its major hormone regulators promoting lipogenesis, glycogenesis, and protein synthesis (Fant ME & Weisoly D, 2001).
There is a high degree of controversy regarding the relationship between ghrelin and anthropometric parameters. A negative association between UAG and birth weight has been demonstrated by Mendez-Ramirez et al. (Mendez-Ramırez F. et al., 2009) suggesting that diminished body weight induces different adaptive signals. A recent study by Martos-Moreno et al. (Martos-Moreno GA. Et al., 2009) assessing both preterm and term newborns, failed, like us, to demonstrate any association between AG and anthropometric indices, including ponderal index. Our study is in line with the majority of studies failing to find an association at birth, even if it has to be considered that our population includes only AGA NN. Moreover, both forms of ghrelin were independent of gender. The data in the literature are concordant with these results in NN (Martos-Moreno GA. Et al., 2009, Pirazzoli P. et al., 2005). The type of delivery does not influence ghrelin levels in our study nor in the literature (Bellone S. et al., 2004, study 1, Mendez-Ramırez F. et al., 2009, Bellone S. et al., 2004).
In conclusion, our study demonstrated that in physiological conditions, NN show higher UAG and lower AG levels compared with children in later life, resulting in a lower AG/UAG ratio. This hormonal pattern and the negative correlation between UAG and insulin levels would suggest a different metabolic function at birth. These peculiarities could be related to rapid hormonal and metabolic changes that could influence weight gain in early postnatal life. As such, it is important that further studies be performed to clarify the exact role of different ghrelin forms in fetal and postnatal life.
2.3 Study 3
Title
Unacylated, acylated ghrelin and obestatin levels are differently
inhibited by oral glucose load in pediatric obesity: Association with
insulin sensitivity and metabolic alterations.
Aim of the Study
The first aim of this study was to detail post-OGTT AG, UAG and OBST dynamics in obese children and adolescents. A further aim was to explore if insulin resistance and metabolic alterations clustering in MS could be related to the fasting and glucose-induced regulation of the three peptides.
Subjects and Methods
From November 2008 to December 2010, 30 prepubertal and 40 pubertal pediatric subjects with primary obesity and a body mass index (BMI) equal or higher than 97th percentile were consecutively enrolled. They were sedentary (engaging in less than 1 or 2 h per week of mild physical activity at school). Obesity linked to genetic syndromes or organic dysfunctions like craniopharingiomas were excluded. Exclusion criteria also included the presence of type 1 and 2 diabetes, renal dysfunction, liver steatosis and other conditions known to influence body composition and energy balance (insulin and glucocorticoid treatments, endocrine diseases including sleep apnea syndrome). A group of 22 age-matched lean controls were also recruited. They engaged 6 h per week of moderate or vigorous physical activity. Physical activity was recorded by a register and was not instrumentally measured. All subjects regularly went to school and their socio-cultural environment was similar with a medium-high social extraction. Subjects underwent a complete clinical and auxological evaluation by a trainee research team using the Italian growth charts (Cacciari E. et al., 2006, Appendix 2). Auxological measurements on children have been described in study 1. Patients were divided into prepubertal (stage 1) and pubertal (stages 2e5) subjects. The waist-to-height ratio was calculated by dividing waist circumference (cm) by waist-to-height (cm) and used as another surrogate measure of central fat distribution. Systolic and diastolic blood pressure were measured three times on the left arm and after 15 min at rest in the supine position by using a standard mercury sphygmomanometer; the average was recorded and stratified according to pediatric percentiles of National High Blood Pressure Education Program Working Group on High Blood Pressure in Children and Adolescents (Pediatrics 2004, Appendix 4). Children and adolescents underwent an evaluation of metabolic alterations clustering in MS by using the modified NCEP-ATP III criteria of Cruz and Goran (Cruz ML. & Goran MI., 2004, Appendix 5). Impaired fasting
glucose and impaired glucose tolerance were defined according to MS and American Diabetes Association classifications. Accordingly, MS was defined by the presence of 3 or more of the following 5 criteria: 1) waist circumference _ 90th percentile for age and gender; 2) triglycerides (TG) _ 90th percentile for age and gender; 3) HDLcholesterol _ 10th percentile for age and gender; 4) impaired fasting glucose or glucose tolerance; 5) blood pressure _ 90th percentile for age and gender. Waist circumference percentiles were defined according to sex and age (McCarthy HD. et al., 2001, Appendix 3) Triglycerides and HDLcholesterol percentiles were considered in accordance to distribution based on American Academy of Pediatrics cut-off values (Daniels SR. et al., 2008).
After a 12-h overnight fast, blood samples for AG, UAG, OBST, total cholesterol, HDL-cholesterol, triglycerides, GH and IGF-I were measured. LDL-cholesterol was determined using the Friedwald formula. All subjects underwent an oral glucose tolerance test (OGTT, 1.75 g of glucose solution per kg, maximum 75 g). Blood samples were drawn for the determination of glucose and insulin every 30 min and of AG, UAG, OBST every 60 min from 00 to 1200 min. The energy intake and food requirements were defined for each subject starting from breakfast and ending at bedtime with direct questions to both children and parents and using validated food frequency questionnaires before performing tests. To assess food consumption, foods were divided according to the classic basic food groups of the Italian food pyramid elaborated by the Italian Institute of Research on Food and Nutrition. A balanced diet (50-60% of carbohydrates; 15-20% of proteins; 30% of total fats of which saturated less than 7%) was suggested in the two weeks before the study; the daily dietary intake was calculated mirroring that registered at the moment of recruitment to avoid weight and hormonal changes. The area under the curve (AUC) for parameters after OGTT was calculated according to the trapezoidal rule. The stimulus for insulin secretion related to