Determining the Thickness and Completeness of the Shell of
Polymer Core
−Shell Nanoparticles by X‑ray Photoelectron
Spectroscopy, Secondary Ion Mass Spectrometry, and Transmission
Scanning Electron Microscopy
Anja Müller,
†Thomas Heinrich,
†Sven Tougaard,
‡Wolfgang S. M. Werner,
§Martin Hronek,
§Valentin Kunz,
†Jörg Radnik,
†Jörg M. Stockmann,
†Vasile-Dan Hodoroaba,
†Sigrid Benemann,
†Nithiya Nirmalananthan-Budau,
∥Daniel Geißler,
∥Katia Sparnacci,
⊥and Wolfgang E. S. Unger
*
,† †Bundesanstalt für Materialforschung und -prüfung (BAM), Unter den Eichen 44-46, 12203 Berlin, Germany‡University of Southern Denmark, Campusvej 55, 5230 Odense, Denmark §Technische Universität Wien, Wiedner Hauptstraße 8-10, 1040 Wien, Austria
∥Bundesanstalt für Materialforschung und -prüfung (BAM), Richard-Willstätter-Straße 11, 12489 Berlin, Germany ⊥Università del Piemonte Orientale, Viale Teresa Michel 11, 15121 Alessandria, Italy
*
S Supporting InformationABSTRACT: Core−shell nanoparticles (CSNPs) have become indispensable in various industrial applications. However, their real internal structure usually deviates from an ideal core−shell structure. To control how the particles perform with regard to their specific applications, characterization techniques are required that can distinguish an ideal from a nonideal morphology. In this work, we investigated poly(tetrafluoroethylene)−poly(methyl methacrylate) (PTFE− PMMA) and poly(tetrafluoroethylene)−polystyrene (PTFE−PS) polymer CSNPs with a constant core diameter (45 nm) but varying shell thicknesses (4−50 nm). As confirmed by transmission scanning electron microscopy
(T-SEM), the shell completely covers the core for the PTFE−PMMA nanoparticles, while the encapsulation of the core by the shell material is incomplete for the PTFE−PS nanoparticles. X-ray photoelectron spectroscopy (XPS) was applied to determine the shell thickness of the nanoparticles. The software SESSA v2.0 was used to analyze the intensities of the elastic peaks, and the QUASES software package was employed to evaluate the shape of the inelastic background in the XPS survey spectra. For the first time, nanoparticle shell thicknesses are presented, which are exclusively based on the analysis of the XPS inelastic background. Furthermore, principal component analysis (PCA)-assisted time-of-flight secondary-ion mass spectrometry (ToF-SIMS) of the PTFE−PS nanoparticle sample set revealed a systematic variation among the samples and, thus, confirmed the incomplete encapsulation of the core by the shell material. As opposed to that, no variation is observed in the PCA score plots of the PTFE−PMMA nanoparticle sample set. Consequently, the complete coverage of the core by the shell material is proved by ToF-SIMS with a certainty that cannot be achieved by XPS and T-SEM.
■
INTRODUCTIONOften the encapsulation of nanoparticles by a shell material is indispensable not only for the preparation of the particles but also for tuning their properties. Chemical composition and thickness of this shell determine the interaction of the particles with their environment. Therefore, valid control of these two parameters means control of the particles’ performance in their specific applications. Moreover, realistic nanoparticle samples most likely deviate in some way from an ideal core−shell structure (spherical core fully encapsulated by a shell of homogeneous thickness). The real structure is normally much more complex and, therefore, the information from more than one analytical technique is required for a comprehensive description in most cases. In this paper, we demonstrate how the combined application of X-ray photoelectron spectroscopy
(XPS), time-of-flight secondary-ion mass spectrometry (ToF-SIMS), and transmission scanning electron microscopy (T-SEM) can be used to elucidate the complex internal structure of polymer core−shell nanoparticles (CSNPs).
Poly(tetrafluoroethylene) (PTFE) nanoparticles are highly interesting additives for advanced polymer composite materials with applications in building, automotive, and aerospace industries. Their intrinsic properties include thermal stability, chemical inertness, flame resistance, and a low dielectric constant.1 However, low compatibility and adhesion lead to agglomeration of the PTFE nanoparticles in a corresponding
Received: October 1, 2019
Revised: November 6, 2019
Published: November 12, 2019
Article
pubs.acs.org/JPCC Cite This:J. Phys. Chem. C 2019, 123, 29765−29775
Derivative Works (CC-BY-NC-ND) Attribution License, which permits copying and redistribution of the article, and creation of adaptations, all for non-commercial purposes.
Downloaded via UNIV DEL PIEMONTE ORIENTALE on March 27, 2020 at 18:39:34 (UTC).
polymer matrix. The application of a poly(methyl methacry-late) (PMMA) or polystyrene (PS) coating onto the nanoparticles prevents this agglomeration and, thus, facilitates the synthesis of composite materials with a homogeneous distribution of PTFE.2,3 All CSNPs investigated in this paper consist of a PTFE core and a PMMA or PS shell. All samples have the same average core diameter of 45.4 nm but different shell thicknesses varying between 3.9 and 50.8 nm (sizes from T-SEM). Thefirst set comprises four samples and will, in the following, be referred to as PTFE−PMMA(1)−(4), whereas the second set comprises six samples and will, in the following be, referred to as PTFE−PS(1)−(6). Here, increasing Arabic numbers correspond to increasing nanoparticle shell thickness. Furthermore, the uncoated core (pure PTFE) as well as pure PMMA and PS particles have been measured as references. These will, in the following, be referred to as PTFE-Ref, PMMA-Ref, and PS-Ref.
XPS is a powerful tool for the investigation of nanoparticles due to its high sensitivity and an information depth of below 10 nm at Al Kα excitation. In recent years, there has been considerable effort in the XPS community to extract structural information from XPS spectra of CSNPs, including numerical methods,4 formulaic methods,5−7 as well as modelling and simulation software.8−10 In the current paper, the shell thickness of the particles is calculated by quantitative analysis of the XPS spectra in two different ways: first, by the software SESSA v2.0,9 analyzing exclusively the elastic-peak intensities and, second, by the QUASES software package,10analyzing the inelastic background signal relative to the peak intensity. While very different surface structures can result in equal elastic-peak intensities in XPS, it is always advisable to additionally look at the shape of the inelastic background of the spectra.11−13A few publications exist where the coating thickness of real CSNP samples is determined based on the analysis of the experimental elastic-peak intensities via SESSA v2.0;4,14−16 however, only a single publication by Chudzicki et al. has already addressed the analysis of the inelastic background in the experimental spectra of CSNPs.14 The authors first determine the internal structure of gold nanoparticles with an organic coating based on the analysis of elastic-peak intensities via SESSA v2.0. The obtained internal structure is subsequently used to simulate entire theoretical survey spectra (elastic peaks + inelastic background), which accurately match the experimental survey spectra. As opposed to that, in the current paper, we present, for the first time, nanoparticle coating thicknesses determined exclusively based on the inelastic background signal of experimental CSNP spectra. Moreover, Chudzicki et al. suggested that the single-sphere approximation is true when only the elastic-peak intensities are analyzed. As soon as the inelastic background is of interest, this approximation is no longer valid. They solved this problem by simulating a more complex particle morphology (array of dispersed CSNPs) for the inelastic background analysis than the one they used for the elastic-peak intensity analysis (periodic monolayer of CSNPs). Contrary to this, in the current paper, the sample preparation is adjusted. For the analysis of the elastic-peak intensities via SESSA v2.0, a densely packed multilayer of particles is prepared, while for the analysis of the inelastic background via the QUASES software package, a submonolayer distribution is prepared. Finally, in the SESSA v2.0 simulation, an ideal CSNP model with homogeneous shell thickness is applied, while in the QUASES software package, a
model with two differently weighted shell thicknesses is selected.
A detailed T-SEM analysis provides shell thicknesses that serve as reference values for the shell thicknesses determined by XPS. This T-SEM analysis is validated by a certified reference material (CRM) in the form of spherical, monodisperse PS nanoparticles enabling the traceability to the length scale.
The even lower information depth of ToF-SIMS (usually between 2 and 5 nm17) compared with that of XPS is exploited in this work to differentiate a complete encapsulation of the PTFE core by the PMMA shell from an incomplete encapsulation by the PS shell. Principal component analysis (PCA) of the ToF-SIMS spectra turned out to be a very straightforward method to clearly distinguish between the two scenarios. In addition, in the scores plot of the PTFE−PS sample set, a systematic variation can be observed as the amount of PS relative to PTFE at the nanoparticle surface increases with increasing shell thickness.
■
MATERIALSPTFE-Ref. The PTFE nanoparticles (Hyflon MFA 100 LS latex) suspended in water with a concentration of 337 mg/mL were kindly supplied by Solvay Specialty Polymers. It is a special grade of a perfluoroalkoxy polymer resulting from the polymerization of tetrafluoroethylene (TFE) and perfluor-omethylvinyl ether (PFPME). Less than 1% of the polymer units are PFPME comonomers.2
PMMA-Ref. The PMMA nanoparticles suspended in water were purchased from Bangs Laboratories, Inc. (Fishers, Indiana) under the product name PP02N. A concentration of 102 mg/mL is stated by the manufacturer.
PS-Ref. The PS nanoparticles suspended in water were synthesized by emulsion polymerization under an argon atmosphere. A 400μL aqueous solution of the radical starter, potassium persulfate (PPS) (0.148 mmol), was added to a mixture of 5200μL of surfactant sodium dodecyl sulfate (SDS) (0.042 mmol) and 1300μL of styrene monomer (11.36 mmol) in an aqueous solution at 70 °C. The reaction mixture was stirred at 350 rpm for 4 h at 70 °C. After cooling to room temperature, the particle suspension was diluted sixfold. To remove large chunks, the suspension was centrifugated two times at 15 000g for 2 min and the supernatants were collected. For all further experiments, the combined supernatant was used after three further centrifugation and washing steps at 21 000g for 1 h for removing the SDS and PPS containing supernatant. Thefinal concentration was 2 mg/mL.
PTFE−PMMA(1)−(4) and PTFE−PS(1)−(6). The CSNPs suspended in water were synthesized by emulsifier-free batch seeded emulsion polymerization in the presence of the PTFE-Ref seed particles.3Using varying ratios of PTFE-Ref seeds and monomers, different shell thicknesses were generated. The exact ratios are listed in Section 1 of the Supporting Information. All CSNPs were obtained according to the following general procedure. The polymerizations were carried out in a 1 Lfive-neck jacketed reactor at 75 °C equipped with a condenser, a mechanical stirrer, a thermometer, and inlets for nitrogen and monomers. The appropriate amount of PTFE latex was introduced into the reactor containing 500 mL of deionized water at room temperature with a stirring rate of 300 rpm. The mixture was purged with nitrogen, and nitrogen was flowed during the entire polymerization procedure. The mixture was then heated to 80 °C, and the appropriate
amount of monomer was added. After an additional 15 min equilibration time, an aqueous PPS solution (10 mL, 0.74 mmol) was added, and the mixture was reacted for 24 h. The obtained suspensions were purified from the unreacted monomer by repeated dialysis using a membrane with molecular weight cutoff at 12.4 kDa.
PS-ST-0.1. This PS nanoparticle size standard was purchased from the company microparticles GmbH (Berlin, Germany) under the product name, PS-ST-0.1, and is a CRM traceable to the length scale. The certified average particle diameter is 107 nm with a measurement uncertainty of±2 nm.
■
METHODSSample Preparation for XPS (SESSA v2.0) and ToF-SIMS. Silicon wafers (1.0× 1.0 cm2; 100 crystal orientation)
were purified by consecutive sonication in 2% aqueous Hellmanex III solution, isopropyl alcohol, and ethanol. After drying the wafers using a nitrogen spray gun, their surface was treated for 20 min using a UV ozone cleaner UVC-1014 (185 and 254 nm wavelength UV radiation source) manufactured by NanoBioAnalytics (Berlin, Germany). A 40 μL drop of the original undiluted nanoparticle suspension was deposited onto the wafer and then spin-coated using a SPIN150i-NPP single substrate spin processor manufactured by SPS Europe (Putten, Netherlands). The following spin-coating program was applied: step (1), acceleration with 500 rpm/s to 1000 rpm kept for 5 s; step (2), acceleration with 1000 rpm/s to 2000 rpm kept for 3 min. The same samples were usedfirst for ToF-SIMS and then for XPS measurements. For the XPS measurements, a new location on the sample different from the ToF-SIMS measurement location was selected.
Sample Preparation for XPS (QUASES). The original suspensions were diluted by a factor of 50 for samples PTFE− PS(1), PTFE−PMMA(1), and PTFE−PMMA (2) and by a factor of 100 for samples PTFE−PS(3) and PTFE−PS(4). Apart from that, the sample preparation procedure was the same as the one described in the previous paragraph.
XPS Measurements. All measurements were performed with an AXIS Ultra DLD photoelectron spectrometer manufactured by Kratos Analytical (Manchester, U.K.). XPS spectra were recorded using monochromatized Al Kα radiation for excitation, at a pressure of approximately 5× 10⁻⁹mbar. The electron emission angle was 0°, and the source-to-analyzer angle was 60°. The binding energy scale of the instrument was calibrated following a Kratos Analytical procedure, which uses ISO 15472 binding energy data.18 Spectra were taken by setting the instrument to the hybrid lens mode and the slot mode providing an analysis area of approximately 300× 700 μm2. Furthermore, the charge neutralizer was applied. Survey
spectra were recorded with a step size of 1 eV and a pass energy of 80 eV, and high-resolution spectra were recorded with a step size of 0.1 eV and a pass energy of 20 eV.
ToF-SIMS Measurements. All sample measurements were performed without further pretreatment on a ToF.SIMS IV instrument (ION-TOF GmbH, Münster, Germany) of the reflectron type, equipped with a 25 keV bismuth liquid metal ion gun (LMIG) as a primary ion source mounted at 45° with respect to the sample surface. The LMIG was operated at 0.5 μA emission current in the so-called “high current bunched” mode (high mass resolution, low lateral resolution). Bi32+was
selected as the primary ion by appropriate massfilter settings. To improve the focus of the primary ion beam, the pulse width of the Bi32+(25 keV) ion pulse was reduced to 22.3 ns and the
lens target was adjusted to obtain a sharp image on a structured sample (e.g., silver cross) in the secondary electron mode. For samples with very intense signals, the primary ion-beam pulse was reduced to 2.0 ns to achieve a count per shot rate of less than 1. The primary ion current was determined using a Faraday cup located on a grounded sample holder. Operation conditions with these settings comprised a target current of 0.48−0.35 pA for the selected primary ion. The total primary ion dose density was set to 1× 10¹²ions/cm2ensuring
static SIMS conditions. Scanning area for analysis was 150× 150 μm2with 128 × 128 pixels. The vacuum in the analysis
chamber was in the range of 10−9 mbar during all measurements.
All ToF-SIMS spectra were acquired in positive ion mode withfive different scanning areas per sample. The mass scale was internally calibrated using a number of well-defined and easily assignable secondary ions. For samples without PTFE fragments in the spectra, CH2+, C3H4+, and C5H2+were taken.
When PTFE fragments were measured, C2F3+was taken as an
additional peak for calibration. The error in calibration for all spectra was kept at around 10 ppm.
PCA. PCA was performed using the Solo+ Mia toolbox (v7.5.2, Eigenvector Research Inc.), which was run under MATLAB (v7.9.0.529, MathWorks Inc.). The peak list creation strategy to perform PCA was carried out by selecting over 400 peaks in the mass range of 0−350 m/z for all samples. Each peak was normalized to the sum of the selected peak intensities to correct for variations in the total secondary ion yields between different spectra. The data were then mean-centered.
Sample Preparation for T-SEM (PTFE-Ref). The original suspension was diluted with ultrapure water by a factor of 10 000. The suspension was filtered using a syringe filter purchased from General Electric Healthcare (Chicago) with a fiberglass membrane and a pore size of 1.2 μm. A 6−10 nm thick carbonfilm on a 3.05 mm diameter and 10−12 μm thick copper transmission electron microscopy grid of 200 lines/in. purchased from PLANO GmbH (Wetzlar, Germany) was purified for 30 min in a UV/ozone cleaner as identified above. A 5μL drop was applied onto the carbon film of the copper grid and spin-coated using a spin-coater as identified above. The following spin-coating program was applied: step (1), acceleration with 500 rpm/s up to 1000 rpm kept for 10 s; step (2), acceleration with 500 rpm/s up to 5000 rpm kept for 10 s; step (3), acceleration with 500 rpm/s up to 10 000 rpm kept for 1 min.
Sample Preparation for T-SEM (PMMA-Ref, PS-Ref, PTFE−PMMA(1)−(4), PTFE−PS(1)−(6), PS-ST-01). The original suspensions were diluted with ultrapure water by a factor of 1000 in the case of PTFE−PS(2) and by a factor of 50 in the case of all other samples. The suspensions were filtered using the same kind of syringe filter previously described. A 2 μL drop was applied onto the same kind of copper transmission electron microscopy grid previously described.
T-SEM Measurements. Measurements were performed using an SEM Zeiss Supra 40 equipped with a high-resolution cathode (Schottkyfield emitter) and using a dedicated sample holder in combination with the available secondary electron detector, as described in detail elsewhere.19 The detailed instrument settings are summarized inTable S34. The image processing software, ImageJ 1.52e, was applied for further analysis of the T-SEM micrographs.20
■
RESULTS AND DISCUSSIONTransmission Scanning Electron Microscopy. T-SEM micrographs of the CSNP samples shown in Figure S16
confirm the increase of the shell thickness both from PTFE− PMMA(1) to (4) and from PTFE−PS(1) to (6). In accordance with previous investigations of equivalent CSNP systems, the T-SEM micrographs additionally reveal in the case of the PTFE−PMMA sample set a complete and in the case of the PTFE−PS sample set an incomplete encapsulation of the core by the shell material.2,21The reason is the inability of the PTFE seeds to fully penetrate the monomer droplets in the styrene−water emulsion during synthesis. As an example,
Figure 1depicts the T-SEM micrographs of the samples with
the smallest and the largest diameter of both nanoparticle sample sets. For all six PTFE−PS samples, the PTFE cores are exposed at the nanoparticle surface (indicated by the purple arrows inFigure 1). Consequently, the amount of PS relative to PTFE at the nanoparticle surface increases with increasing thickness of the shell.
Nanoparticle dimensions [total diameter (⌀CSNP), core
diameter (⌀core), and shell thickness (dshell)] were extracted from the T-SEM micrographs using the software, ImageJ 1.52e.20A stepwise analysis procedure can be found inSection 3.1.2 of the Supporting Information. The analyzed particle diameter is the Feret diameter defined as the longest distance between any two points along the selection boundary.22 To optimize the quality of the T-SEM micrographs for all samples, PTFE−PMMA(1)−(4), PTFE−PS(1)−(6), and PTFE-Ref, six different settings of the scanning electron microscope were applied. These settings are summarized inTable S34. To verify that the combination of T-SEM instrument settings and subsequent ImageJ 1.52e analysis yields reliable results, a CRM (PS-ST-0.1, traceable to the length scale) manufactured by the microparticles GmbH (Berlin, Germany) was measured at the same six instrument settings and analyzed using one and the same ImageJ 1.52e procedure. Due to its similarity in size and material to the investigated CSNPs, the PS-ST-0.1 standard is considered appropriate for validation. The 10 measurements of the CRM reveal mean particle diameters in very good agreement with the mean particle diameter certified by the manufacturer with a maximum deviation of 4.0 nm (seeTable S35 and Figure S20). Thus, the approach for traceable size measurement used in this study could be successfully validated. The nanoparticle dimensions obtained from T-SEM measurements are summarized in Table 1. The particle size distribution histograms of all CSNPs as well as the naked cores PTFE-Ref could be very accurately fitted with normal distributions (seeFigures S17−S19). Mean diameters ⌀ and standard deviationsσ inTable 1are characteristic quantities of these normal distributions. Because there is no material contrast for core and shell, it is impossible to extract the shell thickness directly from the T-SEM micrographs. Instead, it is determined indirectly by subtracting the average core radius from the average total radius. Measurement uncertain-Figure 1. T-SEM micrographs of selected PTFE−PMMA and
PTFE−PS CSNP samples with the smallest and the largest average diameter for each set. Purple arrows indicate the location of holes in the PS shell. All scale bars equal 100 nm.
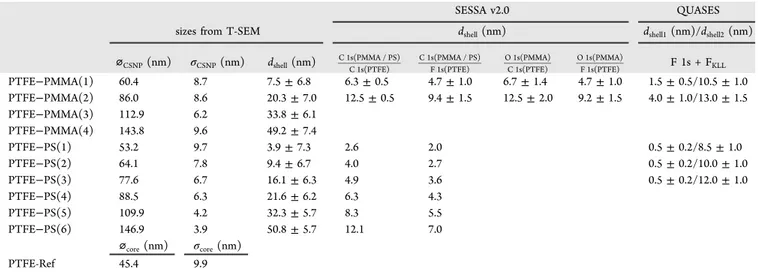
Table 1. Comparison of Nanoparticle Sizes from T-SEM with the Shell Thicknesses from XPSa
SESSA v2.0 QUASES
sizes from T-SEM dshell(nm) dshell1(nm)/dshell2(nm)
⌀CSNP(nm) σCSNP(nm) dshell(nm) C 1s(PMMA / PS)C 1s(PTFE) C 1s(PMMA / PS)F 1s(PTFE) O 1s(PMMA)C 1s(PTFE) O 1s(PMMA)F 1s(PTFE) F 1s + FKLL
PTFE−PMMA(1) 60.4 8.7 7.5± 6.8 6.3± 0.5 4.7± 1.0 6.7± 1.4 4.7± 1.0 1.5± 0.5/10.5 ± 1.0 PTFE−PMMA(2) 86.0 8.6 20.3± 7.0 12.5± 0.5 9.4± 1.5 12.5± 2.0 9.2± 1.5 4.0± 1.0/13.0 ± 1.5 PTFE−PMMA(3) 112.9 6.2 33.8± 6.1 PTFE−PMMA(4) 143.8 9.6 49.2± 7.4 PTFE−PS(1) 53.2 9.7 3.9± 7.3 2.6 2.0 0.5± 0.2/8.5 ± 1.0 PTFE−PS(2) 64.1 7.8 9.4± 6.7 4.0 2.7 0.5± 0.2/10.0 ± 1.0 PTFE−PS(3) 77.6 6.7 16.1± 6.3 4.9 3.6 0.5± 0.2/12.0 ± 1.0 PTFE−PS(4) 88.5 6.3 21.6± 6.2 6.3 4.3 PTFE−PS(5) 109.9 4.2 32.3± 5.7 8.3 5.5 PTFE−PS(6) 146.9 3.9 50.8± 5.7 12.1 7.0 ⌀core(nm) σcore(nm) PTFE-Ref 45.4 9.9 a⌀
CSNPand⌀coreare the nanoparticle diameters, whileσCSNPandσcoreare the standard deviations of the normal distributions used tofit the particle size distribution histograms (seeFigures S17−S19). dshellis the shell thickness.
ties between 5.7 and 7.3 nm have been calculated for the shell thicknesses from T-SEM. A detailed explanation of the uncertainty estimation can be found in Section 3.3 of the Supporting Information.
Among the PTFE−PS samples, σCSNP continuously
decreases with increasing ⌀CSNP. In other words, samples
with larger shell thickness exhibit a lower polydispersity. This self-sharpening effect of the particle size distributions can be explained by competitive growth mechanisms during the emulsion polymerization, which have been described in the literature for latex particles with diameters below 150 nm.23 The system develops toward the thermodynamically more favorable lower surface-to-volume ratio by small nanoparticles growing faster than large nanoparticles. The same tendency is expected to be observed among the PTFE−PMMA samples; however, this is not the case. Instead, σCSNP remains rather constant among different values of ⌀CSNP. An explanation
could be that the total particle diameter range covered by the PTFE−PMMA samples is smaller than the range covered by the PTFE−PS samples. Furthermore, the primary electron beam causes slight deformations of the PMMA shell in contrast to the PS shell, which could lead to a broadening of the particle size distributions. Previous investigations of equivalent polymer CSNP samples have shown that no secondary nucleation occurs during the growth of the PMMA or PS shell onto the PTFE cores. This means that no pure PMMA or PS particles, but exclusively CSNPs, should be present.24
X-ray Photoelectron Spectroscopy. Survey Spectra of PTFE−PMMA CSNPs. The XPS survey spectrum of PTFE− PMMA(1) shown in Figure S8 contains signals from all constituents of the nanoparticles: carbon, oxygen, andfluorine. By optimizing the sample preparation, it was possible to generate a closed nanoparticle multilayer of homogeneous thickness and, thus, to avoid the appearance of signals from the silicon wafer in the spectrum. This is important for a
quantitative analysis of the nanoparticle XPS spectra. Signals from the native oxide layer and potential carbon contami-nations on the silicon wafer would coincide with the O 1s and C 1s signals from the nanoparticles and, in the worst case, render their analysis impossible. If no Si 2p signal is detected in the spectrum, the C 1s and O 1s peak areas can be assigned to the nanoparticles exclusively. In the survey spectra of PTFE− PMMA(2) and PTFE−PMMA(3) no silicon can be detected either, while the survey spectrum of PTFE−PMMA(4) contains a minor Si 2p signal caused by gaps in the nanoparticle multilayer on the substrate (seeFigure S8).
The increase in the PMMA shell thickness from sample PTFE−PMMA(1) to (4), which was already observed in the T-SEM micrographs, is confirmed by the decrease of the F 1s signal in the XPS survey spectra. The F 1s photoelectrons from the core material PTFE are inelastically scattered while passing through the PMMA shell and, thus, the signal intensity is attenuated. While the F 1s signal of PTFE−PMMA(1) is very intense, the signal from PTFE−PMMA(2) is small [decrease of 85% compared to PTFE−PMMA(1)] and in the survey spectra of PTFE−PMMA(3) and (4) it is already close to the detection limit. Even though for samples PTFE−PMMA(2)− (4) the average shell thickness calculated from T-SEM micrographs is significantly larger than the z95XPS information
depth25of F 1s photoelectrons in PMMA at Al Kα excitation (7.7 nm), the F 1s signal is detectable for all of them. Combined with the assumption of a complete coverage of the core by the shell material based on T-SEM analysis, this indicates a heterogeneity of the shell thickness. This result is most likely caused by a displacement of the PTFE core relative to the CSNP center.
Survey Spectra of PTFE−PS CSNPs. The XPS survey spectra of PTFE−PS shown inFigure S9also contain signals from all constituents of the nanoparticles, carbon, and fluorine; however, additionally a minor oxygen signal is observed, Figure 2.XPS high-resolution spectra of samples PTFE−PMMA(1) and PTFE−PS(1) together with chemical structures of the core material PTFE and of the two different shell materials PMMA and PS. The colors indicate which carbon, oxygen, and fluorine atoms belong to which signal in the C 1s, O 1s, and F 1s XPS spectra. Red lower-case letters identify chemical species in the PMMA molecule that lead to different signals in the XPS C 1s and O 1s spectra. The spectra are background-subtracted and the binding energy axis is calibrated with respect to C 1s(C−H) at 285.0 eV. A full set of spectra for both sample sets is given inSections 2.3−2.8of the Supporting Information.
which probably originates from synthesis residues. None of the survey spectra from the PTFE−PS samples shows any signals from the silicon wafer. The increase of the relative amount of PS at the nanoparticle surface with increasing shell thickness from PTFE−PS(1) to (6) is confirmed by the continuous decrease of the F 1s signal relative to the C 1s signal in the survey spectra.
Even though the shell thicknesses calculated from T-SEM are larger than the z95 XPS information depth of F 1s photoelectrons in PS (7.5 nm), a clear F 1s signal is detectable for all samples, PTFE−PS(1)−(6). The shell thicknesses from T-SEM of samples PTFE−PS(5) and (6) are almost equal to the shell thicknesses of samples PTFE−PMMA(3) and (4). Nevertheless, the F 1s signals in the PTFE−PS survey spectra are much more intense, which is consistent with the scenario of the core encapsulation by the PMMA shell being complete and the encapsulation by the PS shell being incomplete. The heterogeneity of the shell thickness and its origin already discussed for the PTFE−PMMA nanoparticles apply here as well.
Shell Thickness Determination by SESSA v2.0. The shell thickness of CSNPs can be estimated from the ratio of specific component peak intensities characterizing core and shell materials. In the case of PMMA, the peak area C 1s(PMMA) is the combined area of the four signal components C(a), C(b), C(c), and C(d) in Figure 2. The peak area O 1s(PMMA) is the combined area of the two signal components O(e) and O(f) inFigure 2. The peak area C 1s(PS) is the combined area of the main component C(C−H, C⎔C) together with the areas of the fourπ−π* satellite signals. For the PTFE−PMMA nanoparticle samples, the following four peak intensity ratios are available: C 1s(PMMA)/C 1s(PTFE), C 1s(PMMA)/F 1s(PTFE), O 1s(PMMA)/C 1s(PTFE), and O 1s(PMMA)/F 1s(PTFE). For the PTFE−PS nanoparticles, only two peak intensity ratios are available: C 1s(PS)/C 1s(PTFE) and C 1s(PS)/F 1s(PTFE). The experimental elastic-peak intensity ratios (corrected for the spectrometer transmission function) are compared with theoretical peak intensities simulated using the software SESSA v2.0.9 This software is capable of predicting theoretical elastic-peak intensities and also the entire XPS survey spectra, assuming a
perfect spherical CSNP (layered spheres) morphology of given dimensions. Based on the corresponding material properties (such as density, valence electrons, and energy band gap) as well as database values, including the inelastic mean free path (IMFP) of the photoelectrons and the photoionization cross section of the orbitals, SESSA v2.0 uses an efficient Monte Carlo code to generate the trajectories of the electrons between their origin and the detector through the material. To simplify the simulation and save computation time, in this work, the electron trajectories were assumed to be straight lines (neglect of elastic-scattering effects) and the single-sphere approximation was applied.26 The difference between shell thicknesses from simulations using the “straight-line approx-imation” and from simulations considering elastic-scattering effects is well below 10% (seeFigure S12). For all SESSA v2.0 simulations in this work, afixed core diameter of 45.4 nm has been used, which is the value determined by T-SEM.
However, for the investigated nanoparticle systems, a variation of ±10 nm of the SESSA v2.0 input for the core diameter does not have an impact on the shell thicknesses obtained (see Figure S12). This is equal to the standard deviation of the PTFE-Ref particles determined by T-SEM. The complete input parameters as well as the sample input scripts can be found in Sections 2.10.1−2.10.3 of the Supporting Information.
The green and blue curves in Figure 3 represent the peak intensity ratios simulated by SESSA v2.0 as a function of the nanoparticle shell thickness. The shell thickness was varied in 0.1 nm steps. The bright green and blue regions around the simulated curve indicate a variation of the IMFP of the photoelectrons by ±10%. For the intensity ratios C 1s-(PMMA)/C 1s(PTFE) and C 1s(PS)/C 1s(PTFE), the IMFPs cancel each other out and, therefore, no bright green or blue regions are displayed around the corresponding plots in
Figure 3. The filled and empty symbols identify the intersection of the simulated curves with the experimental peak intensity ratios. The abscissa value of such a symbol is the shell thickness determined for the specific sample. The upper red error bars indicate a variation of the shell peak intensity by +10% and by the core peak intensity by−10%, while the lower Figure 3.Comparison of simulated XPS peak intensity ratios as a function of the nanoparticle shell thickness obtained using SESSA v2.0 displayed together with experimental data for samples PTFE−PMMA(1)−(2) and PTFE−PS(1)−(6).
red error bars indicate a variation of the shell peak intensity by −10% and the core peak intensity by +10%.
SESSA v2.0 for the PTFE−PMMA CSNPs. In the case of the PTFE−PMMA sample set, shell thicknesses could only be determined for thefirst and second samples. For the third and fourth samples, the peak intensities from the core material were already too small to be analyzed. The results from SESSA v2.0 are summarized inTable 1together with the uncertainties caused by peak fitting and IMFP estimation. For the result from C 1s(PMMA)/C 1s(PTFE), the uncertainty is smaller because the IMFP of the photoelectrons does not play a role. For both samples, a tendency can be observed that the peak intensity ratios C 1s(PMMA)/C 1s(PTFE) and O 1s-(PMMA)/C 1s(PTFE) yield larger shell thicknesses than the ratios C 1s(PMMA)/F 1s(PTFE) and O 1s(PMMA)/F 1s(PTFE). On the one hand, the intensity ratios with C 1s(PTFE) are in almost perfect agreement with each other and, on the other hand, the ratios with F 1s(PTFE) are in almost perfect agreement with each other. Because the larger values are closer to the T-SEM results, they are assumed to be more accurate than the smaller ones. The correction for the spectrometer transmission function could be an explanation for the shell thicknesses from C 1s(PMMA)/F 1s(PTFE) and O 1s(PMMA)/F 1s(PTFE) being too low. Consequently, more accurate results can be obtained from ratios of photoelectron intensities with similar or equal kinetic energies.
All shell thicknesses from SESSA v2.0 are smaller than those from T-SEM. However, in the case of PTFE−PMMA(1), the shell thicknesses from T-SEM and SESSA v2.0 agree within the range of the error. For PTFE−PMMA(2), this is only the case for the results based on the peak intensity ratios C 1s(PMMA)/C 1s(PTFE) and O 1s(PMMA)/C 1s(PTFE), while a maximum difference of 2.6 nm remains for the results based on the intensity ratios C 1s(PMMA)/F 1s(PTFE) and O 1s(PMMA)/F 1s(PTFE). If the model of an ideal CSNP with a homogeneous shell thickness is applied in the analysis of nanoparticles with a heterogeneous shell thickness, XPS must necessarily yield a lower average thickness than T-SEM. The reason is the exponential relationship between the photo-electron intensity ratio and shell thickness (seeFigure 3). In other words, the degree of photoelectron attenuation is lower in a thinner shell than that in a thicker shell.15
SESSA v2.0 for the PTFE−PS CSNPs. In the case of the PTFE−PS sample set, shell thicknesses could be calculated for all six samples because intense photoelectron signals from the core material were detected in every case. Here, a significant deviation of the shell thicknesses by SESSA v2.0 compared with T-SEM is expected because the model of a perfect concentric CSNP applied in the SESSA v2.0 simulation strongly deviates from the real sample. The expected deviation is also the reason for not stating uncertainties for the shell thicknesses inTable 1. Due to the incomplete encapsulation of the core by the shell material, the SESSA v2.0 simulations clearly underestimate the real shell thicknesses. The under-estimation is more distinct for the C 1s(PS)/F 1s(PTFE) intensity ratio than for C 1s(PS)/C 1s(PTFE), which is consistent with the results for the PTFE−PMMA sample set discussed above. Both relative and absolute deviation from the T-SEM results increase with increasing shell thickness. These results demonstrate the severe errors that occur when XPS spectra are quantified assuming a wrong morphology of the sample.
Shell Thickness Determination by QUASES. A significant fraction of the photoelectrons is scattered inelastically while passing through the sample toward the detector. This fraction causes tails on the high binding energy side of the elastic peaks and, thereby, forms the so-called inelastic background of an XPS spectrum. Because very different surface nanostructures can result in equal elastic-peak intensities in XPS, it is always advisable to additionally look at the shape of the inelastic background of the spectra.11−13,27Because its shape strongly depends on the nanostructure of the surface, it is possible to extract overlayer thicknesses from the inelastic background.
The shell thickness determination by analysis of the inelastic background28 for both the PTFE−PMMA and PTFE−PS samples was done with the QUASES software package.10 In this software, experimental XPS spectra can be loaded and compared with theoretical spectra simulated based on user-defined in-depth concentration profiles. The heterogeneity of the shell thickness was taken into account by selecting the “Islands (Active Substrate)” analysis option provided by the software, which combines two different shell thicknesses dshell1
and dshell2 covering different fractions cov1 and cov2 of the nanoparticle core. A more detailed explanation of the input structure can be found inFigure S14. The shell thickness was determined as the topmost depth location of F-atoms in the PTFE core. The analysis was applied to the full 220 eV energy range of the FKLLAuger and F 1s peaks (seeFigure 4). The
three-parameter universal cross section29(C = 900 eV2and D
= 1200 eV2) was used, which was optimized by the analysis of a spectrum from the naked cores PTFE-Ref (seeFigure S13). Furthermore, an IMFP = 2.39 nm was estimated with the QUASES-IMFP10calculator, which is based on the TPP-2M formula.30The bestfit of the background in the regions below Figure 4.XPS spectra from PTFE−PS(1) and PTFE−PMMA(1) in the energy region of the FKLLAuger and F 1s peaks. The black plots are the experimental spectra after smoothing and subtraction of the inelastic background caused by photoelectron signals at higher kinetic energies. The purple lines are the fits from the QUASES software package. The green plots are the spectra after subtraction of the QUASESfit.
the two peaks was used as a criterion to determine the depth distribution of F-atoms.
As already mentioned, a different preparation procedure was applied to samples for the QUASES analysis than to samples for the SESSA v2.0 analysis. This was necessary because both analyses are based on the model of a single nanoparticle. However, the “single-sphere approximation” is valid only as long as the elastic-peak intensities are investigated and is no longer accurate as soon as the inelastic background is analyzed.14,26 This approximation suggests that the elastic-peak intensities obtained from a dispersed powder of CSNPs equal the elastic-peak intensities obtained from a single CSNP. Therefore, the preparation of samples with closed multilayer particle coverage for the SESSA v2.0 analysis seemed justified. However, to ensure a high similarity between the model structure and the real sample and, thus, to ensure the accuracy of the obtained shell thicknesses, a submonolayer particle coverage was prepared for the QUASES analysis. In other words, single particles were separated by a distance of several particle diameters. Due to the resulting strong contribution of SiO2 from the uncovered part of the substrate to the XPS
spectrum, the O 1s inelastic background could not be analyzed by QUASES.
Figure 4 shows the analysis of the PTFE−PMMA(1) and
PTFE−PS(1) samples as an example, while further analyses of PTFE−PMMA(2) and PTFE−PS(2)−(3) can be found in
Figure S14. The shell thicknesses dshell1and dshell2are stated in
Table 1together with the associated measurement uncertain-ties.
QUASES for the PTFE−PMMA CSNPs. The quality of the QUASESfit was significantly improved by the assumption of two differently weighted overlayer thicknesses compared with only a single thickness (see Figure S15). This confirms the heterogeneity of the shell thickness for the PTFE−PMMA sample set, which was already assumed during the qualitative analysis of the XPS survey spectra. The ability to differentiate a nonideal from an ideal structure is a clear advantage of the inelastic background analysis.
It is expected that the average shell thicknesses from SESSA v2.0 and from T-SEM are located between the two shell thicknesses from QUASES. This is the case for sample PTFE− PMMA(1). However, for sample PTFE−PMMA(2), the shell thickness from T-SEM exceeds the maximum shell thickness from QUASES. Both shell thicknesses dshell1and dshell2increase
from sample PTFE−PMMA(1) to PTFE−PMMA(2). This is consistent with a complete encapsulation of the core by the shell material.
QUASES for the PTFE−PS CSNPs. The model with two thicknesses is also suitable to cope with the analysis of the PTFE−PS samples with incomplete encapsulation of the core by the shell material (seeFigure S15). In the case of the PS-coated samples, only dshell2 increases from PTFE−PS(1) to
PTFE−PS(3), while dshell1remains constant at 0.5 nm. This is
consistent with the exposure of the PTFE core independent of the shell thickness, which was observed in the T-SEM micrographs. Because this sample set deviates even more strongly from an ideal CSNP than the PTFE−PMMA sample set, the deviation between the SESSA v2.0 and the QUASES results is larger, as well. For samples PTFE−PS(1) and PTFE− PS(2), the shell thicknesses from SESSA v2.0 and T-SEM are located between the two shell thicknesses determined by QUASES. However, for sample PTFE−PS(3), the value from T-SEM is larger.
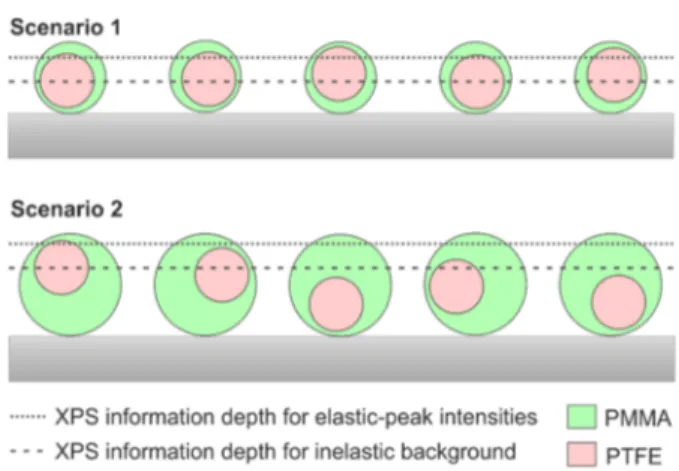
Comparison of XPS and T-SEM. For sample PTFE− PMMA(1), the results from T-SEM, SESSA v2.0, and QUASES relative to one another are reasonable taking into account the underlying assumptions of each method. However, for sample PTFE−PMMA(2), the deviation between XPS and T-SEM becomes more severe. This deviation can probably be explained by the heterogeneity of the particle shell as follows. The indirect calculation of the shell thickness by T-SEM yields an average value for a nanoparticle ensemble. As long as the shell thickness does not exceed the XPS information depth, XPS also yields an average value, representing all particles in the analysis area. In this case, the position of the particles relative to the detector does not play a role (scenario 1 in
Figure 5). This situation applies to sample PTFE−PMMA(1).
This issue is less critical for the analysis of the inelastic background because the analysis depth is ∼8 × IMFP in contrast to ∼3 × IMFP for the analysis of the elastic-peak intensities.28However, as soon as the shell thickness becomes larger than the XPS information depth, some particle cores are not detected any more depending on the position of the nanoparticle relative to the detector (scenario 2 inFigure 5). This is the case for sample PTFE−PMMA(2). This effect must necessarily lead to an even stronger underestimation of the shell thickness compared with the T-SEM results. This underestimation occurs for both the SESSA v2.0 and the QUASES results because the shell thickness of PTFE− PMMA(2) partly exceeds even the information depth of the inelastically scattered electrons. The two different scenarios explained above can similarly be applied to explain the deviation of T-SEM and QUASES for sample PTFE−PS(3).
Time-of-Flight Secondary-Ion Mass Spectrometry. The same samples measured with XPS for the SESSA v2.0 analysis were investigated by PCA-assisted ToF-SIMS. The datasets comprise spectra offive different measurement spots on the wafer of each sample. The full peak list was used for the PCA except for23Na+and39K+. Both serve as counterions for
either radical starters or surfactants during polymer synthesis. Consequently, differences in the score plots of the PCA analysis caused by these ions are not of interest for the analysis. The score plots and the PC1 loadings of both sample sets are depicted inFigure 6. All ToF-SIMS spectra together with the PC2 loading plots can be found inSection 4of the Supporting Information.
Figure 5.Schematic representation of samples PTFE−PMMA(1) and (2). For PTFE−PMMA(2), the shell thickness exceeds the z95XPS information depth depending on the position of the particle relative to the detector.
T-SEM suggests a full encapsulation of the core by the shell material for all PTFE−PMMA samples; therefore, the SIMS spectra should be very similar if not equal, as static ToF-SIMS usually only detects the uppermost layers with an information depth between 2 and 5 nm.17For the PTFE−PS samples, T-SEM suggests an incomplete encapsulation of the core by the shell material, whereas the amount of PS relative to PTFE at the nanoparticle surface increases with increasing shell thickness. Therefore, a distinct difference is expected between the ToF-SIMS spectra of the particles from this sample set. Both assumptions are confirmed by the score plots of the PCA. The PTFE−PMMA samples all cluster at almost the same value, while the PTFE−PS samples clearly show a continuous variation along PC1.
The corresponding loading plots of PC1 depicted inFigure 6c,d show the main variables of interest, and a clear separation between the core (positive loadings) and shell (negative loadings) signals can be observed. In other words, for both sample sets, a positive score in the score plot indicates a domination of the spectrum by signals from the core material, while a negative score in the score plot indicates a domination of the spectrum by the corresponding shell material.
For the PTFE−PMMA sample set, the ToF-SIMS spectra are clearly dominated by ions from the shell material PMMA. However, a minor amount offluorine-containing ions from the PTFE core can be detected in the spectrum of PTFE− PMMA(1). This situation causes a slightly less negative score on PC1 compared with the residual samples. The scores of PTFE−PMMA(2) to (3) on PC1 equal those of the pure PMMA reference sample. In contrast to that, the naked cores PTFE-Ref are located at a great distance with a clearly positive score along PC1. The arrangement of the PTFE−PMMA samples in the score plot proves that the encapsulation of the core by the shell material is complete with a certainty that could not be achieved by T-SEM or XPS.
For the PTFE−PS sample set, there is a steady development from positive to negative scores along PC1 with increasing shell thickness of the samples. While PTFE−PS(1) has a positive score close but clearly not equal to that of PTFE-Ref, sample PTFE−PS(6) has a negative score similar to but clearly different from that of PS-Ref Consequently, the score plot does not only confirm the incomplete encapsulation of the core by the shell material but it also very nicely demonstrates the increasing amount of PS relative to PTFE at the nanoparticle surface with increasing shell thickness.
■
CONCLUSIONSThe complex internal structure of PTFE−PMMA and PTFE− PS polymer CSNPs with a constant core diameter but varying shell thicknesses was investigated using a combination of XPS and PCA-assisted ToF-SIMS. In addition, T-SEM validated by a CRM (traceable to the length scale) was applied to provide reference values for the shell thicknesses determined by XPS. T-SEM suggested a complete encapsulation of the core by the shell material for the PTFE−PMMA sample set and an incomplete encapsulation for the PTFE−PS sample set. For the latter sample set, T-SEM also suggested an increasing amount of PS relative to PTFE at the nanoparticle surface with increasing shell thickness. These observations could be confirmed by the ToF-SIMS analysis, not least due to its significant surface sensitivity. The score plot of the PTFE−PS nanoparticle sample set shows a highly systematic variation, as the shell thickness increases. It is conceivable to calibrate this PCA-assisted ToF-SIMS methodology using reference samples with known properties. If this succeeded, its simplicity would make it a suitable candidate for quality assurance in a running nanoparticle production.
Shell thicknesses from XPS spectra were calculated by two different methods: first, by the software SESSA v2.0, analyzing the elastic-peak intensities and, second, by the QUASES Figure 6.(a, b) PCA score biplots prepared from ToF-SIMS spectra of PTFE−PMMA(1)−(4), PTFE−PS(1)−(6), PTFE-Ref, PMMA-Ref, and PS-Ref. (c, d) Loading plots of thefirst principal component revealed by PCA.23Na+and39K+were excluded from the PCA analysis.
software package, analyzing the inelastic background. This is thefirst time that nanoparticle shell thicknesses are presented based exclusively on the inelastic background analysis of XPS spectra. Because the inelastic background obtained from a dispersed powder of CSNPs differs strongly from the background obtained from a single particle, a special sample preparation procedure had to be applied to the samples for the QUASES analysis. A submonolayer particle coverage of the substrate was prepared, which was supposed to ensure a high similarity between the single particle model of QUASES and the real sample. In contrast to that, a closed multilayer particle coverage of the substrate was prepared for the SESSA v2.0 analysis.
Furthermore, in the SESSA v2.0 simulation, an ideal CSNP model with a homogeneous shell thickness was applied, while in the QUASES software package a model with two differently weighted shell thicknesses was selected. It could be shown that the results from SESSA v2.0, QUASES, and T-SEM relative to each other are reasonable as long as the shell thickness of the particles does not exceed the XPS information depth.
This work underlines the significance of complementary analysis for a comprehensive description of CSNPs. For a quantitative analysis of CSNPs exclusively based on the XPS elastic-peak intensities, the application of an ideal or nonideal model structure must always be justified by information from an independent technique. However, it has been demonstrated that the analysis of the inelastic background of XPS spectra can independently differentiate a nonideal from an ideal CSNP structure. Generally, no matter whether the investigation is based on the elastic-peak intensities or the inelastic back-ground, XPS is a powerful tool for the quantitative analysis even of CSNPs that deviate from ideality.
■
ASSOCIATED CONTENT*
S Supporting InformationThe Supporting Information is available free of charge at
https://pubs.acs.org/doi/10.1021/acs.jpcc.9b09258.
CSNP synthesis parameters, XPS spectra andfits, SESSA v2.0 input parameters, QUASES input parameters, T-SEM micrographs, T-T-SEM nanoparticle size histograms, T-SEM validation by CRM, T-SEM uncertainty estimation, ToF-SIMS spectra, PC2 loading plots (PDF)
■
AUTHOR INFORMATIONCorresponding Author
*E-mail:[email protected]. Tel: +49 30 8104-1823.
ORCID Anja Müller: 0000-0003-2085-3687 Wolfgang S. M. Werner: 0000-0002-4870-9137 Jörg Radnik: 0000-0003-0302-6815 Daniel Geißler:0000-0001-7550-8448 Wolfgang E. S. Unger:0000-0002-7670-4042 Author Contributions
The manuscript was written through contributions of all authors. All authors have given approval to thefinal version of the manuscript.
Notes
The authors declare no competingfinancial interest.
■
ACKNOWLEDGMENTSThe authors would like to thank Drs. Alexander G. Shard and David J. H. Cant from the National Physical Laboratory for extensive discussions about the content of this paper. This project has received funding from the European Metrology Programme for Innovation and Research (EMPIR) as part of the InNanoPart 14IND12 project as well as the ESCoShell 17SIP03 project. The EMPIR program is co-financed by the European Union’s Horizon 2020 research and innovation program and the EMPIR Participating States.
■
REFERENCES(1) Ebnesajjad, S. Introduction to Fluoropolymers: Materials, Technology, and Applications; Elsevier: Amsterdam, 2013.
(2) Giani, E.; Sparnacci, K.; Laus, M.; et al. PTFE-Polystyrene Core-Shell Nanospheres and Nanocomposites. Macromolecules 2003, 36, 4360−4367.
(3) Sparnacci, K.; Antonioli, D.; Deregibus, S.; Laus, M.; Poggio, T.; Kapeliouchko, V.; Palamone, G.; Zuccheri, G.; Passeri, R. PTFE-Based Core-Shell Nanospheres and Soft Matrix Nanocomposites. Macromolecules 2009, 42, 3518−3524.
(4) Kalbe, H.; Rades, S.; Unger, W. E. S. Determining shell thicknesses in stabilised CdSe@ZnS core-shell nanoparticles by quantitative XPS analysis using an Infinitesimal Columns model. J. Electron. Spectrosc. Relat. Phenom. 2016, 212, 34−43.
(5) Shard, A. G. A Straightforward Method For Interpreting XPS Data From Core−Shell Nanoparticles. J. Phys. Chem. C 2012, 116, 16806−16813.
(6) Cant, D. J.; Wang, Y. C.; Castner, D. G.; Shard, A. G. A Technique for Calculation of Shell Thicknesses for Core-Shell-Shell Nanoparticles from XPS Data. Surf. Interface Anal. 2016, 48, 274− 282.
(7) Belsey, N. A.; Shard, A. G.; Minelli, C. Analysis of protein coatings on gold nanoparticles by XPS and liquid-based particle sizing techniques. Biointerphases 2015, 10, No. 019012.
(8) Mohai, M. XPS MultiQuant: multimodel XPS quantification software. Surf. Interface Anal. 2004, 36, 828−832.
(9) Smekal, W.; Werner, W. S. M.; Powell, C. J. Simulation of electron spectra for surface analysis (SESSA): a novel software tool for quantitative Auger-electron spectroscopy and X-ray photoelectron spectroscopy. Surf. Interface Anal. 2005, 37, 1059−1067.
(10) Tougaard, S. QUASES-Tougaard, ver. 7.0. Software Package to Characterize Surface Nano-structures by Analysis of Electron Spectra, 2019.http://www.quases.com/.
(11) Powell, C. J.; Tougaard, S.; Werner, W. S.; Smekal, W. Sample-morphology effects on x-ray photoelectron peak intensities. J. Vac. Sci. Technol., A 2013, 31, No. 021402.
(12) Tougaard, S. Surface nanostructure determination by x-ray photoemission spectroscopy peak shape analysis. J. Vac. Sci. Technol., A 1996, 14, 1415−1423.
(13) Powell, C. J.; Chudzicki, M.; Werner, W. S.; Smekal, W. Sample-morphology effects on x-ray photoelectron peak intensities. III. Simulated spectra of model core-shell nanopartikels. J. Vac. Sci. Technol., A 2015, 33, No. 05E113.
(14) Chudzicki, M.; Werner, W. S.; Shard, A. G.; Wang, Y. C.; Castner, D. G.; Powell, C. J. Evaluating the Internal Structure of Core-Shell Nanoparticles Using X-ray Photoelectron Intensities and Simulated Spectra. J. Phys. Chem. C 2015, 119, 17687−17696.
(15) Wang, Y.-C.; Engelhard, M. H.; Baer, D. R.; Castner, D. G. Quantifying the Impact of Nanoparticle Coatings and Nonuniform-ities on XPS Analysis: Gold/Silver Core−Shell Nanoparticles. Anal. Chem. 2016, 88, 3917−3925.
(16) Belsey, N. A.; Cant, D. J. H.; Minelli, C.; Araujo, J. R.; Bock, B.; Brüner, P.; Castner, D. G.; Ceccone, G.; Counsell, J. D. P.; Dietrich, P. M.; et al. Versailles Project on Advanced Materials and Standards Interlaboratory Study on Measuring the Thickness and Chemistry of
Nanoparticle Coatings Using XPS and LEIS. J. Phys. Chem. C 2016, 120, 24070−24079.
(17) Muramoto, S.; Brison, J.; Castner, D. G. Exploring the surface sensitivity of TOF-secondary ion mass spectrometry by measuring the implantation and sampling depths of Bi(n) and C60 ions in organic films. Anal. Chem. 2012, 84, 365−372.
(18) ISO 15472:2010, Surface Chemical AnalysisX-ray Photo-electron SpectrometersCalibration of Energy Scales.https://www. iso.org/standard/55796.html.
(19) Rades, S.; Hodoroaba, V.-D.; Salge, T.; Wirth, T.; Lobera, M. P.; Labrador, R. H.; Natte, K.; Behnke, T.; Gross, T.; Unger, W. E. S. High-resolution imaging with SEM/T-SEM, EDX and SAM as a combined methodical approach for morphological and elemental analyses of single engineered nanoparticles. RSC Adv. 2014, 4, 49577−49587.
(20) Schneider, C. A.; Rasband, W. S.; Eliceiri, K. W. NIH Image to ImageJ: 25 years of image analysis. Nat. Methods 2012, 9, 671−675. (21) Kapeliouchko, V.; Palamone, G.; Poggio, T.; Zuccheri, G.; Passeri, R.; Sparnacci, K.; Antonioli, D.; Deregibus, S.; Laus, M. PMMA-based core-shell nanoparticles with various PTFE cores. J. Polym. Sci., Part A: Polym. Chem. 2009, 47, 2928−2937.
(22) Ferreira, T.; Rasband, S. ImageJ User Guide, IJ 1.46r; NIH, 2012.
(23) Chern, C.-S. Principles and Applications of Emulsion Polymer-ization; John Wiley & Sons, 2008.
(24) Sparnacci, K.; Antonioli, D.; Deregibus, S.; Laus, M.; Zuccheri, G.; Boarino, L.; De Leo, N.; Comoretto, D. Preparation, Properties, and Self-Assembly Behavior of PTFE-Based Core-Shell Nanospheres. J. Nanomater. 2012, 2012, 1−15.
(25) ISO 18115-1:2013, Surface Chemical AnalysisVocabulary Part 1: General Terms and Terms Used in Spectroscopy.
(26) Werner, W. S. M.; Chudzicki, M.; Smekal, W.; Powell, C. J. Interpretation of nanoparticle X-ray photoelectron intensities. Appl. Phys. Lett. 2014, 104, No. 243106.
(27) Tougaard, S. Improved XPS analysis by visual inspection of the survey spectrum. Surf. Interface Anal. 2018, 50, 657−666.
(28) Tougaard, S. Accuracy of the Non-destructive Surface Nanostructure Quantification Technique Based on Analysis of the XPS or AES Peak Shape. Surf. Interface Anal. 1998, 26, 249−269.
(29) Tougaard, S. University Classes of Inelastic Electron Scattering Cross-sections. Surf. Interface Anal. 1997, 25, 137−154.
(30) Tanuma, S.; Powell, C. J.; Penn, D. R. Calculations of Electron Inelastic Mean Free Paths. Surf. Interface Anal. 1994, 21, 165−176.