R E S E A R C H
Open Access
OvAge: a new methodology to quantify ovarian
reserve combining clinical, biochemical and
3D-ultrasonographic parameters
Roberta Venturella
1*, Daniela Lico
1, Alessia Sarica
2, Maria Pia Falbo
3, Elio Gulletta
3, Michele Morelli
1, Errico Zupi
4,
Gabriele Cevenini
5, Mario Cannataro
2and Fulvio Zullo
1Abstract
Background: In the last decade, both endocrine and ultrasound data have been tested to verify their usefulness for assessing ovarian reserve, but the ideal marker does not yet exist. The purpose of this study was to find, if any, a statistical advanced model able to identify a simple, easy to understand and intuitive modality for defining ovarian age by combining clinical, biochemical and 3D-ultrasonographic data.
Methods: This is a population-based observational study. From January 2012 to March 2014, we enrolled 652 healthy fertile women, 29 patients with clinical suspect of premature ovarian insufficiency (POI) and 29 patients with Polycystic Ovary syndrome (PCOS) at the Unit of Obstetrics & Gynecology of Magna Graecia University of Catanzaro (Italy). In all women we measured Anti Müllerian Hormone (AMH), Follicle Stimulating Hormone (FSH), Estradiol (E2), 3D Antral Follicle Count (AFC), ovarian volume, Vascular Index (VI) and Flow Index (FI) between days 1 and 4 of menstrual cycle. We applied the Generalized Linear Models (GzLM) for producing an equation combining these data to provide a ready to use information about women ovarian reserve, here called OvAge. To introduce this new variable, expression of ovarian reserve, we assumed that in healthy fertile women ovarian age is identical to chronological age.
Results: GzLM applied on the healthy fertile controls dataset produced the following equation OvAge = 48.05 -3.14*AHM + 0.07*FSH - 0.77*AFC - 0.11*FI + 0.25*VI + 0.1*AMH*AFC + 0.02*FSH*AFC. This model showed a high statistical significance for each marker included in the equation. We applied the final equation on POI and PCOS datasets to test its ability of discovering significant deviation from normality and we obtained a mean of predicted ovarian age significantly different from the mean of chronological age in both groups.
Conclusions: OvAge is one of the first reliable attempt to create a new method able to identify a simple, easy to understand and intuitive modality for defining ovarian reserve by combining clinical, biochemical and
3D-ultrasonographic data. Although design data prove a statistical high accuracy of the model, we are going to plan a clinical validation of model reliability in predicting reproductive prognosis and distance to menopause.
Keywords: Ovarian reserve, Follicle Stimulating Hormone, Anti Müllerian Hormone, 3D Antral Follicle Count, Distance to menopause, Reproduction, Family planning, Generalized linear model
* Correspondence:[email protected]
1
Unit of Obstetrics and Gynecology, Magna Graecia University of Catanzaro, Viale Europa - Localitá Germaneto, 88100 Catanzaro, Italy
Full list of author information is available at the end of the article
© 2015 Venturella et al.; licensee BioMed Central. This is an Open Access article distributed under the terms of the Creative Commons Attribution License (http://creativecommons.org/licenses/by/4.0), which permits unrestricted use, distribution, and reproduction in any medium, provided the original work is properly credited. The Creative Commons Public Domain Dedication waiver (http://creativecommons.org/publicdomain/zero/1.0/) applies to the data made available in this article, unless otherwise stated.
Background
The normal process of reproductive ageing varies con-siderably among women. While some women undergo premature menopause, others have spontaneous preg-nancy in their fourth decade of life [1]. This variability, currently not predictable, is summarized in the concept of ovarian reserve, a term coined more than 25 years ago by Daniel Navot [2] and present in titles of at least 1300 papers indexed on PubMed.
Given this variability, the ability to predict the ovarian reserve both in terms of reproductive prognosis and dis-tance to menopause would be extremely important for any modern physician and gynecologist, in guiding patients’ reproductive attempts and in reducing the rates of unnecessary surgeries for benign pathologies, for which menopause may represent the best therapy.
Up to now, no test, neither single nor combined, pos-sesses a satisfactory sensitivity and specificity for clinical application [3]. The explanation to this incompetence probably lies in the conundrum of any screening test for ovarian reserve insufficiency: its prevalence changes with age and the performance of any test changes with it [4]. This concept explains why no single threshold value is usable to define an impairment of ovarian reserve, and why every test should always be interpreted based on the chronological patient’s age.
The ideal marker should be able to evaluate simultan-eously the qualitative and quantitative aspects of ovarian reserve, to integrate all the relevant information and respond with an output of clear understanding, that we could name “ovarian age”. Every woman could easily compare this number with her chronological age and the general practitioner would understand its meaning without being an expert in reproductive medicine.
With this purpose, we introduce the new concept of OvAge, a numeric variable, which accurately reflects the ovarian reserve of women. Since the ovarian age is inher-ently unknown, we assumed that OvAge coincides with the chronological age, in healthy fertile women. A large representative sample of the healthy fertile women popula-tion has been used to design a statistical model able to es-timate OvAge by a mathematical formula which accounts for patient’s biochemical and ultrasonographic as predictor variables. Biochemical variables include Follicle Stimu-lating Hormone (FSH), Estradiol (E2), Anti Müllerian
Hormone (AMH), 3D-ultrasonographic variables are Antral Follicle Count (AFC), ovarian volume, Flow index (FI), Vascularization Index (VI) and Vascularization Flow Index (VFI). We designed a Generalized Linear Model (GzLM) and we finally used the model to evaluate the clinical plausibility of OvAge estimations in women with pathologic derangements of ovarian age, like pa-tients with premature ovarian insufficiency (POI) and polycystic ovary syndrome (PCOS). In particular, the
increase or decrease of OvAge from chronological age were interpreted as a useful clinical index of physio-pathological ovarian reserve.
Materials and methods
This is a population-based study including the data of South Italy women enrolled after a delivery following a spontaneous pregnancy, or during a routine visit for cer-vical screening or contraception counselling at the Unit of Obstetrics & Gynecology and analyzed in collabor-ation with the Unit of Clinical Pathology and the School of Informatics and Biomedical Engineering, at Magna Graecia University of Catanzaro, Italy.
The study was approved by the local Ethics Committee and written, informed consensus was obtained from each woman to the anonymous use of clinical data for statistical evaluation and research purposes.
From January 2012 to March 2014 we consecutively recruited women, aged 18 to 55, who consent to partici-pate in this prospective study, with history of spontan-eous conception(s), intact ovaries and regular menses with a mean interval of 21 to 35 days.
Exclusion criteria for the selection of the training sub-jects for this model were: estrogen or progestin use or in breastfeeding the two months before enrollment, preg-nancy, history of female infertility, endometriosis, presence of ovarian follicles measuring more than 10 mm at study entry ultrasonography and other cystic masses of the ovary, history of ovarian surgery, PCOS, gynecological malig-nancy, previous radiation or chemotherapy, autoimmune disease, known chronic, systemic, metabolic and endocrine disease including hyperandrogenism, hyperprolactinemia, diabetes mellitus and thyroid diseases, hypogonadotropic hypogonadism or with history of use of drugs that can cause menstrual irregularity.
During the same enrollment period, women with clin-ical suspect of POI and women with PCOS were also enrolled, to test the ability of OvAge to detect abnormal deviation from chronological age.
POI was defined as the presence of secondary ame-norrhea before the age of 40 years associated to FSH value >30 U/L and clinical manifestations such as palpi-tations, flushes, fatigue, anxiety, depression [5]. PCOS was diagnosed according to the Rotterdam criteria [6], when at least 2 of the following 3 features existed: oligo/ amenorrhea, clinical and/or biochemical hyperandrogen-ism, and polycystic ovaries morphology (PCOM). We chose to include only PCOS women with PCOM to test our algorithm in this particular population of patients because, notwithstanding the lack of absolute evidence regarding dissimilarities involved in regulation of ovarian ageing in these women, data currently available in litera-ture suggest that the intrinsic ovarian abnormality asso-ciated with altered follicular dynamics in the PCOS
might cause a reduced rate of atresia, a delayed age of menopause and end of fertility [7].
At screening visit, all women were checked for inclu-sion and excluinclu-sion criteria by anamnesis and clinical examination. Anamnesis was collected by a standardized questionnaire aimed to investigate also past problems in conceiving and menstrual disorders.
Eligible women were asked to contact one of the in-vestigators at the first day of menstrual cycle, at least three to four months after delivery.
At study entry, basal AMH, FSH and E2, AFC, ovarian
volume, VI, FI and VFI were measured in all women between day 1 and day 4 of menstrual cycle.
Hormonal assays
Blood samples obtained by venipuncture were centrifuged, within 30 minutes from the collection, for 10 min at 3500 rpm, 4°C. Aliquots of each serum were frozen at−80°C and stored for subsequent assays of AMH, FSH and E2. To measure serum AMH levels, AMH-Gen II ELISA assay kit (Beckman Coulter) was used. The lowest detection limit of AMH is 0.08 ng/mL and the intra and interassay coefficients of variation below 3.4% and 4.0% respectively. The ECLIA method used to measure the levels of serum FSH and E2 by COBAS e411 auto-analyser (Roche Diagnostics). The lowest detection limit for FSH is 0.100 IU/L, with the intra- and interassay coefficients of variation below 2.6% and 3.5% respectively. The lowest detection limit for E2 is 18.4 pmol/L, with the intra-and interassay coefficients of variation of 2% intra-and 3%, respectively.
Giving the poor reliability of the FSH value in presence of Estradiol levels greater than 70 pg/mL, women with basal E2 levels greater than this cut off were asked to come back at the beginning of the subsequent menstrual cycle, and their data were excluded from the analysis.
Ultrasonographic data collection and post-processing
The same day of hormonal assay, a single experienced investigator (DL) performed all the ultrasound scans using a Voluson-i (GE Healthcare Ultrasound) and a 5– 9-MHz transvaginal volume transducer, which has 3D ultrasound scanning modes. Antral follicle number and vascularization indices were measured using a 3D ul-trasound dataset, with Sonography-based Automated Volume Count and Virtual Organ Computer Aided Ana-lysis Imaging Program (SonoAVC™ and VOCA™, GE Healthcare Ultrasound, Zipf, Austria), as previously de-scribed by other authors [8].
The acquired 3D ultrasound datasets were displayed in the multiplanar view. The image were optimized to gen-erate a three-dimensional volume of interest (VOI) and to ensure that the whole ovary was included without extra-ovarian information.
SonoAVC was applied for automatically identifying and quantifying hypoechoic areas within a 3D ultra-sound dataset. Post-processing, involving the manual identification of follicles not included in the previous au-tomated analysis, was then used to ensure that all antral follicles were counted. The total antral follicle count for each subject was recorded to the nearest millimeter, starting from 2.0 mm up to a maximum of 10.0 mm. Patients with ovarian follicles greater than 10 mm were asked to come back at the beginning of the subsequent menstrual cycle.
The ultrasound machine was switched to the 3D mode with power Doppler. The setting condition for this study was as follows: frequency mid; dynamic set 2; balance G >140; smooth 5/5; ensemble 12; line density 7; power Doppler map 5, sweep angle 30°. The setting condition for the sub-power Doppler mode was as follows: gain 6.0; bal-ance 140; quality normal; wall motion filter low 1; velocity range 0.9 kHz. A 3D dataset was then acquired using the medium speed sweep mode. The built-in VOCAL (virtual organ computer aided analysis) Imaging Program for the 3D power Doppler histogram analysis was used to deter-mine the ovarian volume and indices of vascularization and blood flow. Vascularization index (VI) measured the number of blood vessels in the ovary (colour voxels) and was expressed as a percentage (%) of the ovarian volume. Flow index (FI) represented the average intensity of flow inside the ovary and Vascularization flow index (VFI), made by multiplying VI and FI, was a combination of vascularization and flow. During the analysis and calcula-tion, the manual mode of the VOCAL Contour Editor was used to cover the whole 3D volume of the ovary with a 15° rotation step. Hence, 12 contour planes were ana-lyzed for each ovary to cover 180°.
The intra-observer reliability was expressed as the mean intra-class correlation coefficient (ICC) with 95% confidence interval (CI). The mean ICC (95% CI) for 3D scanning of ovarian volume, VI, FI and VFI were 0.9709 (0.8692, 0.9837), 0.9796 (0.9659, 0.9876), 0.8876 (0.7143, 0.9723) and 0.9934 (0.9761, 0.9987) respectively. The mean ICC for data acquisition of ovarian volume, VI, FI and VFI were 0.9945 (0.9745, 0.9923), 0.9845 (0.9432, 0.9954), 0.9878 (0.9621, 0.9954) and 0.9865 (0.9523, 0.9967) respectively.
Statistical analysis
A dataset of 710 records of subjects has been analyzed using Konstanz Information Miner (KNIME) v.2.9.2 and KNIME R Statistics Integration v.2.9.1 for integrating R language v.3.0.3.
The whole analysis consists in six main steps: (i) defin-ition and creation of three datasets, Healthy Controls, POIs and PCOS; (ii) descriptive statistics and statistical analysis of datasets and construction of growth curves
centile by the LMS method [9]; (iii) generation of Gener-alized Linear Models (GzLMs); (iv) choice of best model by stepwise selection, according to the Aikake Informa-tion Criterion (AIC) [10]; (v) reconstrucInforma-tion and refine-ment of the best GzLM model; (vi) evaluation and testing of the final model; (vii) application of the model on POI and PCOS datasets.
For details of statistical methods, see the Additional file 1.
Results
From January 2012 to March 2014, 840 women were screened for the enrollment. According to exclusion and inclusion criteria, 96 patients were not considered eli-gible and other 34 refused to participate, hence a total of 710 women were enrolled and analyzed.
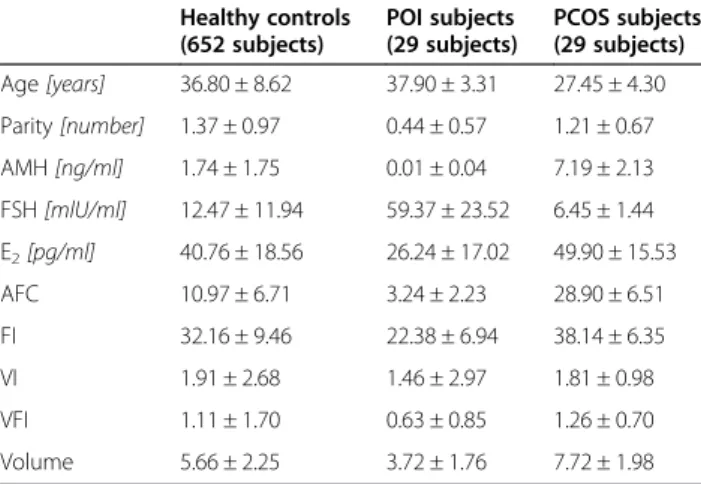
Table 1 summarizes the statistics of healthy controls (HC, 652 subjects), POIs (29 subjects) and PCOS (29 sub-jects) respectively, for age, parity, AMH, FSH, E2, AFC, FI,
VI, VFI and Volume. Spearman’s test coefficients showed statistical dependences between Age and AMH (−0.8090), FSH (0.6742), E2 (−0.2289), AFC (−0.7304), FI (−0.5649),
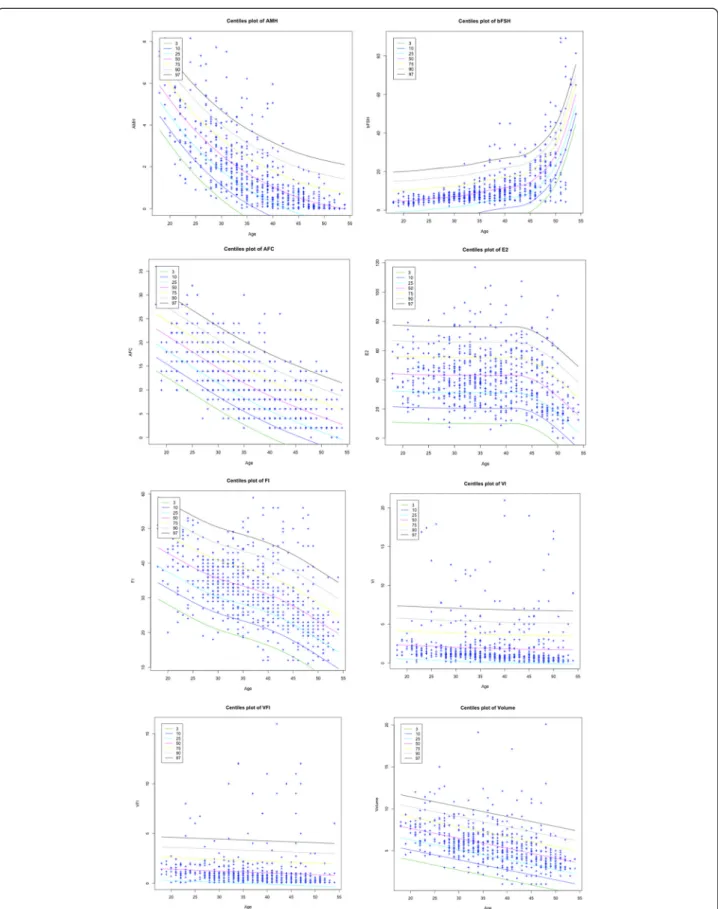
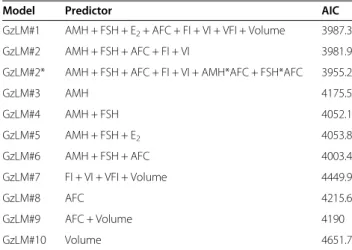
VI (−0.4066), VFI (−0.3428) and Volume (−0.5519). Holm’s method corroborated this correlation, providing significant adjusted p-values (p < 0.0001) for each dependent variable. In Figure 1 the centile curves are depicted for each feature. Table 2 presents a summary of the ten models accord-ing to the predictors chosen for the equation and reports AIC, the testing errors evaluated through the leave-one-out (LOO) and cross-validation technique.
In the first model, GzLM#1, only E2, VFI and Volume
had shown p-values greater than 0.01. These three vari-ables were then removed and a second model, GzLM#2, was created. In GzLM#2, all the five variables showed a p-value < 0.001, that together with the lowest AIC (and the
highest leave-one-out and 10-fold cross-validation accur-acy) leaded to accept this set of attributes as the best one.
The model GzLM#2* contains two more terms, AMH: AFC (p-value < 0.001) and FSH:AFC (p-value < 0.001). GzLM#2* showed a lower AIC value (3955.2) compared to the previous models. ANOVA test was performed for comparing model GzLM#2* to the null model: a p-value < 0.001 for AMH, FSH, AFC, FI, AHM:AFC, FSH:AFC and a p-value < 0.01 for VI, successfully confirmed the prediction power of the variables.
The goodness of fitness of the model GzLM#2* was first evaluated by a Chi-squared test obtaining a p-value of 1, which was large enough to indicate no evidence of a lack of fit.
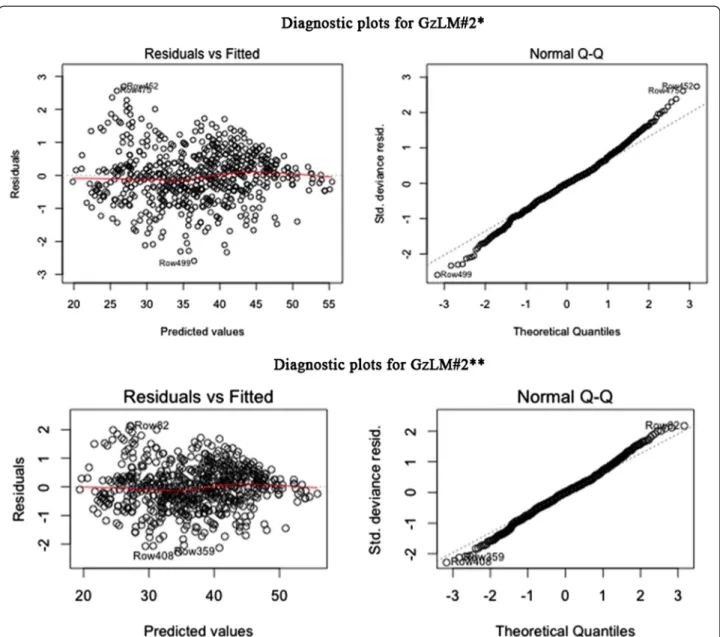
In the upper part of the Figure 2a, diagnostic plots for model GzLM#2* are depicted. In the plot on the left, Pearson residuals were plotted against predicted values. The red line almost coincides with the horizontal one proving that the constant variance assumption on the errors is verified and thus that the model shows a high level of fit.
The Normal Q-Q plot on the right of the upper part of Figure 2a shows that dots follow a linear trend even if several cases at the ends influence the normality. For this reason, the model, now called GzLM#2**, has been updated without influence cases. Seven cases in total have been removed from the final dataset and then ana-lyzed by specialists in order to search for possible abnor-malities. Such further investigation showed that those patients were not affected by any pathology and the only reason for excluding them is related to their high Cook’s distance, that is the measure of influence on the regres-sion coefficients.
The bottom part of the Figure 2b depicts diagnostic plots for the new GzLM#2** model. The Normal Q-Q plot still shows several cases diverge from linearity but their distances are acceptable, compared to the Normal Q-Q plot of GzLM#2*. The red line in the plot of resid-uals against the fitted values of GzLM#2** (on the left), presents a slight improvement in the linear trend com-pared to the plot of model GzLM#2*.
The LOO and ten-fold cross-validation accuracy for GzLM#2** are respectively 79.865% and 79.832%, with an improvement of about 3% of accuracy compared to the previous models.
For these reasons, we can certainly assess that in our dataset of 645 healthy controls, the best equation for predicting the ovarian age is: OvAge = 48.05-3.14*AHM + 0.07*FSH-0.77*AFC-0.11*FI + 0.25*VI + 0.1*AMH*AFC + 0.02*FSH*AFC.
GzLM#2** has been applied on POI and PCOS data-sets to test its power of discovering significant deviation from normality. The ovarian age of each POI subject resulted to be, as expected, significantly higher than the
Table 1 Descriptive statistics for healthy control subjects (652 subjects), POI affected subjects (29 subjects) and PCOS affected subjects (29 subjects)
Healthy controls (652 subjects) POI subjects (29 subjects) PCOS subjects (29 subjects) Age [years] 36.80 ± 8.62 37.90 ± 3.31 27.45 ± 4.30 Parity [number] 1.37 ± 0.97 0.44 ± 0.57 1.21 ± 0.67 AMH [ng/ml] 1.74 ± 1.75 0.01 ± 0.04 7.19 ± 2.13 FSH [mlU/ml] 12.47 ± 11.94 59.37 ± 23.52 6.45 ± 1.44 E2[pg/ml] 40.76 ± 18.56 26.24 ± 17.02 49.90 ± 15.53 AFC 10.97 ± 6.71 3.24 ± 2.23 28.90 ± 6.51 FI 32.16 ± 9.46 22.38 ± 6.94 38.14 ± 6.35 VI 1.91 ± 2.68 1.46 ± 2.97 1.81 ± 0.98 VFI 1.11 ± 1.70 0.63 ± 0.85 1.26 ± 0.70 Volume 5.66 ± 2.25 3.72 ± 1.76 7.72 ± 1.98
Figure 1 Plots of growth curve centile (3th, 10th, 25th, 50th, 75th, 90th, 97th) for each feature where Age is the covariate. The LMS method and penalized likelihood is used for fitting distributions.
chronological age. The mean of their OvAge is indeed 50.63 ± 3.80 years, against a mean of chronological age of 37.90 ± 3.31 years.
Regarding PCOS subjects, the mean OvAge (24.98 ± 0.91 years) of 24 PCOS subjects resulted to be signifi-cantly lower than the chronological age (29 ± 2.75 years).
Discussion
In this prospective study, we collected data of clinical, biochemical and 3D-ultrasonographic parameters in a population of healthy fertile women with the aim of developing a new methodology to quantify ovarian age (OvAge). To introduce this new variable, expression of ovarian reserve, we assumed that in healthy women with proven fertility ovarian age corresponds to chronological age.
In women enrolled as healthy fertile controls, our new model showed a high level of fit between chronological age and predicted OvAge. In POIs and PCOS patients, conversely, a significant difference between these two parameters was shown, indicating that the formula pro-duced is able to recognize pathological deviation from normal ovarian function.
Moreover, in all 18 women with a predicted ovarian age between 49 and 51 years at enrollment, regardless of their chronological age, menopause occurred within 1–2 years during the study period (data not shown).
Although preliminary, these results are very promising and drive us to further investigations and to a follow-up clinical validation of our model. The prospective evalu-ation of distance to menopause in our populevalu-ation, for example, is ongoing, and our statisticians are working to reach quickly the highest possible predictive ability, by means of accelerated failure time modeling. This ap-proach was recently used by Tehrani et al. [11], but their analysis was conducted by measuring AMH, collected on any days of the menstrual cycles, and they did not
use other markers of ovarian ageing [11]. The evaluation of our 18 cases in which OvAge was more reliable than chronological age in determining the time to meno-pause, however, is already a first clinical confirmation of its reliability.
With OvAge, we aim to answer the need of any mod-ern gynecologist to find the ideal marker of ovarian function. It should be universally accepted, reproducible, easy to interpret and applicable to the general popula-tion, and has to be able to give reliable information on number and quality of follicles, residual fertility, time to menopause and reproductive prognosis, both natural and post-Assisted Reproductive Techniques (ART).
Basal serum FSH, extensively studied over the past few decades, only provides a crude surrogate marker of bio-logical ovarian age when paired with the chronobio-logical age but it is probably the most indirect marker of ovarian reserve to date [12]. Moreover, FSH variability between follicular phases has been reported to be above 50% of the measured value, thus inevitably reducing the global predictive performance of this marker [13].
Recent studies have suggested that serum AMH levels represent ovarian quantitative reserve in IVF patients and may provide an index of age at menopause [11,14,15]. Thanks to its ability of providing valuable information regardless of what day in the cycle the sample is drawn and in women who do not menstruate, AMH has gained popularity among infertility specialists. In a recent retro-spective study on women undergoing their first IVF/ICSI cycle, however, concordance between AMH and FSH was noted in 57% of women while 43% of women had discord-ant values. According to these results, authors concluded that both AMH and FSH tests are probably useful to pre-dict ovarian response but since many women have dis-cordant values, it is difficult to counsel patients regarding their true ovarian reserve using one single marker [16].
In a recent meta-analysis, authors showed that even if AMH, independently of age, has some association with predicting live birth after assisted conception, its predict-ive accuracy is poor, concluding that no patient should be precluded from attempting ART solely on the basis of an AMH value [17]. Moreover, only very limited data on AMH and natural fertility at different stages of repro-ductive life are available today, since AMH levels have been extensively studied in infertile women but less in fertile ones.
With the recent acquisition of one of the two commer-cially available assays in commerce by Beckman-Coulter, the two existing kit were replaced by a new enzyme-linked immunosorbent assay. Recent safety notices, indi-cating the risk of falsely low and falsely elevated values due to technical mistakes, have fueled concerns about the robustness of the new assay [18]. This issue, once again, limits the actual possibility of considering AMH
Table 2 Comparison of Generalized Linear Models in term of AIC as the predictors change
Model Predictor AIC
GzLM#1 AMH + FSH + E2+ AFC + FI + VI + VFI + Volume 3987.3
GzLM#2 AMH + FSH + AFC + FI + VI 3981.9 GzLM#2* AMH + FSH + AFC + FI + VI + AMH*AFC + FSH*AFC 3955.2
GzLM#3 AMH 4175.5 GzLM#4 AMH + FSH 4052.1 GzLM#5 AMH + FSH + E2 4053.8 GzLM#6 AMH + FSH + AFC 4003.4 GzLM#7 FI + VI + VFI + Volume 4449.9 GzLM#8 AFC 4215.6 GzLM#9 AFC + Volume 4190 GzLM#10 Volume 4651.7
as the best single marker, sufficient by itself, for ovarian reserve assessment.
Studies on ultrasonographic parameters and ovarian reserve prediction reported similar conclusions. While AFC provides a direct estimation of recruitable follicles and gradually declines with chronological age, less data are today available on ovarian flow indexes [19].
According to the results of his meta-analysis, Gibreel in 2009 concluded that although Doppler studies of ovarian stromal blood flow are promising, more studies are warranted, also to determine the optimum parame-ters and the best cut-off values for these indices [20]. It is known, however, that three-dimensional Doppler tech-nique yields better axial resolution, fewer blooming
artifacts, and improved sensitivity to slow flows and small vessels compared with standard bi-dimensional power Doppler [21]. This advantage makes 3D angiog-raphy attractive since one speculative cause of age-related increase in oocyte chromosomal meiotic errors is a re-duced oxygen levels in the follicular fluid caused by a com-promised microcirculation around the leading follicle [22].
All these observations confirm the need of assessing ovarian age through dynamic multimodal tools able to improve the limited accuracy of the single parameter evaluated individually.
To the best of our knowledge, this is the first attempt to create a multimodal methodology able to answer with an easy-to-interpret response, the exact ovarian age or OvAge.
Figure 2 Diagnostic plots for (a) model GzLM#2* and (b) model GzLM#2**. On the left Pearson residuals plotted against predicted values and on the right the Normal Q-Q plot. The red line in the plot of residuals of GzLM#2** presents a slight improvement in the linear trend compared to the plot of model GzLM#2*.
The developed equation combines complementary eval-uations and gives as a result explicitly the ovarian age, a ready-to-use information, which will be useful for both women and physicians. In future, if it will be validated by our ongoing prospective evaluation, OvAge could provide reliable information to gynecologists for counseling pa-tients in their reproductive attempts and for reducing the rates of unnecessary surgery in the management of benign pathologies, such as dysfunctional abnormal uterine bleed-ing, adenomyosis or fibromatous uterus, which may best be treated with medical therapy, if natural menopause will be predicted to occur within few years.
OvAge could help researchers in quantifying the effect of surgeries, medications and ovarian pathologies them-selves on women’s ovarian in term of years of ageing, with the advantage of an intuitive, easily communicable and universal information available to both physicians and patients.
Conclusions
In conclusion, to the best of our knowledge, this is the first attempt to build a mathematical formula in which, once single patient’s biochemical and ultrasonographic values are introduced as input, the generated output is an easy-to-interpret number, which reliably expresses the ovarian reserve of that woman. This formula and its output, both called OvAge, put together different markers with differ-ent meanings to increase the reliability of the new ovarian reserve parameter.
Additional file
Additional file 1: Detailed statistical analysis.
Abbreviations
POI:Premature ovarian insufficiency; PCOS: Polycystic ovary syndrome; AMH: Anti Müllerian hormone; FSH: Follicle stimulating hormone; E2: Estradiol; AFC: 3D antral follicle count; VI: Vascular index; FI: Flow index; VFI: Vascular flow index; GzLM: Generalized Linear Models.
Competing interests
OvAge is patent pending (Application number CZ2013A000017). Authors’ contributions
RV and FZ conceived the study and wrote the major part of the manuscript. AS and MC conceived the OvAge GzLM statistical model, implemented the supporting OvAge software system prototype, analyzed the data and wrote the statistical model and the result part of the manuscript. GC gave support for the statistical model implementation.
DL and MPF acquired all clinical data. EZ, MM and EG provided a critical discussion of the data. All authors planned the study, discussed the design and interpretations of the findings, edited the manuscripts and agreed on the final version. All authors had full access to all of the data (including statistical reports and tables) in the study and can take responsibility for the integrity of the data and the accuracy of the data analyses. All authors read and approved the final manuscript.
Authors’ information
Roberta Venturella, Daniela Lico and Alessia Sarica are joint First Authors.
Author details
1
Unit of Obstetrics and Gynecology, Magna Graecia University of Catanzaro, Viale Europa - Localitá Germaneto, 88100 Catanzaro, Italy.2School of
Informatics and Biomedical Engineering-Bioinformatics Laboratory, Magna Graecia University of Catanzaro, Viale Europa - Localitá Germaneto, 88100 Catanzaro, Italy.3Chair of Clinical Pathology, Magna Graecia University of Catanzaro, Viale Europa - Localitá Germaneto, 88100 Catanzaro, Italy.
4
Department of Molecular and Developmental Medicine, University of Siena, Siena, Italy.5Department of Medical Biotechnologies, University of
Siena, Siena, Italy.
Received: 10 January 2015 Accepted: 19 March 2015
References
1. Ferrell RJ, O’Connor KA, Holman DJ, Brindle E, Miller RC, Rodriguez G, et al. Monitoring reproductive aging in a 5-year prospective study: aggregate and individual changes in luteinizing hormone and follicle-stimulating hormone with age. Menopause. 2007;14:29–37.
2. Navot D, Rosenwaks Z, Margalioth EJ. Prognostic assessment of female fecundity. Lancet. 1987;2:645–7.
3. American College of Obstetricians and Gynecologists. Ovarian reserve testing. Committee Opinion No. 618. Obstet Gynecol. 2015;125:268–73. 4. Sun W, Stegmann BJ, Henne M, Catherino WH, Segars JH. A new approach
to ovarian reserve testing. Fertil Steril. 2008;90:2196–202.
5. Beck-Peccoz P, Persani L. Premature ovarian failure. Orphanet J Rare Dis. 2006;6:1–9.
6. Rotterdam ESHRE/ASRM-Sponsored PCOS Consensus Workshop Group. Revised 2003 consensus on diagnostic criteria and long-term health risks related to polycystic ovary syndrome. Fertil Steril. 2004;81:19–25. 7. Mulders AG, Laven JS, Eijkemans MJ, de Jong FH, Themmen AP, Fauser BC.
Changes in anti-Müllerian hormone serum concentrations over time suggest delayed ovarian ageing in normogonadotrophic anovulatory infertility. Hum Reprod. 2004;19:2036–42.
8. Deb S, Campbell BK, Clewes JS, Raine-Fenning NJ. Quantitative analysis of antral follicle number and size: a comparison of two-dimensional and automated three-dimensional ultrasound techniques. Ultrasound Obstet Gynecol. 2010;35:354–60.
9. Cole TJ, Green PJ. Smoothing reference centile curves: the LMS method and penalized likelihood. Statist Med. 1992;11:1305–19.
10. Akaike H. A new look at the statistical model identification. IEEE Trans Automat Contr. 1974;19:716e723.
11. Tehrani FR, Solaymani-Dodaran M, Tohidi M, Gohari MR, Azizi F. Modeling age at menopause using serum concentration of anti-mullerian hormone. J Clin Endocrinol Metab. 2013;98:729–35.
12. Broekmans FJ, Kwee J, Hendriks DJ, Mol BW, Lambalk CB. A systematic review of tests predicting ovarian reserve and IVF outcome. Hum Reprod Update. 2006;12:685–718.
13. Bancsi LF, Broekmans FJ, Mol BW, Habbema JD, Te Velde ER. Performance of basal follicle-stimulating hormone in the prediction of poor ovarian response and failure to become pregnant after in vitro fertilization: a meta-analysis. Fertil Steril. 2003;79:1091–100.
14. van Rooij IA, Broekmans FJ, te Velde ER, Fauser BC, Bancsi LF, de Jong FH, et al. Serum anti-Müllerian hormone levels: a novel measure of ovarian reserve. Hum Reprod. 2002;17:3065–71.
15. Seifer DB, Baker VL, Leader B. Age-specific serum anti-Müllerian hormone values for 17,120 women presenting to fertility centers within the United States. Fertil Steril. 2011;95:747–50.
16. Hussain M, Cahill D, Akande V, Gordon U. Discrepancies between Antimullerian Hormone and Follicle Stimulating Hormone in Assisted Reproduction. Obstet Gynecol Int. 2013;2013:383278.
17. Iliodromiti S, Kelsey TW, Wu O, Anderson RA, Nelson SM. The predictive accuracy of anti-Mullerian hormone for live birth after assisted conception: a systematic review and meta-analysis of the literature. Hum Reprod Update. 2014;20:560–70.
18. Dewailly D, Andersen CY, Balen A, Broekmans F, Dilaver N, Fanchin R, et al. The physiology and clinical utility of anti-Mullerian hormone in women. Hum Reprod Update. 2014;20:370–85.
19. Hendriks DJ, Mol BW, Bancsi LF, Te Velde ER, Broekmans FJ. Antral follicle count in the prediction of poor ovarian response and pregnancy after
in vitro fertilization: a meta-analysis and comparison with basal follicle-stimulating hormone level. Fertil Steril. 2005;83:291–301.
20. Gibreel A, Maheshwari A, Bhattacharya S, Johnson NP. Ultrasound tests of ovarian reserve; a systematic review of accuracy in predicting fertility outcomes. Hum Fertil (Camb). 2009;12:95–106.
21. Kim SH, Lee JM, Kim YJ, Lee JY, Han JK, Choi BI. High-definition flow Doppler ultrasonographic technique to assess hepatic vasculature compared with color or power Doppler ultrasonography: preliminary experience. J Ultrasound Med. 2008;27:1491–501.
22. Van Blerkom J, Antczak M, Schrader R. The developmental potential of the human oocyte is related to the dissolved oxygen content of follicular fluid: association with vascular endothelial growth factor levels and perifollicular blood flow characteristics. Hum Reprod. 1997;12:1047–55.
Submit your next manuscript to BioMed Central and take full advantage of:
• Convenient online submission
• Thorough peer review
• No space constraints or color figure charges
• Immediate publication on acceptance
• Inclusion in PubMed, CAS, Scopus and Google Scholar
• Research which is freely available for redistribution
Submit your manuscript at www.biomedcentral.com/submit