CHAPTER V
Cyanines: BO and TO interaction with DNA
Even if cyanine dyes are known since 1856 (Williams, 1856), the interest on this class of fluorescent molecules has increased only recently (Mishra et al., 2000; Armitage, 2005). Actually, cyanines have found application in various areas of the most recent technologies, as for instance in laser materials (Lanzafame et al., 1996), in optical disks (Spitler et al., 1997), or in solar energy trapping (Saito and Yokoyama, 1994). However, the principal use of these dyes is in the field of biomedicine, where they are employed as antitumour agents (Kawakami et al., 1998; Skripchenko et al., 2006) and in biochemistry where they find application as agents for polynucleotide probing and staining (Rye et al., 1992; Hossain et al., 1995; Deligeorgiev, 1998; Norman et al., 2000). The last application is connected with the ability of cyanines to sharply increase their fluorescence upon interaction with polynucleotides (Goodwin et al., 1993; Guerrieri et al., 1997). Recently a cyanine dye, the SYTOX orange, has been employed to probe dsDNA for analytical purposes (Yan et al., 2005). Considerable efforts are made to synthesize new cyanine molecules that could be able to selectively recognize particular polynucleotides sequences (Jarikote et al., 2006). Cyanine dyes bind to DNA generally by intercalation (Larsson et al., 1995; Netzel et al., 1995; Karlsson et al., 2004; Jarikote et al., 2006; Karunakaran et al., 2006) but groove binding is also possible (Kapuscinski and Skoczylas, 1978; Jorgenson et al., 1988; Karlsson, Eriksson et al., 2003; Karlsson, Lincoln et al., 2003). A recent investigation on the intercalation mechanism into DNA of two cyanines containing the benzothiazolium residue (Biver, De Biasi et al., 2005) has shown that the binding process occurs according to a sequential three-step mechanism.
In order to get further light on the mechanism of binding of intercalators to nucleic acids, a kinetic and thermodynamic study has been undertaken on the interactions between DNA and two cyanines, BO and TO, which differ for the extension of the hydrophobic surfaces. The kinetic method, allowing the characteristic of individual reaction steps to be investigated, makes it possible to analyse the details of the intercalation process and to find out which step is mainly affected by changes of the dye structure.
5.1. Dye self-aggregation
It is known that cyanine dyes tend to self-aggregate (West and Pearce, 1965; Biver, De Biasi et al., 2005) and since this process can influence the course of dye binding to a given substrate, the features of self-aggregation processes of TO and BO in the absence of DNA were investigated.
5.1.1 Lambert & Beer’s law
Spectrophotometric experiments have been done to find the range of dye concentrations where the Lambert and Beer’s law is obeyed, in order to make a correct use of the experimental data.
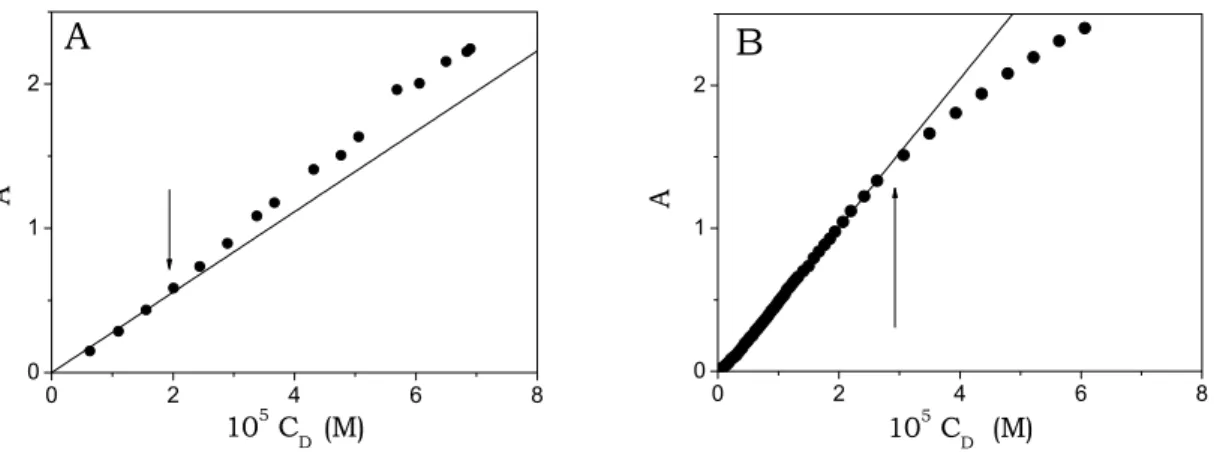
Deviations from the linearity of absorbance vs. concentration plots (Fig. 5.1A and B) were observed for concentrations higher than ca. 2×10⁻⁵M for TO and than
3×10⁻⁵ M for BO. 0 2 4 6 8 0 1 2 A 105 CD (M)
A
0 2 4 6 8 0 1 2 A 105 C D (M)B
Fig. 5.1. Absorbance as a function of dye concentration, CD. (A) TO λ = 471 nm; (B) BO,
λ = 446 nm pH = 7.0, T = 25°C.
Such deviations indicate aggregate formation. In order to avoid their presence in studies on DNA/cyanine interaction, the concentration of the dyes was always definitely lower than the above values.
5.1.2 Spectral analysis of aggregation
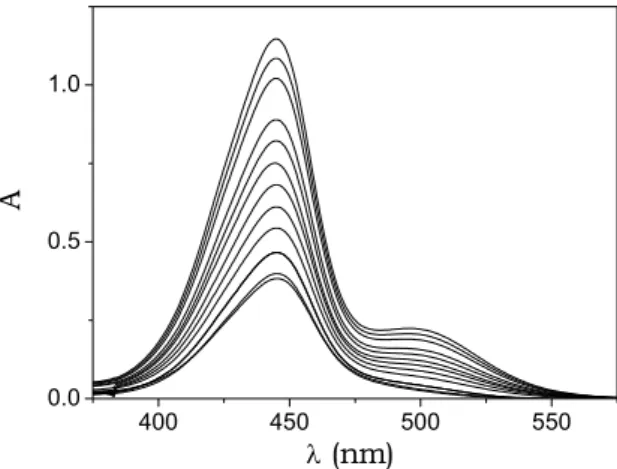
A spectral analysis of BO and TO aggregation was performed by recording absorbance spectra for different dye concentrations. The spectra exhibit
at high dye levels. At low dye levels, the spectrum of BO displays a single band, centred at 444 nm, whereas for high dye loadings a new band appears centred a higher wavelength (500 nm) (Fig. 5.2).
400 450 500 550 0.0 0.5 1.0 A λ (nm)
Fig. 5.2. Absorbance spectra of BO at different dye concentrations; I = 0.10 M (NaCl), pH = 7.0, T = 25°C, optical path = 0.2 cm, CD = 5.3×10⁻⁵M ÷ 2.4×10⁻⁴M (top). The spectral
behaviour reveals the occurrence of self-aggregation processes.
The two bands are well resolved; the band at 444 nm is assigned to monomer while the band at 500 nm is assigned to the aggregate. Assuming that the self-aggregation process could be represented by the all or none reaction (5.1)
KD
mD ' Dm (5.1)
where KD is the equilibrium constant, then both m and KD parameters could be
evaluated by means of eq. (5.2) (see Appendix I)
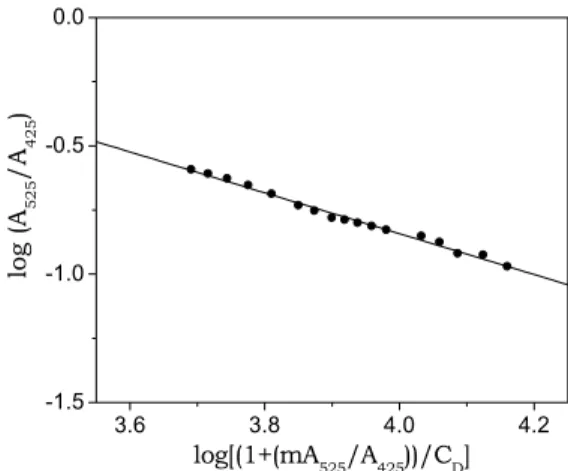
⎥ ⎥ ⎥ ⎥ ⎦ ⎤ ⎢ ⎢ ⎢ ⎢ ⎣ ⎡ + × × − + = D 425 525 D 425 525 C A A m 1 log m) (1 logK A A log (5.2)
where the reasonable assumption is done that A525 (absorbance at 525 nm) is due
to the aggregate only, whereas A425 is related exclusively to the monomer form. An
iterative procedure is needed: m is first fixed to an arbitrary value to calculate log((1+m×A525/A425)/CD) and a better m approximation is then obtained by the
to re-calculate the x-values and so on, until convergence is reached. Such a procedure yields KD = (2.2 ± 0.7)×102 M-1 and m = 1.9 ± 0.1 (independent of the m
initial value chosen). A plot according to eq. (5.2) is shown in Fig. 5.3.
3.6 3.8 4.0 4.2 -1.5 -1.0 -0.5 0.0 lo g (A 52 5 /A 42 5 ) log[(1+(mA525/A425))/CD]
Fig. 5.3. Plot of absorbance data according to equation (5.2).
The spectral behaviour of TO is different. At concentration levels where BO displays a single band only, the spectrum of TO already exhibits two bands, centred at 471 nm and 501 nm respectively. At the lowest TO concentrations, the band at 501 nm is prevailing (Fig. 5.4A), whereas, for higher dye contents, the band at the lower wavelength becomes the dominant one (Fig. 5.4B).
450 500 550 0 1 2 A λ (nm) A 450 500 550 0.0 0.4 0.8 A λ (nm) B
Fig. 5.4. Absorbance spectra of TO at different concentrations; I = 0.10 M (NaCl), pH = 7.0, T = 25°C. (A) TO (optical path = 1.0 cm) CD = 6.3×10⁻⁶M to 5.1×10⁻⁵M (top); (B) TO (optical
path = 0.1 cm) CD = 1.0×10⁻⁵M to 1.6×10⁻⁴M (top). The spectral behaviours reveal the
occurrence of self-aggregation processes.
Concerning this dye, the analysis of the spectra according to eq. (5.2) did not enable K and m to be reliably evaluated, perhaps owing to higher band
superimposition. However, the aggregation process of TO could be analysed kinetically by means of the T-jump technique in the absorbance mode.
5.1.3 Kinetic analysis of TO self-aggregation
In the T-jump analysis dye concentration was changed in the range 2.3×10⁻⁶ M ÷
1.2×10⁻⁵ M. Each kinetic experiment was repeated at least ten times, and the
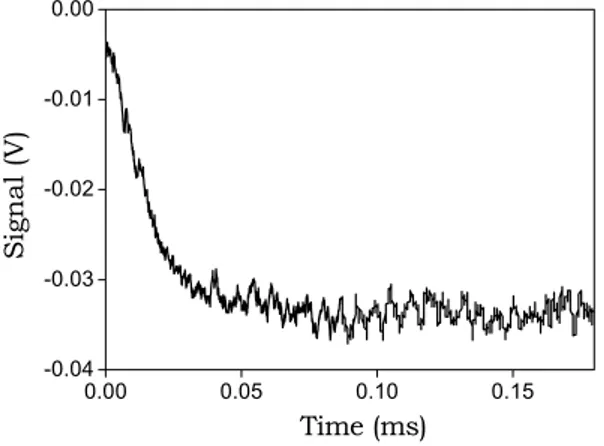
relaxation curves obtained were averaged via an accumulation procedure. An example of a kinetic mono-exponential curve is shown in Fig. 5.5.
0.00 0.05 0.10 0.15 -0.04 -0.03 -0.02 -0.01 0.00 Signal (V ) Time (ms)
Fig. 5.5. A mono-exponential T-jump relaxation curve, CD = 1.1×10⁻⁵ M, λ = 500 nm, rise
time = 5µs, heating time = 1.6µs, 1/τ = 6.6×10⁴ s-1.
From the mono-exponential fitting of the relaxation curves, the values of the relaxation time, 1/τ, could be obtained. The trend of the plot of 1/τ, vs. CD can be
reasonably fitted to a straight line (Fig. 5.6).
0.0 0.5 1.0 1.5 0 2 4 6 8 10 10 -4 1/ τ (s -1 ) 105 C D (M)
Taking into account the simple kinetic traces and the similarity of the two dyes, it seems reasonable to suppose that m = 2 also for TO, so that dye aggregation can be rationalized by a simple dimerization process (Scheme 5.3)
kd
2D ' D2 (5.3)
kf
where kf and kd are the rate constants for dimer formation and dimer dissociation
respectively.
According to the above reaction (5.3), the dye concentration dependence of the relaxation time is expressed by the relationship (Appendix I)
D f d
4k
C
k +
=
τ
1
(5.4)Experimental data, analysed according to eq. (5.4), yield the values for the dimerisation process given in Table 5.1, where also the data obtained for other dyes are reported for comparison.
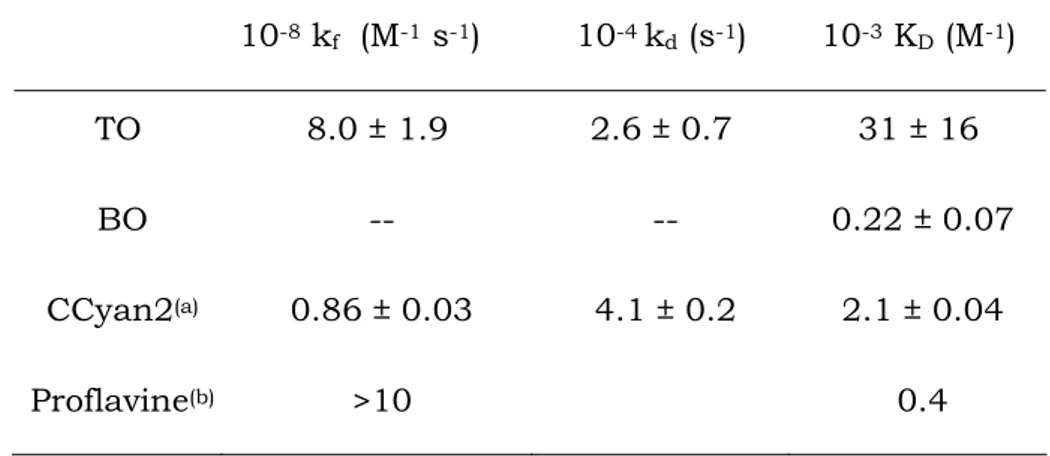
Table 5.1. Reaction parameters for TO and BO self-aggregation. I = 0.10 M (NaCl), pH = 7.0, T = 25°C. 10-8 kf (M-1 s-1) 10-4 kd (s-1) 10-3 KD (M-1) TO 8.0 ± 1.9 2.6 ± 0.7 31 ± 16 BO -- -- 0.22 ± 0.07 CCyan2(a) 0.86 ± 0.03 4.1 ± 0.2 2.1 ± 0.04 Proflavine(b) >10 0.4
(a) (Biver, De Biasi et al., 2005) (b) (Turner et al., 1972)
Similar kinetic analysis for BO self-aggregation was not feasible, as dye concentration high enough to ensure sufficient aggregate formation resulted in
too fast kinetics, whereas conditions of high dilution yielded too unfavourable signal to noise ratios.
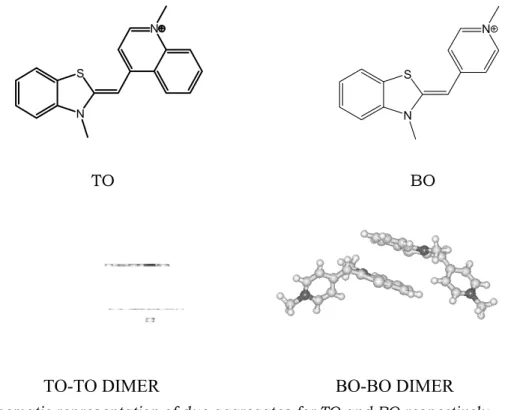
The differences between the aggregation tendencies found for the two dyes have to be related to their molecular structures. The presence of an additional aromatic ring that extend the dye planar surface of TO, should play a role in its higher extent of self-aggregation. Geometry optimization of dimer structures by means of the Hyperchem 7.0 software, based on AMBER force field and Polak-Ribière algorithm, indicated the possible aggregate forms depicted in Fig. 5.7 and confirmed that different dimeric forms are stable for TO and BO.
TO BO
Fig. 5.7. Schematic representation of dye aggregates for TO and BO respectively.
5.2
Equilibria
5.2.1 The DNA/BO system
The equilibria of BO interaction with DNA’s were studied by both spectrophotometric and spectrofluorometric experiments. The absorbance spectra, recorded during a titration where increasing amounts of DNA are added to the dye, are shown in Fig. 5.8 and show an isosbestic point at 455 nm.
N S N N S N
400 450 500 0.0 0.1 0.2 0.3 0.4 A λ (nm) a b
Fig. 5.8. Absorbance spectra of the DNA/BO system; I = 0.10 M (NaCl), pH = 7.0, T = 25°C. CD = 6.3×10⁻⁶ M, (a) CP = 0 M, (b) CP = 2.0×10⁻⁴M.
The presence of both hypochromic and bathochromic effects can be related to an intercalative mode of interaction.
One of the binding isotherms obtained from the absorbance measurements is reported in Fig. 5.9. 0.00 0.50 1.00 1.50 2.00 -2.0 -1.5 -1.0 -0.5 0.0 10 -4 ∆ A/ C D (M -1 ) 104C P (M)
Fig. 5.9. Binding isotherm from absorbance titration for the DNA/BO system. CBO = 6.3×10⁻⁶ M, I = 0.10 M, pH = 7.0, λ = 444 nm, T = 25°C.
Concerning fluorescence measurements first of all a 3D spectrum of the DNA/BO complex in solution was recorded to characterise the system fluorometric properties (Fig. 5.10). Based on such three-dimension spectrum the better
excitation and emission wavelength for titration were chosen (λexc = 460 nm and λem = 482 nm). λem (nm) λex c (nm)
Fig. 5.10. 3D spectrum of DNA/BO in solution. CBO = 1.3×10⁻⁶M, CDNA = 2.5×10⁻⁴M,
I = 0.10 M, pH = 7.0, T = 25°C.
The fluorescence mode enables low concentrations of the dyes to be used (10-6
÷10-7 M), so that aggregates contribution is negligible. The dye fluorescence
increases sharply upon addition of increasing amounts of DNA to the dye solution, as shown by the binding isotherm of Fig. 5.11.
0 1 2 0 1 2 3 10 -9 ∆ F/ CP (M -1 ) 104CP (M)
Fig. 5.11. Binding isotherm from one fluorescence titration of the DNA/BO system; CBO = 2.6×10⁻⁷M, I = 0.10 M, pH = 7.0, T = 25°C, λexc = 460 nm, λem = 482 nm.
The equilibrium between a dye molecule (D) and a free site on DNA (S) being expressed by the apparent reaction (5.5)
K
D + S ' DS (5.5)
information on this equilibrium can be obtained by data analysis according to the McGhee and von Hippel equation (McGhee and von Hippel, 1974)
[ ]
[
]
n1 n 1)r (n 1 nr) (1 K D r − − − − = (5.6)where r = [DS]/CP and the bound dye concentration [DS] can be directly obtained
from the experimental data as [DS] = ∆Φ/∆φ . The variable ∆Φ = Φ – Φ0 denotes
the change of the optical variable (absorbance or fluorescence) obtained from the signal (Φ) in the presence of DNA and in its absence (Φ0), whereas ∆φ = φDS - φD is
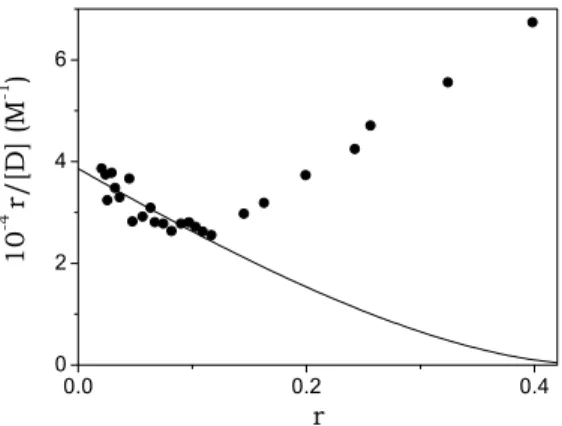
the change of the related optical parameter (∆φ = ∆ε or ∆ϕ). Equation (5.6) provides evaluations of both the equilibrium constant of reaction (5.5), K= [DS]/([D]×[S]), and of the site size, n, defined as the number of monomer units involved in the binding of one dye molecule to DNA under complete saturation conditions. Fig. 5.12 shows a Scatchard plot concerning the absorbance data of the DNA/BO system.
0.0 0.2 0.4 0 2 4 6 10 -4 r/[ D ] (M -1 ) r
Fig. 5.12. Analysis of a spectrophotometric titration according to the McGhee and von Hippel equation (eq. (5.6)) for the DNA/BO system. CD = 6.3×10⁻⁶M, CP = 0 ÷ 3.7×10⁻⁴M,
For the DNA/BO system, analysis according to eq. (5.6), performed in the range 0 < r < 0.12 yields K = (3.9 ± 0.2)×104 M-1 and n = (2.1 ± 0.2). Deviations from the
theoretical trend appearing at r > 0.12 could be ascribed to occupied sites rearrangement (McGhee and von Hippel, 1974) or external stack formation occurring for high degrees of polynucleotide saturation (Biver, Ciatto et al., 2006). The equilibrium constant of reaction (5.5), K, can be obtained (Biver, Secco et al., 2005) also by means of eq. (5.7)
[S]
1
K
∆
1
∆
1
∆Φ
C
D⋅
×
φ
+
φ
=
(5.7)
where the free site concentration is calculated as [S] = f(r)CP and
f(r) = (1-nr)n/[1-(n-1)r](n-1) (McGhee and von Hippel, 1974). As r depends on ∆φ an
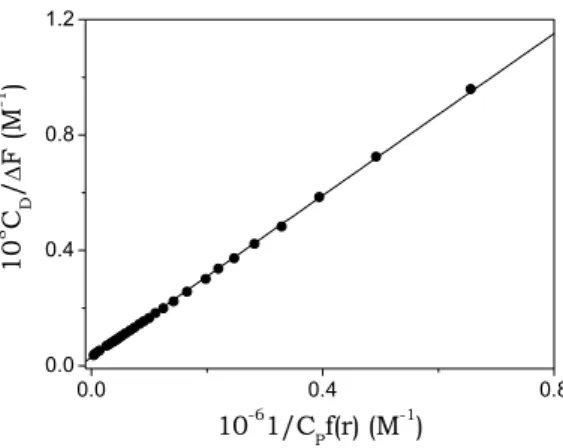
iterative fitting procedure is needed (Biver, Secco et al., 2005). A first estimate of ∆φ for [S] evaluation is taken from the amplitude of titration curves as that of Fig. 5.11; then, a new ∆φ value is obtained from the intercept of the straight line fitting the experimental data. This second ∆φ value is used to re-evaluate [S] and the procedure is repeated until convergence is reached. Usually three iterations only are needed. An example of analysis of the data is shown in Fig. 5.13.
0.0 0.4 0.8 0.0 0.4 0.8 1.2 10 8 C D / ∆ F (M -1 ) 10-61/CPf(r) (M-1)
Fig. 5.13. Analysis of a spectrofluorometric titration for the system DNA/BO based on eq. (5.7); CD = 2.6×10⁻⁷M, I = 0.10 M (NaCl), pH = 7.0, T = 25°C.
Details on the derivation of eq. (5.7) and on the analysis of the data are reported in Appendix II. The values of the equilibrium parameters obtained by the Scatchard analysis agree with the ones previously found.
5.2.2 The DNA/TO system
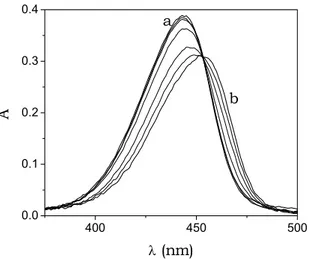
The equilibria involved in the DNA/TO system were investigated by means of both spectrophotometry and spectrofluorometry. Spectrophotometrically, the DNA/TO system displays a rather complex spectral behaviour (Fig. 5.14).
450 500 550 0.0 0.2 0.4 0.6 0.8 A λ (nm) a b c
Fig. 5.14. Absorbance spectra of the DNA/TO system, I = 0.10 M (NaCl), pH = 7.0, T = 25°C. CD = 1.0×10⁻⁵ M, (a) CP = 0 M, (b) CP = 1.2×10⁻⁵ M, (c) CP = 2.3×10⁻⁴ M.
At the beginning of the titration, the absorbance of the dye solution decreases as the polynucleotide is added (spectra a to b), but for further additions of polymer the absorbance starts to increase and a new band, centred at 510 nm, appears (spectra b to c). Binding isotherms are, therefore, biphasic and such a dual behaviour becomes much more evident by lowering the content of added NaCl (I = 0.01 M); on the contrary, when the ionic strength is increased until I = 0.50 M, the first branch of titration tends to disappear and monophasic isotherms are obtained (Fig. 5.15A, B, C).
0 1 2 3 -1 0 1 2 10 -4 ∆ A/ CTO (M -1 ) 104C P (M)
A
0.0 2.0x10⁻⁶ 4.0x10⁻⁶ 6.0x10⁻⁶ -1x10⁴ -8x10³ -4x10³ 00.0 0.5 1.0 1.5 2.0 0 1 2 3 10 -4 ∆ A/C TO (M -1 ) 104 C P (M) B 0 1 2 3 0.0 0.4 0.8 1.2 1.6 10 -4 ∆ A/C TO (M -1 ) 104C P (M) C
Fig. 5.15. Binding isotherms from absorbance titrations for the DNA/TO system; CTO = 1.3×10⁻⁵M, pH = 7.0, T = 25°C, λ = 510 nm. (A) I = 0.01 M (the insert is an expansion of
the descending portion of the plot); (B) I = 0.10 M; (C) I = 0.50 M. The ionic strength, I, is obtained with NaCl.
Concerning fluorescent measurements the better excitation and emission wavelength were found to be λexc = 505 nm and λem = 528 nm.
Here again, the fluorescence technique allows low concentrations of the dyes to be used (10-7 M), so that aggregate contribution is negligible. Under these
conditions, the system behaviour is monophasic and addition of DNA to the spectrofluorometric cell containing the dye produced a sharp increase of the fluorescence emission (Fig. 5.16). A typical monophasic titration curve is reported in Fig. 5.17. 520 540 560 580 0 100 200 300
a
F λ (nm)b
Fig. 5.16. Emission fluorescence spectra of the DNA/TO system; CTO = 2.60×10⁻⁷M,
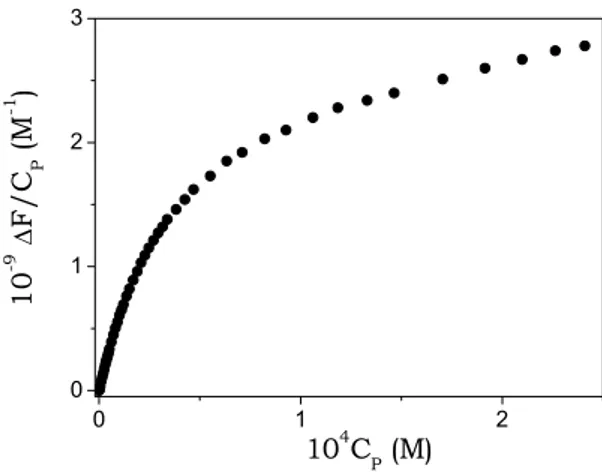
0 1 2 3 0.0 0.4 0.8 1.2 ∆ F/ CD (M -1 ) 105 C P (M)
Fig. 5.17. Binding isotherm from one fluorescence titration of the DNA/TO system; CD = 2.6×10⁻⁷M, I = 0.10 M (NaCl), pH = 7.0, T = 25°C, λex = 505 nm, λem = 528 nm.
The McGhee and von Hippel analysis of fluorescence data did not enable site size determination in the case of the DNA/TO system due to the large uncertainty of the intercept on the x-axis of the relevant Scatchard plot. However, it was found that n = 2 for BO and for other similar cyanine dyes (Biver, De Biasi et al., 2005), and fluorescence measurements by Lee and co-workers (Lee et al., 1986) showed that DNA saturation by TO was achieved with a ratio of one dye to two base pairs. Therefore, the treatment of thermodynamic data was done following the same procedure used for BO, assuming n = 2. The analysis of a spectrofluorometric titration, according to eq. (5.7) is shown in Fig. 5.18.
0.0 0.4 0.8 1.2 0.0 0.2 0.4 0.6 10 8 C D / ∆ F (M -1 ) 10-61/C Pf(r) (M -1)
Fig. 5.18. Analysis of a spectrofluorometric titration for the system DNA/TO based on eq. (5.7); CD = 2.6×10⁻⁷M, I = 0.10 M (NaCl), pH = 7.0, T = 25°C.
5.2.3 Salt concentration dependence of equilibria
Since the interaction takes place between charged partners, a dependence of the equilibrium parameters on the overall salt concentrations is likely to be observed (Peacocke and Skerret, 1956). The study of this dependence was done by carrying out spectrofluorometric titrations at different ionic strength values, ranging between 0.060 M and 0.50 M (NaCl). In effect, the equilibrium constants decrease for increasing salt concentrations (Figure 5.19), in agreement with the presence of electrostatic interactions between the positive charge of the dye and the negative charges of the phosphate groups on the polynucleotide backbone.
0.0 0.5 1.0 1.5 2.0 3 4 5 6 LogK -Log [Na+]
Fig. 5.19. Record plots for cyanine dye binding to DNA: LogK as a function of –log[Na+] for
the DNA/TO (triangles) and DNA/BO (open circles) systems. For comparison plots corresponding to other cyanine dyes are shown (Biver, De Biasi et al., 2005); DNA/CCyan2: squares, DNA/Cyan40: full circles. pH = 7.0, T = 25°C.
According to the Record theory (Record et al., 1978), the trend of LogK as a function of –Log[Na+] is a straight line, whose slope represents the number of
condensed sodium ions displaced by one dye molecule upon binding and whose intercept yields LogKnel being Knel equal to the equilibrium constant for the
binding in the absence of any electrostatic contribution. In Fig. 5.19 the salt effects displayed by BO and TO are compared with those obtained for the cyanine dyes Cyan40 and CCyan2 (Biver, De Biasi et al., 2005)
5.2.4 Temperature dependence of equilibria
Spectrofluorometric titrations were carried out at different temperatures for both the DNA/TO and DNA/BO systems. The K values decrease increasing the
of the temperature dependence of the equilibrium constants for both systems display good linearity (Fig. 5.20). Thermodynamic parameters of the two investigated systems are summarized in Table 5.2.
3.0 3.2 3.4 3.6 9 10 11 12 13 lnK 1031/T (K-1)
Fig. 5.20. Van’t Hoff’s plots for the DNA/TO (full circles) and DNA/BO (open circles) systems; I = 0.10 M (NaCl), pH = 7.0.
Table 5.2. Thermodynamic parameters for the interaction of CT-DNA with TO and BO. Parameters obtained for the cyanine Cyan40 (Biver, De Biasi et al., 2005) are also reported for comparison. pH = 7.0, I = 0.10 M (NaCl), T = 25°C.
Dye (a)∆G° (kcal mol-1) (b)∆H° (kcal mol-1) (c)∆S° (cal mol-1K-1) (d)∆G°nel (kcal mol-1) (e)∆G°el (kcal mol-1) (f)∆G°0 (kcal mol-1) TO -7.1 -5.1 +6.7 -5.8 -1.3 -5.7 BO -5.9 -3.4 +8.4 -4.5 -1.4 <-4.5 Cyan40 -6.0 -5.3 +2.3 -4.5 -1.5 -5.4 (a) ∆G° = -RTlnK, spectrofluorimetry; (b) from van’t Hoff’s plots (Fig. 5.20); (c) ∆S° = (∆Η° - ∆G°)/T;
(d) ∆G°nel = -RTlnKnel where Knel, the equilibrium constant in the absence of electrostatic
effects, is obtained from the intercept of Record plots (Fig. 5.19); (e) ∆G°el = ∆G° - ∆G°nel;
5.2.5 Interaction with synthetic polynucleotides
Fluorescence titrations using poly(dA-dT)⋅poly(dA-dT) and poly(dG-dC)⋅poly(dG-dC) instead of CT-DNA were also carried out in order to verify if BO and TO display some selectivity towards AT or GC base pairing. The equilibrium constants were measured under the same experimental conditions used for CT-DNA and the values of the equilibrium parameters obtained are collected in Table 5.3.
Table 5.3. Equilibrium constant for the binding of TO and BO cyanine dyes to different polynucleotides; I = 0.10 M (NaCl), pH = 7.0, T = 25°C. 10-5KTO (M-1) 10-4KBO (M-1) poly(dA-dT)·poly(dA-dT) 0.83 ± 0.2 2.8 ± 0.4 CT-DNA 1.7 ± 0.3 2.1 ± 0.3 poly(dC-dG)·poly(dC-dG) 3.8 ± 0.7 3.9 ± 0.6
5.3
Kinetics
The kinetic analysis of the DNA/cyanine systems was done using the T-jump and the stopped-flow techniques. Both the DNA/TO and DNA/BO systems display two relaxation effects well resolved on the time scale. For each system the fast effect (below the millisecond time range) was investigated by the T-jump technique with fluorescence detection, whereas the slow effect (above millisecond time scale) was investigated by the stopped-flow technique, also with fluorescence detection. All stopped flow experiments were carried out under pseudo-first order conditions (CP
≥ 10CD).
5.3.1 The DNA/BO system
Figure 5.21A shows a typical T-jump experiment which reveals the fast kinetic effect, while Fig. 5.21B shows a stopped-flow experiment revealing the slow effect. The relaxation curves obtained are monoexponential each. Their analysis provides the time constants of the fast effect, 1/τf, and slow effect, 1/τs, respectively.
0 1 2 3 4 -6 -4 -2 0 A Si gn al ( m V ) Time (ms) 0 50 100 150 0 1 2 3 4 Sig n al (m V ) Time (ms)
B
Fig. 5.21. Relaxation curves for the DNA/BO system monitored in the fluorescence mode. I = 0.10 M, pH = 7.0, λexc = 460 nm, T = 25°C; (A) fast effect (T-jump technique)
CD = 4.3×10⁻⁶M, CP = 1.3×10⁻⁵M, rise time = 5µs, heating time = 1.6µs; (B) slow effect
(stopped-flow technique) CD = 3.7×10⁻⁶M, CP = 4.3×10⁻⁵M, dead time = 2 ms.
These reaction parameters have been plotted against a function of reactant concentration defined as F(C) = CPf(r) – [D]f’(r) (Jovin and Striker, 1977; Macgregor
et al., 1985) (see Appendix VI).
Concerning this system, the plot of 1/τf as a function of F(C) is linear (Fig. 5.22A),
whereas the plot of 1/τs vs. F(C) tends to a plateau (Fig. 5.22B).
0.0 0.5 1.0 1.5 2.0 0.0 2.0 4.0 6.0 8.0 104 F(C)(M) 10 -3 1/ τf (s -1 ) A 0.0 0.5 1.0 0.0 0.5 1.0 1.5 104 F(C) (M) 10 -2 1/ τs (s -1 ) B
Fig. 5.22. Dependence of the reciprocal relaxation times on the concentration variable F(C) for the DNA/BO system. I = 0.10 M (NaCl), pH = 7.0, T = 25°C; (A) fast effect, (B) slow effect. Fits to eq. (5.8) (fast effect) and eq. (5.9) (slow effect) are also shown.
Experimental data points can be fitted to equations 5.8 and 5.9 respectively
1 0 1 0 k F(C) K 1 F(C) k K − + + = f τ 1 (5.8)
2 f 2 f k F(C) K 1 F(C) k K 1 − + + = s τ (5.9) where Kf = K0(1+k1/k-1).
These equations are derived on the basis of a three-step series reaction mechanism shown in Scheme 5.10 which was found to be operative also in previous studies on similar cyanine systems (Biver, De Biasi et al., 2005). (see Appendix VI)
K0 k -1 k -2
D + S ' D,S ' DSI ' DSII (5.10)
k1 k 2
The species D,S, DSI and DSII are conformationally different polynucleotide/dye
complexes. All parameters obtained by data fitting are collected in Table 5.4. The plot of Fig. 5.22A, of the fast relaxation effect being linear, it turns out that in eq. (5.8) the quantity K0F(C) is too small to produce a curvature in the plot. This
finding could in principle indicate the presence of a two-step series mechanism only. However, it is likely to assume that also for this system, the step corresponding to K0 exists on the basis of previous findings on similar cyanine
systems (Biver, De Biasi et al., 2005) and on TO/DNA system (see below). Therefore K0F(C) term, which represents the contribution of the first step of
Scheme 5.10 is likely to exist even if its contribution of the overall kinetics is small. Nevertheless, being K0F(C)<<1, eq. (5.8) reduces to the straight line 1/τf =
K0k1F(C)+k-1 shown in Fig. 5.22A and only the K0k1 product can be evaluated
from the slope of the plot (K0k1 = (2.05 ± 0.15)×107 M-1s-1). On the other hand, it
can be argued that for this system K0 should not exceed the value of 2000 M-1, as
otherwise significant curvature in the plot of Fig. 5.22A would be observed. On this basis, lower limits for k1 and K1 = k1/k-1 were estimated and reported in Table
5.4.
Concerning the slow effect, investigated by means of the stopped-flow technique, the 1/τs vs. F(C) plot tends to level off for the highest values of F(C), revealing a
remarkable influence of the preceding fast effects. The concentration dependence of the slow relaxation time was fitted to eq. (5.9). The relative reaction parameter values are also collected in Table 5.4.
5.3.2 The DNA/TO system
The kinetics of the DNA/TO system have been investigated following the same procedure used for the DNA/BO system. We could detect, as previously for BO, two relaxation times differing by about one order of magnitude (Fig. 5.23A and B).
0 2 4 6 8 0 4 8 12 Sig n al ( m V) Time (ms)
A
0 10 20 30 40 0 4 8 12 16 Signa l (mV) Time (ms)B
Fig. 5.23. Relaxation curves for the DNA/TO system monitored in the fluorescence mode. I = 0.10 M, pH = 7.0, λexc = 505 nm, T = 25°C; (A) fast effect (T-jump technique)
CD = 5.1×10⁻⁶M, CP = 7.4×10⁻⁵M, rise time = 5µs, heating time = 1.6µs; (B) slow effect
(stopped-flow technique) CD = 6.4×10⁻⁶M, CP = 1.7×10⁻⁴M, rise time = 2ms.
Fig. 5.24 shows the concentration dependence of the two relaxation effects. The curvature displayed by the plot of the fast effect (Fig. 5.24A) provides evidence for the pre-equilibration step denoted by K0 in Scheme 5.10. This step, although too
fast to be directly observed as a separate relaxation effect, can be nevertheless characterized in terms of its equilibrium constant, K0.
0.0 0.5 1.0 0.0 0.5 1.0 1.5 104 F(C) (M) 10 -3 1/ τf (s -1 ) A 0.0 0.5 1.0 1.5 0.0 0.5 1.0 1.5 2.0 104 F(C) (M) 10 -2 1/ τs (s -1 ) B
Fig. 5.24. Dependence of the reciprocal relaxation times on the concentration variable F(C) for the DNA/TO system. I = 0.10 M (NaCl), pH = 7.0, T = 25°C; (A) fast effect, (B) slow effect. Fits to eq. (5.8) (fast effect) and eq. (5.9) (slow effect) are also shown.
The kinetic and thermodynamic parameters obtained by non linear fits of experimental data on eqs. (5.8) and (5.9) are collected in Table 5.4.
5.3.3 Amplitude Analysis
The analysis of the amplitudes of the T-jump relaxation curves allows the equilibrium constant of a reaction to be obtained. The analysis was carried out for both systems. It can be demonstrated that, under the conditions of the present experiments, eq. (5.11) applies (Secco et al., 1994; Biver, Secco et al, 2005) (see Appendix VII)
f(r)
C
B
K
B
1
δA
C
f(r)
C
P f 2 1 D P=
+
⎥⎦
⎤
⎢⎣
⎡
°
×
(5.11)where δA° is the amplitude of a given relaxation effect and B = │l∆ϕf
Kf∆HfδT/RT2│; δA° = δI/I° (with δI emitted fluorescence intensity change i.e. signal
change and I° total fluorescence intensity), l is the optical path, ∆H the enthalpy variation and δT the temperature jump applied (δT = 2.5°C). Equation (5.11) applying for T-jump kinetic traces, the analysis has been restricted to the fast relaxation effect. The amplitude analysis, according eq. (5.11) is shown in Fig. 5.25 for both DNA/TO and DNA/BO systems and the Kf values, obtained as
the ratio slope/intercept of the relevant calculated straight line, are also reported in Table 5.4 where the agreement with previously calculated values is shown.
0.0 0.5 1.0 1.5 2.0 2.5 0 1 2 3 4 10 4 (C P f(r)C D / δ A°) 1/ 2 (M) 104CPf(r) (M)
Fig. 5.25. Amplitude analysis (eq. (5.11)) of the T-jump relaxation curves (fast kinetic effect) for the two investigated systems. I = 0.10 M (NaCl), pH = 7.0, T = 25 C; DNA/TO triangles,
Table 5.4. Reaction parameters for the interaction of CT-DNA with TO and BO. Parameters obtained for the cyanine Cyan40 (Biver, De Biasi et al., 2005) are also reported for comparison. pH = 7.0, I = 0.10 M (NaCl), T = 25°C.
Dye
K (10-4M-1) K0 (10-3M-1) Kf (10-4M-1) K1 K2 k1 (103s-1) k-1 (103s-1) k2 (s-1) k-2 (s-1) TO 20±9a 17±3b 15±2 21±8c 7.0 ± 1.3d 9.6 ± 2.2e 3.6±0.7f 2.4±0.4 f 1.6±0.1 0.45±0.05 150±10 61±7 BO 4.0±0.9a 2.1±0.3b <2 <4c 0.94±0.13 g 2.2 ± 0.4e >4.5 f 3.2±0.3 f >10 2.2±0.1 150±10 48±2 Cyan40 3.2±1.2a 2.4±0.1b 9.8±1.8 2.5 ± 0.9 1.5±0.3f 1.2±0.3 f 5.9±1.2 3.9±0.5 92±9 80±7 a) Kinetics: K = K0[1+K1(1+K2)];b) Thermodynamics: spectrofluorometry (eq. (5.7)); c) K0 = Kf/(1+K1); amplitude analysis;
d) Kf = K0(1+K1); time constants analysis;
e) Kf = K0(1+K1); amplitude analysis;
f) Rate constants (K1 = k1/k-1; K2 = k2/k-2);
g) Kf = K0k1/k-1.
5.4
Discussion
Self-aggregation
Self-aggregation of both TO and BO dyes has been found to occur, but with different features and strength from one dye to another. TO shows remarkable aggregation tendency, the equilibrium constant for dimer formation being two orders of magnitude higher than that of BO and of the planar intercalating dye proflavine (Table 5.1). The presence of an additional aromatic ring, extending the dye planar surface with respect to BO, should play a role in the higher extent of self-aggregation of TO; further, molecular geometry plays also a principal role, as demonstrated by the fact KD value for TO is one magnitude order higher than that
of CCyan2, a molecule which also presents extended conjugation (Fig. 5.26C). The higher equilibrium constant value is a consequence of the higher kinetic constant for dimer formation that, in case of TO, is close to the diffusion limit. In BO the absence of the two methyl residues respect to Cyan40 (Fig. 5.26D), a molecule with very low tendency to self-aggregate, enables some aggregation to occur.
Fig. 5.26. Molecular formula of the cyanine dyes (A) TO; (B) BO; (C) CCyan2 ≡
benzothiazolium 3-methyl-2-[2-methyl-3-(3-methyl-2(3H)-benzothiazolydene)-1-propenyl ion and (D) Cyan40 ≡ 3methyl-2-(1,2,6-trimethyl-1Hpiridin-4-ylidenmethyl) benzothiazolium ion.
Interestingly, BO is the only dye whose dimer spectrophotometric band shows a bathochromic shift respect to the monomer band. It is known that bathochromic shifts of the monomer band are related to J-aggregation (great offset of the aggregated molecules), whether hypsochromic shifts are suggestive of H-aggregation (high superimposition of the aggregated molecules) (Miaomiao et al., 2000). This finding is also confirmed by our calculations on geometry optimization of dimer structures based on molecular mechanics. These calculations indicate that in the case of TO a highly superimposed sandwich-like dimeric form is the most stable one, where the benzothioazole interacts with the pyridinyl ring of the other monomer. In the case of BO stable aggregate species are also dimers where the two benzothiazole residues interact each other and the remaining two residues are projected outside adopting predominantly a cis-configuration (Fig. 5.7). Actually, the energy difference between cis and trans J-aggregated forms of BO, being around 2 kcal/mol, indicates that 3% only of the dimers will assume the trans configuration.
It can be calculated, on the basis of the KD value of TO, that for CD = 1×10⁻⁵M
(absorbance measurements) the dimer fraction is 15%, whereas for CD = 3×10⁻⁷ M
(fluorescence measurements) the dimer fraction is negligible (0.9%). Therefore we can ensure that fluorescence data obtained for the DNA/TO system are related to the dye monomer/polynucleotide interaction only.
Interaction with DNA
Both cyanine dyes have shown to interact with DNA, forming stable complexes with overall binding constant, K, of the order of magnitude of 104 M for BO and
105 M for TO.
Dye-dye stacking, possibly DNA templated, is most likely the cause of the biphasic behaviour displayed by DNA/TO absorbance titrations (Fig. 5.15) and, among the two phases, aggregation should concern the first one, where the condition CD>>CP does apply. The experimental results show that the higher the
added salt concentration, the weaker the observed effect (Fig. 5.15). Therefore, the first branch of titration seems to include an interaction between the positively charged dye molecules and the negative polynucleotide backbone. The consequent reduction of repulsion between the dye molecules will favour external dye stacking around the polymer backbone. DNA-templated dye aggregates have indeed be found to form for DNA/TO (Ogul'chansky, Losytskyy et al., 2001) and also for DNA/cationic cyanine systems (Seifert et al., 1999; Miaomiao et al., 2000). In the second phase of titration (CP>>CD), when increasing amounts of
polynucleotide are added and the dye molecules are spread on a higher number of base pairs, monomer intercalation occurs. It was indeed suggested that TO intercalates into DNA as a monomer only (Nygren et al., 1998). All experiments different from DNA/TO absorbance titrations concern experimental conditions where dye aggregation is negligible.
The absorbance spectra for DNA/TO and DNA/BO systems both show bathochromic effects (Fig. 5.8 and 5.14), in agreement with an intercalative mode of interaction (Pasternack and Gibbs, 1996) which is also supported by the analysis of BO binding isotherms that yields a site size value of 2.
The dependence of the overall binding constant, K, on salt concentration (Fig. 5.19) agrees with the Record theory (Record et al., 1976) and allows the electrostatic contribution to the binding process to be evaluated. The values of the slopes of the plots of Fig. 5.19 are similar to each other and close to one, in agreement with the mono-positive charge borne by the dyes. Nevertheless, same plots point also out that, even if TO and BO have similar structures (Fig. 5.26), their behaviour shows remarkable differences also concerning their affinity towards DNA.
Actually, the overall binding constant for BO is almost the same as that of the similar dye Cyan40 and of magnitude order of 104 M-1 at I = 0.10 M, in agreement
the contrary, the binding constant of DNA/TO is 7-fold times higher compared with DNA/BO, the cause of this difference being ascribed largely to the enthalpy effect (∆H° = -5.1 kcal mol-1 for TO and -3.4 kcal mol-1 for BO). Experiments with
synthetic polynucleotides reveal no particular ability to discriminate between AT and GC sequences either for TO or BO. Nevertheless, the higher dependence of the overall equilibrium constant value on the base sequence observed for TO respect to BO is in line with TO wider aromatic system extension. The lower value of K found for poly(dA-dT)·poly(dA-dT)/TO could be put down to a reduction of the intercalate stability due to the higher flexibility (Sarai et al., 1989) of this polynucleotide.
Concerning the kinetic behaviour, the two relaxation effects found for both DNA/TO and DNA/BO systems agree with the three-step series process shown in Scheme 5.10. It should be noted that the barrier to intercalation revealed by the biphasic kinetic behaviour exhibited by BO, TO, Cyan40 and CCyan2 (Biver, De Biasi et al., 2005) has not been observed for binding of the cyanine dye SYTOX orange to bacteriophage λ DNA (Yan et al., 2005). In this case the simple one-step mechanism and the high value of the association rate constant (3.4×10⁸ M-1s-1)
reveal the occurrence of a diffusion controlled binding process, which suggests immediate accessibility of the dye to polymer binding sites, a feature that has been observed for groove binding processes (Brensegem, 2001). The direct transfer mechanism proposed for the DNA/ethidium (Bresloff and Crothers, 1975) was discarded as this requires that the plot of (1/τf × 1/τs) vs. F(C) would display
a parabolic trend, contrary to our findings. The alternative mechanism depicted in Scheme 5.11, where DSI and DSII are mutually exclusive, could in principle be
operative.
(5.11)
Equation (5.8), which in the series mechanism is associated to the fast effect, also applies to this branched mechanism. On the other hand, concerning the slow effect associated to eq. (5.9), Kf in the numerator must now be replaced by K0, but
the form of the equation remains unchanged. Therefore, the branched mechanism
D + S D,S
DS
IDS
IIK
0k
1k
-1k
2k
-2could not be kinetically distinguished from our series mechanism. However, we are in favour of the latter after having considered the following possibilities:
(i) DSI is intercalated in A-T and DSII is intercalated in G-C. Then, in the poly(dG-dC)⋅poly(dG-dC)/cyanine system, only one relaxation effect should be observed. Experiments show that is not the case, since two effects are clearly observed in the poly(dG-dC)⋅poly(dG-dC)/Cyan40 system.
(ii) Intercalation in DSI involves one of the two functionalities of the cyanine and intercalation in DSII involves the other functionality. In this case, CCyan2 (Fig. 5.26C) with two identical functionalities, should display only one effect, contrary to experiments.
(iii) DSI intercalates crossing one groove and DSII intercalates crossing the other groove. Suppose that the two processes require different activation energies, so two effects are observed. This could be possible for large molecules but less probable for small dyes as our cyanines. Further, two effects are observed also for intercalation of proflavine into poly(A)⋅poly(A) where only one groove is present (Ciatto et al., 1999).
Therefore, the most probable is that DSI and DSII differ by the extent of
intercalation. Since the intercalation process involves a structural change of the polynucleotide, one has to postulate some intermediate complex between the free dye and the fully intercalated state, in order to allow time for the structural reorganization to occur (Li and Crothers, 1969). This is the series mechanism. In the proposed reaction mechanism, first of all an external pre-intercalated complex D,S is formed with very fast kinetics, then D,S turns into DSI and DSII
forms, which represent two intercalated complexes differing by the extent of intercalation. The agreement between the overall equilibrium constants directly found by thermodynamic experiments and as a combination of the kinetic constants for the individual steps further confirms the correctness of the model (Table 5.4). This agreement is particularly important on account of the different methodologies that were employed to evaluate the equilibria. Moreover, agreement in the Kf values is reached by using the independent analysis of either the
relaxation times or amplitudes of the T-jump traces.
Table 5.4 shows that the K0 value of BO is definitely lower than that of TO and
Cyan40, while the equilibrium constants K1 and K2 of the subsequent steps are
rather similar for the investigated dyes. It should then be concluded that the differences found in the binding process are confined to the first step of reaction
forces both concur in the formation of the D,S complex (Haq et al., 1995; Biver, De Biasi et al., 2005). Early studies on DNA/proflavine and DNA/ethidium supported the idea that the electrostatic contribution to outside binding, although not unique, was nevertheless important. The value of K0 calculated on the basis
of the electrostatic theory, applied to polyelectrolytes, should be the same for ligands bearing the same charge and of the order of 102 M-1 (Meyer-Almes and
Pörschke, 1993) at 25°C and I = 0.11M or less (Diebler et al., 1987). All values listed in Table 5.4 are well above this value; this finding indicates that the non-electrostatic contribution to the stability of D,S is large (compare ∆G° with ∆G°el in
Table 5.2), its importance increasing in the order BO≈Cyan40<TO. If one considers the three dyes differ for the structure of the pyridine containing residues (Fig. 5.26) whose hydrophobic character follows the sequence of the K0
values, one can conclude that hydrophobic forces ability to establish effective interactions and the capability of the residue to match with the DNA structure concur in stabilizing D,S (Shaikh et al., 2004; Shi and Macgregor, 2007). This is the case mainly concerning TO and, to a lesser extent, concerning Cyan40 and BO. Hence, the species D,S should largely possess features of a groove-bound complex, although incipient intercalation could not be excluded. This conclusion is also supported by the experimental finding that the step associated to K0 is
much faster than the subsequent step, whose rate constants (k1, k-1) are typical
for the intercalative mode of binding.
Concerning the second step of the reaction scheme 5.10, Table 5.4 shows no large differences in the K1 values. However, in the case of TO the rate of the D,S ' DSI
inter-conversion is lower in both directions, compared to BO and Cyan40. Assuming intercalation has proceeded to a given extent in DSI, then the forward
step D,S p DSI is slower since a larger activation barrier should be overcome, due
to the higher stability of the D,S complex of TO. The value of k-1 is also lower in
comparison with the other dyes. This finding could be explained assuming that in DSI the benzothiazole residue, which is common to the investigated dyes, is in
part intercalated while the pyridine residue undergoes groove interactions. In the case of TO, owing to the wider surface of the pyridine residue, the DSI complex
results to be the most stable.
Concerning the last step, one observes that the values of k2 are similar for the
three ligands, as the values of k-2. This means that the inter-conversion DSI '
accommodation into the polymer cavities of the common benzothiazole intercalating residue; b) in DSI half dye molecule only is intercalated, whereas in
DSII the entire dye molecule is allocated within base pairs. Hypothesis (a) seems to
be the most probable because otherwise the reaction parameters for the last step would exhibit significant differences; moreover, concerning Cyan40, model (a) was favoured on the basis of completely different measurements (Yarmoluk et al., 2001).