Alma Mater Studiorum – Università di Bologna
DOTTORATO DI RICERCA IN
SCIENZE VETERINARIE
Ciclo XXVI
Settore Concorsuale di afferenza: 07/H2 Settore Scientifico disciplinare: VET/03
TITOLO TESI
Cellular Proliferation in the Prognosis of Intermediate
Grade Mast Cell Tumour in Dogs
Presentata da: Dr Davide Berlato
Coordinatore Dottorato
Relatore
Prof. Carlo Tamanini
Prof. Giuliano Bettini
SUMMARY 1 LIST OF FIGURES 5 LIST OF TABLES 6 1.0 INTRODUCTION 7 1.1 AETIOLOGY 7 1.2 SIGNALMENT 8 1.3 CLINICAL PRESENTATION 8 1.4 DIAGNOSIS 9 1.5 STAGING 14 1.6 PROGNOSTIC FACTORS 16 1.7 TREATMENT 22
2.0 PREVIOUS WORK ON MAST CELL TUMOURS PERFORMED 24 AT THE ANIMAL HEALTH TRUST
3.0 AIMS AND OBJECTIVES 27
3.1 AIMS 27
3.2 OBJECTIVES 27
4.0 MATERIALS AND METHODS 28
4.1 DATA ACCUMULATION 28 4.2 FOLLOW UP 29 4.3 CENSORING OF DATA 29 4.3.1 TIME RESTRICTIONS 29 4.3.2 TREATMENT 30 4.4 SURVIVAL DATA 30
4.5 MITOTIC INDEX, IMMUNOHISTOCHEMISTRY FOR KI-67 30 AND MCM7
4.5.1 MITOTIC INDEX 31
4.5.2 IMMUNOHISTOCHEMISTRY 31
4.5.3 IMAGE CAPTURE AND CELL COUNTING 32
4.6 STATISTICAL ANALYSIS 33
5.0 RESULTS 34
5.1 STUDY POPULATION 34
5.2 IMMUNOHISTOCHEMISTRY 36
5.3 ROC CURVE FOR MI, KI67 AND MCM7 40
5.4 ASSOCIATION BETWEEN PROGNOSTIC VARIABLES 42
AND SURVIVAL
5.5 SURVIVAL ANALYSES 42
6.0 DISCUSSION 45
6.1 DESCRIPTIVE RESULTS 45
6.2 CAN WE IMPROVE THE PERFORMANCE OF THESE 47
PROGNOSTIC MARKERS?
6.3 WEAKNESS OF THE STUDY 52
6.3.1 DATA ACCUMULATION 52
6.3.2 CASE SELECTION AND FOLLOW UP 52
6.3.3 SURVIVAL 52
6.3.4 MITOTIC INDEX, IMMUNOHISTOCHEMISTRY, 54
IMAGE CAPTURE, AND CELL COUNTING.
7.0 CONCLUSION 56
1
SUMMARY
Introduction.The Patnaik histological grade is the most commonly used prognostic indicator for canine cutaneous mast cell tumours (MCTs). The majority of dogs with high histological grade MCTs die from their disease after local therapy alone within a year of diagnosis, whereas most dogs with low grade MCTs are cured with appropriate local treatment. The behaviour of intermediate MCTs is more difficult to predict because they behave as low grade tumours in approximately 75% of cases and as high grade tumours in the remaining 25%.
The differentiation of intermediate grade MCTs with aggressive behaviour from the more benign forms represents a great diagnostic challenge. In the last few years a 2-tier histological grading system and the use of markers of cell proliferation such as mitotic index, Ki67 index and Minichromosome Maintenance Protein 7 (MCM7) score have been investigated to overcome this limitation. In one study, a new 2-tier histological grading system was proven to be a better predictor of survival than the Patnaik grading scheme. This new system is currently awaiting validation in other studies. Mitotic index and Ki67 index have been significantly associated with survival independently from the tumour grade in multiple studies. Many diagnostic commercial laboratories routinely offer these prognostic markers to differentiate aggressive from non-aggressive intermediate grade MCTs.
The author investigated a novel proliferation marker called MCM7 as a prognostic marker in canine MCTs. MCM7 was found to be completely independent from the histological grade and significantly associated with survival.
Objective. The primary objective of the present study is to validate the MCM7 as a prognostic marker in a different cohort of dogs with intermediate grade MCTs.
2 The secondary objective is to compare the ability of the 2-tier histological grading system, mitotic index, Ki67 index and MCM7 score to predict survival of canine MCTs.
Materials and methods.
This is a retrospective study including samples of dogs with a histological diagnosis of intermediate grade cutaneous MCTs and known outcome. Samples were collected from the archive of the Diagnostic Laboratory of the Animal Health Trust. Follow up was obtained from the laboratory database or the submitting veterinary practice. For each sample the 2-tier histological grade, mitotic index, Ki67 index and MCM7 score was determined. Results were then analysed with statistical methods to compare the ability of each prognostic marker to predict outcome.
Results.
Population
A total of 90 dogs with intermediate grade MCT were included in this study. The median age of this cohort of dogs was 7.7 years (range 2 months - 15 years). There were 42 females and 48 males. Nineteen different breeds were represented with Labrador retriever, Golden retriever, and Boxer being approximately 60% of the entire study population. There were 39 MCTs located in the trunk, 36 in the extremities, 11 tumours in the head, and 4 in an unknown cutaneous site. The margin of excision was available in all cases: it was complete in 31 dogs, with narrow margin in 20 cases (less than 1mm), and infiltrated in the other 39 patients.
ROC curve
A ROC curve was obtained to evaluate the performance in predicting death due to causes associated with the MCT for each prognostic marker. The area under the curve (AUC) of the MI was 0.78 (95% CI 0.64-0.91), the AUC of Ki67 was 0.89 (95% CI 0.80-0.98) and the
3 AUC of MCM7 was 0.87 (95% CI 0.76-0.98). The ROC curve also confirmed that the threshold value chosen for each parameter in previous studies was still appropriate.
Association between prognostic variables and survival
Cases with high Kiupel grade overlapped precisely with cases with high mitotic index and therefore these two variables were considered the same for the rest of the study. In this section only analysis for MI will be reported.
There were 82 dogs with MI ≤ 5 and 8 dogs with MI > 5; 57 dogs with Ki67 ≤ 0.018 and 23 with Ki67 > 0.018; 65 dogs with MCM7 ≤ 0.18 and 25 dogs with MCM7 > 0.18. A significant association was present between categories of MI, Ki67 and MCM7 and death related to the mast cell disease (Fisher’s exact test; P <0.001).
Survival analysis
The median survival for the entire population was not reached at 2099 days. The mean survival time was 1708 days [95% C.I. 1546-1870]. Seventy-two cases were censored after a median follow up of 1136 days [range 491-2099] and 18 dogs died for causes related to the mast cell tumour after a median of 116 days [range 3-292].
Kaplan–Meier survival plots and corresponding log-rank tests for MI, Ki-67 and MCM7 as categorical variables were highly significant (P <0.0001). Multivariable Cox proportional hazard regression analysis of MI, Ki67 and MCM7 corrected for age and surgical margins indicated that the higher risk of dying for causes associated with the mast cell disease was associated with MCM7 > 0.18 (HR 14.7; P <0.001) followed by MI > 5 (HR 13.9; P <0.001) and Ki67 > 0.018 (HR 8.9; P <0.001). Another multivariable model which included MI, Ki67 and MCM7 showed that these prognostic marker were independent from each other.
4
Conclusion. The present study confirms that MCM7 is an excellent prognostic marker in
cutaneous MCTs and is able to divide Patnaik intermediate grade tumours in two categories with different prognosis.
The comparison between different prognostic indicators showed that the mitotic index is a good test, but lacks of sensitivity, while Ki67 and MCM7 are both excellent tests with high sensitivity and high specificity. In this study, cases with high Kiupel grade overlapped entirely with cases with high mitotic index and therefore they were evaluated together. MI, Ki67 and MCM7 were independent prognostic markers and therefore it would make sense to combine them to improve their individual prognostic value.
5
LIST OF FIGURES
FIGURE 1. Cytological sample of a well-differentiated MCT. 11 FIGURE 2. Cytological sample of a poorly differentiated MCT. 11 FIGURE 3. Well-differentiated mast cell tumour. 12 FIGURE 4. Same sample as Figure 3 at higher magnification. 12 FIGURE 5. Intermediate Patnaik grade and low Kiupel grade mast cell
tumour.
17 FIGURE 6. Intermediate Patnaik grade and high Kiupel grade mast cell
tumour. Note the high number of mitoses.
17 FIGURE 7. KM survival plot of the 90 dogs included in the study. The median
survival time was not reached after 2099 days.
35
FIGURE 8.
MCM7 immunostaining of an intermediate grade mast cell tumour. Note the strong positivity of the basal layer of the epidermis.
37
FIGURE 9. Same sample as Figure 8. Ki67 immunostaining. 37 FIGURE 10. MCM7 immunostaining of an intermediate grade mast cell
tumour. The MCM7 score was 0.51 suggesting a poor outcome.
38 FIGURE 11. Same sample as Figure 10. Ki67 immunostaining. The Ki67 index
was 0.056 equally suggesting a poor outcome.
38 FIGURE 12. Western blot analysis of extracts from canine skin lysate using
MCM7.
39 FIGURE 13. Roc curves for MI (blue), Ki67 (Red) and MCM7 (green). 41 FIGURE 14.
KM survival plot for MI, Ki67 and MCM7 as a categorical variable. The threshold value for MI was 5, for Ki67 was 0.018 and for MCM7 was 0.18.
43
FIGURE 15.
Distribution of Ki67 and MCM7 in dogs that have been censored and dogs that died as a result of the MCT. The horizontal bar set for a value of Ki67 of 0.050 and a value of MCM7 of 0.25.
49
FIGURE 16.
KM plot obtained from the combination of Ki67 and MCM7 with the individual threshold set respectively at 0.018 and 0.18 in the left and KM plot for threshold set at 0.050 for Ki67 and a value of 0.25 for MCM7.
6
LIST OF TABLES
Table 1. Patnaik grading system for canine mast cell tumours. 13 Table 2. Kiupel grading system for canine mast cell tumours. 13 Table 3. World Health Organisation (WHO) Clinical Staging System for
MCTs
14 Table 4. Signalment and tumour characteristic of the 90 cases included in
the study.
35
Table 5.
Area under the curve for the ROC curve of MI, Ki67 and MCM7. Sensitivity, specificity and accuracy for published threshold values (MI = 5; Ki67 = 0.018; MCM7 = 0.18).
41
Table 6. KM survival analyses for MI, Ki67 and MCM7 with median
survival time (MST) and survival probability at 1-, 2- and 3-year.
43
Table 7.
Univariable and multivariable Cox regression analyses for MI, Ki67 and MCM7 with Hazard Ratio (HR), 95% Confidence Interval and statistical significance.
44
Table 8. Multivariable Cox regression analysis including MI, Ki67 and
MCM7 in the same model.
44 Table 9. Summary of false positive and false negative results and number
of prognostic markers involved.
49
Table 10.
KM survival analyses for the combination of Ki67 and MCM7 with median survival time (MST) and survival probability at 1-, 2- and 3-year.
50
Table 11.
Multivariable Cox regression analyses for the combination of Ki67 and MCM7 with Hazard Ratio (HR), 95% Confidence Interval and statistical significance.
7
1.0 INTRODUCTION
1.1 AETIOLOGYMast cell tumours (MCTs) are the most common cutaneous tumours in dogs, accounting for 16-21% of cutaneous tumours [1, 2].
The aetiology of MCTs is largely unknown as is the reason of the high incidence in dogs. Some studies have investigated a viral aetiology or chronic skin irritation, but unequivocal evidence is lacking [3-5].
The genetic alterations that predispose to canine MCTs are not completely understood. Alteration of the p53 tumour suppressor pathway have been identified in some canine MCTs, but p53 sequencing in a limited number of cases has revealed no mutations [5].
Stem cell factor (SCF) has been shown to be an important growth factor for mast cells [3]. Kit is the receptor of SCF and it is encoded by the proto-oncogene c-Kit. SCF-Kit interactions are required for the differentiation, survival, and normal function of mast cells. Several authors have recently identified the presence of activating mutations in the proto-oncogene c-Kit in canine MCTs [6-8]. Mutations appear to be more common in intermediate and high grade canine MCTs [9, 10] and consist most commonly of internal tandem duplication in the juxtamembrane domain of c-Kit in exon 11 and 12 [9-11]. Less frequently mutations can occur in the immunoglobulin-like domain of c-Kit in exon 8 and exon 9 [8, 11] and rarely in the phosphotransferase portion of the c-Kit kinase domain between exon 16 and 20 [12].
8
1.2 SIGNALMENT
MCTs are primarily a disease of older dogs [13, 14]. No sex predisposition has been reported. Many authors report a breed predisposition for Boxers, Labrador retrievers, Golden retrievers, Bull terriers, Shar-peis, and Schnauzers [3, 5, 14].
1.3 CLINICAL PRESENTATION
The vast majority of MCTs originate in the skin and subcutaneous tissue, but tumours arising from other sites have been uncommonly reported.
Cutaneous MCTs have a wide range of clinical presentation. Some of them have a history of shrinking and swelling related to intermittent mast cell degranulation and histamine release [4]. They usually appear as alopecic, oedematous, and erythematous masses or plaques [15].
Approximately 40% of tumours are located on the extremities (limbs and tail), 40% on the trunk including prepuce, perineum and inguinal region, and 20% on the head and neck [16]. Most commonly, dogs are presented with a single tumour, but multiple tumours are not uncommon accounting for 9-21% of cases [16, 17].
Most patients are evaluated by the veterinary surgeon for a skin mass and are otherwise asymptomatic. Clinical signs related with MCTs are associated to the biologically active substances contained in the cytoplasmic granules such as histamine, heparin, and proteolytic enzymes. Occasionally, mechanical manipulation during examination of the tumour results in degranulation and subsequent erythema and wheal formation in the surrounding tissues, a phenomenon referred as Darier’s sign. Other disorders caused by the release of the granules include gastrointestinal ulceration and perforation, hypotensive shock, coagulation abnormalities, and wound dehiscence [18]. Gastrointestinal ulceration is common, reported to occur in 35-83%
9 of necropsy specimens [5]. However, the fact that these numbers arose from a necropsy population is likely to overstate the prevalence of ulceration in the clinical setting. Degranulation of the mast cells secondary to the mechanical stimulation of the tumour (even walking if the tumour is located in a digit or an axilla) can lead to potentially life-threatening hypotensive events. Coagulation abnormalities are thought to be associated with heparin release, but they are clinically significant only in the perioperative period as localised haemorrhages [5]. MCTs were thought to cause delayed healing and wound dehiscence after removal, but a recent study showed that the rate of post- surgical complications of MCTs is not different from other cutaneous tumours [19].
1.4 DIAGNOSIS
MCTs are most commonly diagnosed from a fine-needle aspirate on cytology. Mast cells have distinctive discrete round cells characteristics and in addition fine to coarse metachromatic cytoplasmic granules (Figure 1 and 2). These granules allow a definitive diagnosis in the majority of cases.
Most practices use for in-house cytology dip stains such as Diff-Quik and Hema3 which are aqueous Romanowsky stains. These are adequate in the majority of cases, but occasionally they can fail to stain the characteristic granules making difficult to accurate distinguish a MCTs from other round cell tumours [20]. On such occasions, methanolic Romanowsky stains, such as Wright’s and Wright-Giemsa or Toluidine blue should be used to reveal cytoplasmic granules.
After surgical excision histopathology is the gold standard for the diagnosis of MCTs (Figure 3 and 4). The major advantages of histology over cytology are that it allows grading the tumour, providing essential prognostic information, and also the
10 evaluation of surgical margins. In dogs most neoplastic mast cells resemble their normal counterparts making the diagnosis relatively easy. The cells are round with round central to slightly eccentric nuclei and moderate, pink cytoplasm containing granules which stain light grey/blue with haematoxylin/eosin (HE) or purple with metachromatic stains.
Collagenolysis, sclerosis, oedema, necrosis and secondary inflammation are often seen in MCTs, and when severe, they can obscure neoplastic cells and make assessment of the surgical margin difficult [15].
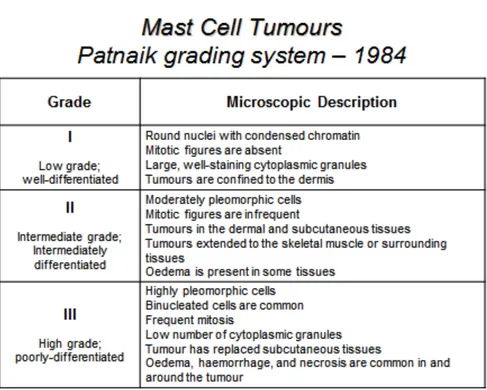
Histological grading systems have been developed to assist the clinicians in determining the outcome of dogs with cutaneous MCTs. The most widely accepted is the Patnaik grading system (Table 1) [13]. Recently a new grading scheme has been published by Kiupel and colleagues (Table 2) [21].
13 Table 1.Patnaik grading system for canine mast cell tumours.
14
1.5 STAGING
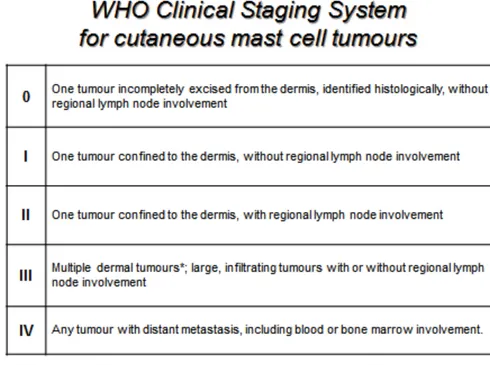
Clinical staging is the determination of the degree of local and systemic involvement of a tumour. The World Health Organisation (WHO) has developed clinical staging for canine MCTs (Table 3) [22].
The true metastatic potential of canine MCTs has not been determined, but there are data suggesting that the metastatic potential of well-differentiated MCTs is low (<5%), of intermediate grades is low to moderate (5-22%) [14, 23], and of poorly differentiated tumours is between 55-96% [5]. Most of these tumours disseminate first to the regional lymph node and then to visceral organs, mainly spleen and liver. Rarely, neoplastic mast cells might be observed in the peripheral blood and bone marrow. Involvement of the lungs is also rare [4, 5]. Routine clinical staging for MCTs should include haematology, fine-needle aspiration of the regional lymph node, abdominal ultrasound plus or minus fine-needle aspiration of liver and spleen and bone marrow aspirate.
15 Table 3. World Health Organisation (WHO) Clinical Staging System
16
1.6 PROGNOSTIC FACTORS
Many prognostic factors have been evaluated in canine MCTs: - Histological grade
The Patnaik histological grade is the most consistent prognostic factor in dogs with cutaneous MCTs [5, 13, 14]. Generally, dogs with high grade tumours die of their disease after local therapy alone within a year, whereas dogs with low grade tumours are generally cured with appropriate local treatment. The behaviour of intermediate grade MCTs is more difficult to predict because they behave as low grade tumours in 75% of cases and as high grade tumour in the remaining 25% [23-25]. The uncertainty of the prognosis of intermediate grade MCTs together with the subjectivity of the application of the grading scheme [26] is what prompted the development of a new 2-tier grading scheme published in 2011 [21]. The new scheme divides MCTs in two grades depending on morphological criteria and number of mitoses. Validation studies for the new system are currently not available, but many commercial laboratories have already started to report it in addition to the Patnaik system (Figure 5 and 6).
18 - Clinical stage and substage
Although the clinical staging scheme has been developed for prognostic purposes, each increase in stage (0-IV) has not been necessarily proven to worsen the prognosis. In particular dogs with stage III disease (multiple cutaneous tumours) have a similar prognosis of dogs with stage I disease (single tumour confined to the dermis) after proper surgical management [16, 27]. Dogs with stage II (involvement of the local draining lymph node) have a shorter survival than dogs with stage I disease [28]. Finding distant metastases in visceral organs [29, 30] or bone marrow [31] carries a guarded prognosis.
The presence of systemic signs (gastrointestinal signs or collapse) or substage b is also considered a negative prognostic indicator [5].
- Anatomic location
Tumour in the preputial/inguinal area, subungual region, and other mucocutaneous sites, including oral cavity and perineum, are anecdotally associated with more aggressive behaviour. However, two recent studies suggested no difference in outcome for dogs with inguinal or perineal MCTs compared to dogs with tumours in other sites [32, 33]. There is one study suggesting that MCTs located in the muzzle are biologically more aggressive with a higher regional metastatic rate than previously reported for tumours in other sites [34, 35].
The involvement of visceral organs always carries a guarded to poor prognosis [36, 37].
19 - Cutaneous/Subcutaneous location
MCTs arising from and confined to the subcutaneous tissue have extended survival times and disease-free survival and are associated with a low rate of local recurrence and metastatic rate. Significant negative prognostic indicators include mitotic index, infiltrative growth pattern and the presence of multinucleation [38].
The Patnaik or Kiupel grading scheme should not be applied to this subset of MCTs.
- Cell proliferation rate
o Mitotic index (MI) is defined as the number of mitoses per 10 high-power fields (400X) and can be determined with haematoxylin and eosin stained sections. Three recent studies [39-41] found a significant association between MI, tumour grade and overall survival.
o Bromodeoxyuridine (BrDU), an analogue to thymidine, is incorporated in vivo in the nucleus in S phase and can be detected by immunohistochemistry on formalin-fixed, paraffin embedded tissue. A study showed that BrDU labelling index correlates well with the mitotic index and the Ki-67 index [42].
o Relative frequency of argyrophilic nucleolar staining organising regions (AgNORs) proteins are a set of nuclear proteins that increases gradually from early G1 phase, reaches the maximum value at the end of S-phase, and remains constant up to the late G2 phase. This stain can be performed on a formalin-fixed specimen. The relative frequency of AgNOR has been correlated with the rate of cell proliferation or doubling time in vitro [43]. In multiple studies it has been demonstrated that the relative frequency of AgNOR correlates with the histological grade and is predictive of postsurgical outcome [43-45]. In
20 another study the AGNOR score could predict the outcome independently from the Patnaik grade [46].
o Ki-67 protein is a non-histone nuclear protein present during all active phases of the cell cycle (G1, S, G2, and M), but absent in quiescent or resting cells. Multiple studies [41, 43, 46, 47] found that Ki-67 protein score was significantly associated with survival independently from the tumour grade. Moreover Ki-67 score is able to predict survival for intermediate grade tumour [25, 41].
o Proliferating cell nuclear antigen (PCNA) is a nuclear protein which functions as a co-factor for DNA-polymerase delta in both the G phase and DNA synthesis. In one study [45] PCNA was considerably higher in recurrent versus non-recurrent tumours and in metastatic versus non-metastatic tumours. In the same study it was a good predictor for tumour recurrence at 6 months. However, two recent studies [43, 46] found that PCNA score was not significantly associated with an increased risk of local recurrence, metastatic spread or MCT-related death.
o Minichromosome Maintenance Proteins (MCM) are six proteins (MCM2 to MCM7) essential for DNA replication and they are thought to function as licensing component for the S-phase of the cell cycle initiation [48]. Expression of MCM is seen throughout all phases of the cell cycle and is down regulated following exit from the cell cycle into quiescence, differentiation or senescence. A recent study [49] have shown that the expression of MCM7 was significantly associated with survival and completely independent from the histological grade in dogs with cutaneous MCTs.
21 - Kit staining pattern and mutation status
Mutated c-Kit, mostly internal tandem duplication (ITD), is constitutively activated and induces growth factor–independent cell proliferation [6-8]. MCTs with ITD have significantly higher Ki67 and AgNOR indices indicating increased proliferative activity [43]. mRNA encoding for the Kit receptor is overexpressed in canine MCT, but there is no association with intracellular protein localization or cDNA mutations [11].
There is contradicting evidence on the prognostic significance of ITD. Multiple studies [9, 10, 50] found that ITDs are more likely to occur in intermediate and high grade MCTs, suggesting that the mutation has an impact in the aggressiveness of the tumour. However, only one study [50] could demonstrate statistically that the presence of ITD was significantly associated with decreased survival time, increased mortality related to mast cell disease, decreased disease-free interval and increased recurrence rate. Expression of the mRNA encoding for the KIT receptor and the stem cell factor (SCF) does not appear to be associated with the prognosis [11, 51].
The vast majority of MCTs express Kit. In normal mast cells and in some MCTs Kit appears localized on the cell membrane, while in most MCTs it accumulates in the cytoplasm. In the first study, well-differentiated MCTs showed a weak expression of Kit, while poorly-differentiated MCTs presented high expression [52]. Two subsequent studies [53, 54] identified in MCTs three Kit staining patterns: membranous, cytoplasmic focal/stippled and cytoplasmic diffuse. The Kit expression pattern was significantly correlated with histological grade, cell differentiation and nuclear grade in one study, but the number of dogs
22 was probably too small for a meaningful evaluation of its prognostic value [53]. The other study [54] had a larger population of dogs and identified that the Kit-staining pattern was associated with local recurrence, death due to MCT, and death due to other causes on a multivariable survival analysis. Possible explanations for the prognostic value of the c-kit staining pattern is the significant association between Kit aberrant intracellular localization and ITD [50, 51] and also between Kit aberrant intracellular localization and increased proliferative indices such as Ki67 and AgNOR [43]. Two more recent studies [11, 51] did not find a significant association between Kit pattern and histological grade, local recurrence or overall survival time, but the different IHC method used in these studies or perhaps the unavoidable subjectivity in the interpretation can in part explain these contradicting results.
1.7 TREATMENT
Treatment options for MCTs include surgery, radiotherapy and chemotherapy, or a combination of these modalities depending on the site of the lesion and the previously discussed prognostic factors.
In general wide surgical excision of the tumour is the treatment of choice after cytological diagnosis if the tumour is in a location amenable to surgery and no negative prognostic indicators are present (peritumoral oedema or bruising, lymph node or distant metastasis, or presence of systemic signs). Once excised, the tumour is sent for grading and histopathologic evaluation of the margins of excision in order to decide if further evaluation of prognostic markers, staging or treatment is advisable. When the tumour is not amenable to surgical resection or has already metastasised, neoadjuvant or palliative chemotherapy is indicated before or instead of surgery [4, 5].
23 Radiotherapy is used to improve local control when surgical margins are infiltrated and the location does not allow a second surgery with wider margins [3, 5].
24
2.0
PREVIOUS WORK ON MAST CELL TUMOUR
PERFORMED AT THE AHT
The Animal Health Trust (AHT) has worked on MCTs for the last 10 years.
At first Sue Murphy performed a retrospective epidemiological study on the relationships between the histological grade of cutaneous MCTs in dogs, their survival and the efficacy of surgical resection [14]. The study included 280 dogs and found that the one-year survival rates for the dogs with MCTs were significantly associated with the Patnaik grade, being 100% for grade I, 92% for grade II and 46% for grade III. The median survival time for the dogs with poorly differentiated tumours was 278 days, significantly shorter than that for the dogs with either intermediately or well-differentiated tumours, which were both over 1300 days. Regrowth of the tumours was identified in 10 (19%) of the dogs with poorly differentiated tumours, 12 (6%) of the dogs with intermediately differentiated tumours and one of the dogs with well-differentiated tumours; only 3 of the tumours which regrew initially had complete margins.
A second study looked at the effects of stage and number of tumours on prognosis of dogs with cutaneous MCTs [16]. Follow-up data for survival analysis of 145 dogs with single tumours and 50 dogs with multiple tumours were evaluated and there was no significant difference between the survival times of the two groups. The survival rates after 12 and 24 months were 88% and 83%, respectively, for the dogs with single tumours, and 86% at both intervals for the dogs with multiple tumours. Eight of the dogs with single tumours had lymph node metastases (stage II disease) and these dogs had a median survival time of 431 days, whereas the 50 dogs with multiple tumours (classified
25 as stage III disease) and the dogs with single tumours (classified as stage I disease) had not reached their median survival times.
From these studies it appeared that the Patnaik histologic grade was the most important prognostic factor, but the clinical progression and behaviour of grade II MCTs was still difficult to predict. Hence, the subsequent work focused on the correlation of proliferation markers with prognosis [46]. Immunohistochemical staining for Ki67, proliferating cell nuclear antigen (PCNA) and a standardized argyrophilic staining of nucleolar organizer regions (AgNOR) protocol were performed on 121 archived paraffin-embedded specimens of canine cutaneous MCTs, for which clinical follow-up data were available. Cox regression models indicated that the Ki67 index (HR, 1.92; P < .001) and mean AgNOR score (HR, 2.57; P < .001) were significantly associated with Patnaik grade and survival time. A binary Ki67 variable with a threshold of 0.018 was a significant predictor of survival for dogs with grade II MCTs. The estimated 1-, 2-, and 3-year survival probabilities for dogs with grade II MCTs and Ki67 index ≤ 0.018 were 0.92, 0.86, and 0.77, respectively. The corresponding survival probabilities for dogs with grade II MCTs and Ki67 scores > 0.018 were 0.43, 0.21, and 0.21, respectively. No significant association was identified between survival and PCNA score. These findings showed that both mean AgNOR score and Ki67 index are prognostic markers for canine MCTs, but only Ki-67 index could be used to divide Patnaik grade II MCTs into 2 groups with markedly different expected survival times.
A validation study evaluated the association of Ki67 index with prognosis for grade II cutaneous MCTs [25]. Ki67 index as a binary variable with a threshold value of 0.018 was confirmed to be associated with prognosis (HR, 19.1; P < 0.0001) for this cohort of dogs. The 1-year, 2-year and 3-year survival probabilities of 127 dogs with a Ki67 index ≤
26 0.018 were 95%, similar for all, and for 36 dogs with a Ki67 index > 0.018 were 0.54, 0.45 and 0.33, respectively.
Another study compared the relative abilities of Ki67 and mitotic index to predict survival in dogs with cutaneous MCTs [41]. Histological grade, mitotic index and Ki67 index were performed in 95 dogs with known outcome. Survival times varied significantly between categories of histological grade, mitotic index and Ki67 index. Multivariable analyses showed that the risk of dying due to MCT was similar in dogs with increased Ki67 index [HR, 3.0 (95% CI 1.3–6.8)] or increased mitotic index [HR, 2.7 (95% CI 1.1– 6.5)]. In conclusion the study showed that both mitotic index and Ki67 index were able to independently differentiate MCTs with worse prognosis.
Finally, we investigated the value of a novel proliferation marker called minichromosome maintenance protein 7 (MCM7) in the prognosis of MCTs [49]. Ninety-five dogs were included with 31 dying of MCTs. A value of 0.18 was used as threshold value of MCM7 score as a binary variable. The median survival time for MCM7 score ≤ 0.18 was not reached at 3668 days, whereas for MCM7 score > 0.18 was 187 days (log-rank test; P < 0.0001). In the multivariable analysis, MCM7 was significantly associated with survival after controlling for age, surgical margins and histological grade (hazard ratio 9.2; P = 0.001).
27
3.0 AIMS AND OBJECTIVES
3.1 AIMSThe primary aim of this study was to evaluate the prognostic value of MCM7 in a different cohort of dogs with intermediate grade MCT.
The secondary aim was to evaluate the performances of other prognostic markers including Kiupel histological grade, mitotic index and Ki67 index.
3.2 OBJECTIVES
To identify between 100 and 120 samples of dogs with a diagnosis of intermediate grade mast cell tumour and known outcome.
To perform MCM7 score, Kiupel histological grade, mitotic index and Ki67 index for each sample blinded to outcome.
To compare the association between different prognostic factors and outcome.
28
4.0
MATERIALS AND METHODS
4.1 DATA ACCUMULATIONThe AHT is a veterinary charity dedicated to improving the health and welfare of dogs, cats, and horses through clinical services and research. Clinical services of the AHT are divided into the Centre of Small Animal Studies, the Centre of Equine Studies and a Diagnostic Laboratory which offers a service of clinical pathology, histopathology, and immunohistochemistry open to any veterinary practice in the United Kingdom.
A retrospective study was performed to identify dogs bearing MCTs treated with surgery alone with known outcome with a target number between 100 and 120 samples of MCTs.
The database of the Diagnostic Laboratory was searched from the years 1997-2007. The search included all reports containing the words ‘mast cell tumour’.
Every report was individually reviewed. Reports were discarded if: o Belonging to any of other species than canine.
o It was a cytology examination or immunohistochemical analysis. o The final diagnosis was not consistent with MCT.
o The MCT was located in any other area but the skin (subcutaneous tissue, visceral, etc.).
o The MCT was Patnaik grade I or III. o The MCT was a recurrent tumour.
o The MCT was submitted with a sample of another malignant tumour.
From each of the remaining reports the following details were entered onto a database (Excel, Microsoft, 2010):
29 o Histopathology number
o Submitting veterinary practice o Breed
o Sex
o Date of birth
o Date of submission of the sample o Name of the dog
o Name of the owner o Location of the tumour o Grade
o Single or multiple tumour(s) o Margin of excision
Once entered in the database it was possible to sort these data easily, making easier to group them depending on the desired characteristic.
4.2 FOLLOW UP
The follow up of dogs entered in the study was obtained using the database of the Diagnostic Laboratory or, alternatively, calling the veterinary surgeon that sent the sample to the laboratory or the owner if the dog was a client of the Centre for Small Animal Studies of the Animal Health Trust.
4.3 CENSORING OF DATA
4.3.1 TIME RESTRICTIONS
A minimal of one year follow up was required for samples of dogs that were censored at the survival analysis (alive at the last follow up available or
30 dead for causes not related to the MCT). Events were selected from dogs that died from causes related to the MCT within one year from the diagnosis.
4.3.2 TREATMENT
Treatment can alter greatly the outcome of patients. Therefore, only patients treated with surgery and steroids were allowed in the study. Dogs that received any other treatment (neoadjuvant or adjuvant chemotherapy or adjuvant radiotherapy) were excluded.
4.4 SURVIVAL DATA
The date of diagnosis, as the day of submission of the sample to the laboratory, was used as entry point. Another possibility would have been using the date the owner first noticed the mass, but this was thought inaccurate and extremely variable as it relied on the owner’s memory. The last reported date that the patient was seen alive by the referring practice or the day that the patient died if it was for causes unrelated to the MCT was used as date of censor. Dogs reported as dead due to mast cell tumour were recorded as events. This end point was used to generate Kaplan-Meier survival plots with associated Log-rank test and for Cox’s regression analyses. As the number of events was small we decided not to discriminate between different reasons of death due to MCTs.
4.5 MITOTIC INDEX, IMMUNOHISTOCHEMISTRY FOR KI-67 AND MCM7
Slides were retrieved from the archive of the Diagnostic Laboratory for each case that satisfied the inclusion criteria (known outcome, adequate follow up and no previous treatment apart from surgery and prednisolone). The slides were then blindly reviewed by a single pathologist (Roberta Rasotto, Dip.ECVP) to select the best
31 section for grading (confirm Patnaik and perform Kiupel grade), determination of the mitotic index and immunohistochemical analyses.
4.5.1 MITOTIC INDEX
The mitotic index (MI) was obtained using the same methodology as Romansik and colleagues [39] as the aim of the study was to compare different prognostic markers as used routinely by diagnostic laboratories. The mitotic index (MI) was generated counting the number of mitoses per 10 high-power fields (400 X) in the region with the highest overall mitotic activity. A single count of 10 HPFs was obtained for each tumour sample.
4.5.2 IMMUNOHISTOCHEMISTRY
For each paraffin-embedded tissue block two five-micrometer sections were obtained and mounted on a positively charged, capillary gap glass slide. Antigen retrieval was performed by incubating the mounted section in a microwave oven for 10 minutes in an EDTA buffer, pH 9.0 (Dako Cytomation, Ely, Cambridgeshire, United Kingdom). Immunohistochemical staining was then performed using an automated system (Dako Techmate, Ely, Cambridgeshire, United Kingdom). Endogenous peroxidase activity within the tissues was then blocked with hydrogen peroxidase, and the sections were then incubated for 30 minutes with Ki67 or MCM7 antibody. The Ki67 staining (Monoclonal Mouse anti-human, Clone MIB-1, Dako Cytomation, Ely, Cambridgeshire, United Kingdom) had already been optimised at a dilution of 1:400 in a previous study performed at the AHT [46]. The MCM7 staining
32 (Monoclonal Mouse anti-human, Clone CDC47, Neomarkers, Fremont, CA, USA) was optimised at a dilution of 1:200.
The specificity of the MCM7 antibody used in this study was evaluated with Western Blot analysis performed on extracts of normal canine skin lysates. The antibody was specific and did not appear to cross-react with other proteins.
For both Ki67 and MCM7 immunoreactivity was visualized using a two-layer method and chromogen developed with diaminobenzidine. Internal positive controls consisted of the normal skin tissues overlying the neoplastic proliferations. For negative controls, the primary antibody was replaced with the antibody diluent.
4.5.3 IMAGE CAPTURE AND CELL COUNTING
The image capture and cell counting were obtained using the same procedure of previous studies performed at the AHT [25, 46, 49].
Each section of Ki67 and MCM7 stain was viewed under light microscopy at a magnification of 200X. The expected immunostaining for both the antibodies was nuclear. A digital picture of the tumour was obtained. In order to avoid necrotic areas often present in the centre of the tumour or inflammation at the periphery, the image was captured approximately at one third of the distance from the deep and lateral margin.
The digital picture was then opened with a computer program (CellCounter®, 2006), which allowed differential counting of positive and negative cells. Positive and negative cell count for each sample was inserted in the Excel datasheet which calculated the number of positive cells divided by
33 the total number of cell counted generating the Ki67 index (Ki67) and the MCM7 score (MCM7). A pathologist (Roberta Rasotto) captured the images, while the author (Davide Berlato) performed the cell counts blinded of outcome.
4.6 STATISTICAL ANALYSIS
The ROC curve was used to evaluate the performance of MI, Ki67 and MCM7 as predictors of MCT-related survival. The test was also used to evaluate whether the published threshold value for each parameter was appropriate.
Preliminary associations between survival measured as a binary outcome and predictor variables (measured as categorical variables) were examined using chi-square analysis or Fishers exact test as appropriate depending on the sample distribution.
Survival periods measured in days up to 2099 from initial presentation were used in survival analyses with non-survival defined as death or euthanasia as a consequence of the MCT (local recurrence or metastatic disease). Kaplan-Meier survival plots and corresponding non-parametric log-rank tests were examined initially. Univariable Cox’s proportional hazard regression analysis was also performed after checking that the assumption of proportional hazard across categories of each variable was not violated. Multivariable Cox’s proportional hazard regression analyses were then conducted using a forward stepwise procedure to account for potentially significant confounding by age of animals at entry to the study and extent of surgical excision. The statistical significance was set at 5%.
A commercial software was used for the statistical analysis (IBM SPSS Statistics 21, Chicago, IL, USA).
34
5.0 RESULTS
5.1 Study populationA total of 90 dogs with intermediate grade mast cell tumour were included in this study.
Characteristics of patients are summarized in Table 4. The median age of this cohort of dogs was 7.7 years (range from 2.3 months to 15.0 years). There were 42 females (8 entire and 34 neutered) and 48 males (20 entire and 28 neutered). Nineteen different breeds were represented with Labrador retriever, Golden retriever, and Boxer being approximately 60% of the entire study population. The location of the tumour was assigned to one of four categories (head, trunk, extremities, and unknown). There were 39 MCTs located in the trunk, 36 in the extremities, 11 tumours in the head, and 4 in an unknown cutaneous site. The margin of excision was available in all cases: it was complete in 31 dogs, with narrow margin in 20 cases (less than 1mm), and infiltrated in the other 39 patients.
The median survival for the entire population was not reached at 2099 days (Figure 7). The mean survival time was 1708 days [95% C.I. 1546-1870]. Seventy-two cases were censored after a median follow up of 1136 days [range 491-2099] and 18 dogs that died for causes related to the mast cell tumour after a median of 116 days [range 3-292].
35 Table 4. Signalment and tumour characteristic of the 90 cases included in the study.
36
5.2 Immunohistochemistry
The Ki67 and MCM-7 antibodies stained in variable proportions the neoplastic mast cells and the basal layer of the epidermis in all the samples examined (Figure 8, 9, 10 and 11). The western blot analysis showed that the anti-human MCM7 antibody used for the immunohistochemical analyses bound only one protein of the expected molecular weight (80kDa) confirming its specificity for the canine MCM7 protein (Figure 12).
40
5.3 ROC curve for MI, Ki67 and MCM7
The MI, Ki67 index and MCM7 score was calculated for the 90 samples included in the study. A ROC curve for each prognostic indicator was obtained to evaluate the performance in predicting death due to causes associated with the MCTs (Figure 13). The area under the curve (AUC) of the MI was 0.78 (95% CI 0.64-0.91), the AUC of Ki67 was 0.89 (95% CI 0.80-0.98) and the AUC of MCM7 was 0.87 (95% CI 0.76-0.98).
The ROC curve also confirmed that the threshold value chosen for each parameter in previous studies [39, 46, 49] was appropriate (Table 5). For MI a threshold of 5 was associated with a sensitivity of 0.39 and a specificity of 0.99; for Ki67 a threshold of 0.018 was associated with a sensitivity of 0.78 and a specificity of 0.83; and for MCM7 a threshold of 0.18 was associated with a sensitivity of 0.83 and a specificity of 0.86.
41 Table 5. Area under the curve for the ROC curve of MI, Ki67 and MCM7. Sensitivity, speci-
42
5.4 Association between prognostic variables and survival
Analyses were performed for the Kiupel grade, MI, Ki67 and MCM7.
Cases with high Kiupel grade overlapped precisely with cases with high mitotic index and therefore these two variables were considered the same for the remaining of this section and only analysis for MI will be reported.
There were 82 dogs with MI ≤ 5 and 8 dogs with MI > 5; 57 dogs with Ki67 ≤ 0.018 and 23 with Ki67 > 0.018; 65 dogs with MCM7 ≤ 0.18 and 25 dogs with MCM7 > 0.18.
A significant association was present between categories of MI, Ki67 and MCM7 and death related to the mast cell disease (Fisher’s exact test; P <0.001).
5.5 Survival analyses
The survival analysis was performed for the MI, Ki67 and MCM7.
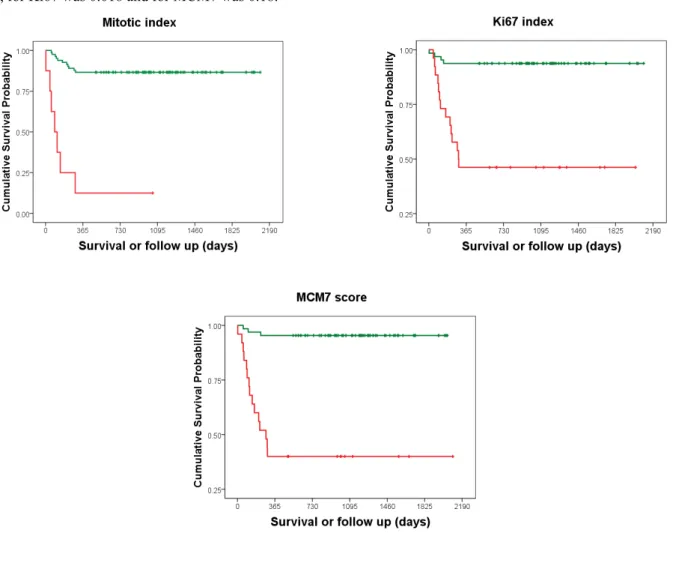
Kaplan–Meier survival plots and corresponding log-rank tests for MI, Ki-67 and MCM7 as categorical variables were highly significant (P <0.0001) (Figure 14 and Table 6).
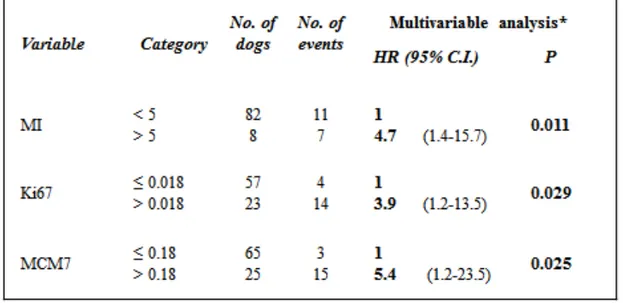
Univariable Cox proportional hazard regression analysis of individual prognostic variables and multivariable Cox proportional hazard regression analysis of each individual prognostic variable corrected for age and surgical margins produced similar results. All prognostic variables were highly significant (P <0.001) (Table 7).
A further multivariable Cox proportional hazard regression analysis including all predictor variables in the same model after correction for age and surgical margins showed that MI, Ki67 and MCM7 were independent variables and maintained their significance (Table 8).
43 Figure 14. KM survival plot for MI, Ki67 and MCM7 as a categorical variable. The threshold value for MI was
5, for Ki67 was 0.018 and for MCM7 was 0.18.
Table 6. KM survival analyses for MI, Ki67 and MCM7 with median survival time (MST) and survival probability at 1-, 2- and 3-year.
44 Table 7. Univariable and multivariable Cox regression analyses for MI, Ki67 and MCM7 with
Hazard Ratio (HR), 95% Confidence Interval and statistical significance.
45
6.0 DISCUSSION
6.1 Descriptive resultThe primary aim was to evaluate the prognostic value of MCM7 in a different cohort of dogs with intermediate grade MCT.
In our previous study [49] the area under the ROC curve was 0.92 [95% C.I. 0.85– 0.98] and a threshold for the MCM7 score of 0.18 was associated with a sensitivity of 81% and a specificity of 86% for detecting death associated with the MCT. The risk of dying of MCT in dogs with MCM7 > 0.18 after correction for age and surgical margins was 9.2 times higher than in dogs with MCM7 < 0.18.
In the present study including only intermediate grade MCT, the area under the ROC curve was 0.87 (95% CI 0.76-0.98) indicating that the test was good to excellent. The threshold of 0.18 was considered adequate and associated with a sensitivity of 83% and specificity of 86%. An increased MCM7 score was associated with an increased risk of dying of MCT of 14.7 times after correction for age and surgical margins.
Other prognostic markers including the Kiupel grading system, mitotic index and Ki67 index were also evaluated in the present study.
Cases with high Kiupel grade overlapped completely with cases with high mitotic index. A certain degree of overlapping between these two classifications was not unexpected because the MI is an important criterion to assign the Kiupel grade, but we thought that other criteria involving nuclear atypia (≥3 multinucleated cells in 10HPF, ≥3 bizarre nuclei in 10HPF, or karyomegaly) would have allowed the inclusion of other cases in high Kiupel grade category. It is possible that a higher number of cases would have allowed such differentiation.
46 In previous studies [39, 41], a threshold for the mitotic index of 5 applied to the intermediate histologic grade was associated with a sensitivity of 38-60% and a specificity of 84-95%. The risk of dying of MCT in dogs with MI > 5 was 15.4 times higher than in dogs with MI ≤ 5 in the univariable Cox regression analysis [41]. In the present study we obtained a sensitivity of 39%, which is comparable with the result of the study performed by Romansik and colleagues [39], and a specificity of 99%. An increased mitotic index was associated with a risk of dying of MCT that was 14.7 times higher in the univariable analysis and 13.9 times higher in the multivariable analysis after correction for age and surgical margins.
In previous studies [25, 41] a Ki67 of 0.018 applied to intermediate grade MCTs was associated with a sensitivity of 60-79% and a specificity of 86-90%. The risk of dying of MCT in dogs with Ki67 > 0.018 was 9.8-19.1 times higher than in dogs with Ki67 ≤ 0.018.
In the present study we obtained similar sensitivity and specificity, respectively 78% and 83%. In the univariable analysis an increased Ki67 was associated with an increased risk of dying of MCT of 11.0 times and 8.9 times in the multivariable analysis after correction for age and surgical margins.
47
6.2 Can we improve the performance of these prognostic markers?
Our results largely confirms previous studies [25, 39, 41, 46, 49]. The mitotic index appeared to be a good test, but lacks of sensitivity, while Ki67 and MCM7 are both excellent tests with high sensitivity and high specificity when used to predict outcome in intermediate grade MCTs.
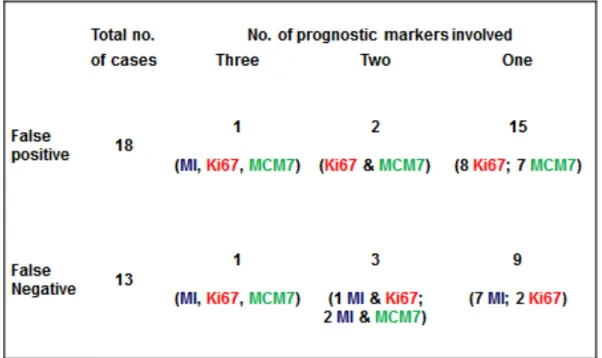
MI, Ki67 and MCM7 were independent from each other in the multivariable Cox regression analysis (Table 8) and therefore it would make sense to combine them to improve their prognostic value. In this study, the majority of false positive was due to falsely increased Ki67 or MCM7, while the majority of false negative was due to a mitotic index below the threshold (Table 9).
The mitotic index is reported routinely by most commercial laboratories because it can be done from H&E stain at no additional cost. This test is extremely specific, but lack of sensitivity. Adding Ki67 or MCM7 in all cases with a MI ≤ 5 could be advantageous, because these tests are more sensitive. From our study Ki67 and MCM7 are equally good and there is no clear benefit in choosing one over the other.
Performing both MCM7 and Ki67 together can increase the sensitivity to 94%, but not without a significant loss of specificity to 74% for an overall accuracy of only 78%. This problem can be solved by increasing the threshold of each parameter which would maintain a higher sensitivity without compromising the specificity. Examining the distribution of the Ki67 and MCM7 between dogs that have been censored and dogs that died as a result of the MCT (Figure 15), it is apparent that the majority of false positive cases have a 0.018 < Ki67 ≤ 0.05 and 0.18 < MCM7 ≤ 0.25. Indeed, a value of Ki67 of 0.5 and a value of MCM7 of 0.25 are associated with a specificity of about 95% in the ROC curve (Figure 13).
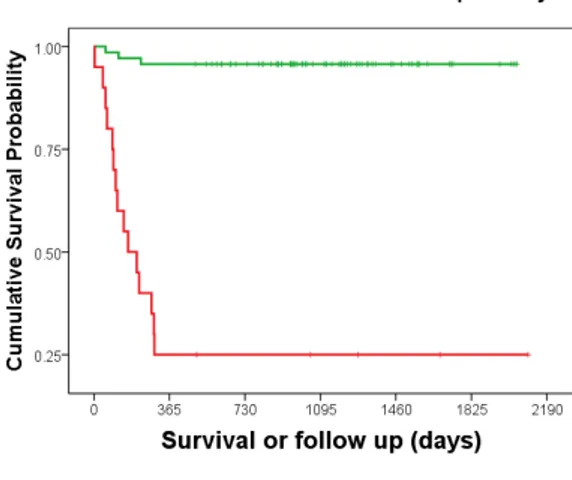
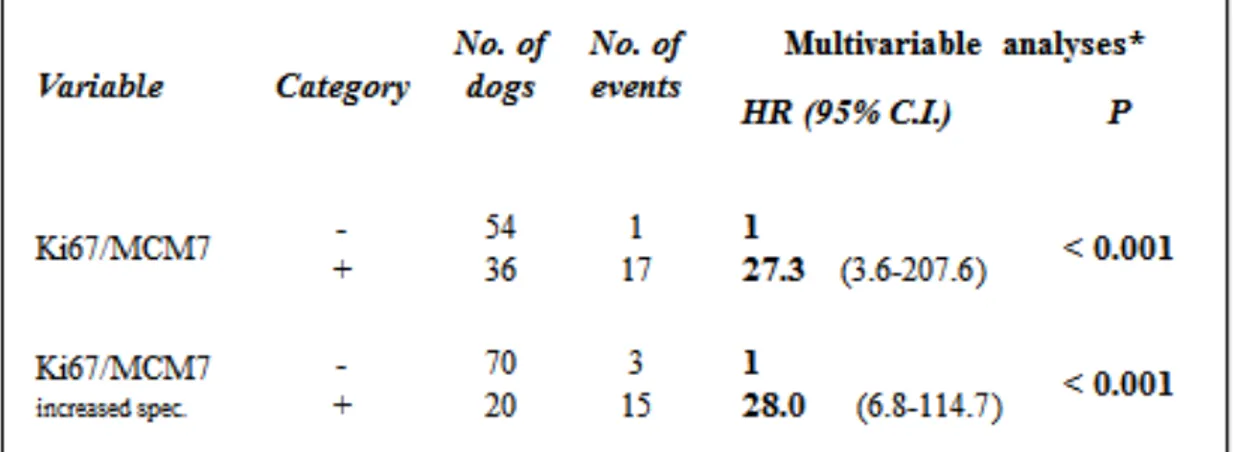
48 The test that results from the combination of Ki67 with a threshold of 0.05 and MCM7 with a threshold of 0.25 presents the best performance providing a sensitivity of 83%, a specificity of 93% for an overall diagnostic accuracy of 91%. The resulting Kaplan– Meier survival plot and log-rank test are highly significant (P <0.0001) and reflecting nicely the improvement (Figure 16 and table 10). Similar results are seen in the multivariable Cox regression analysis (Table 11) where dogs with an increased Ki67/MCM7 test were 28.0 times more at risk of dying of MCT than dogs with a low Ki67/MCM7 test.
49 Table 9. Summary of false positive and false negative results and number of prognostic markers involved.
Figure 15. Distribution of Ki67 and MCM7 in dogs that have been censored and dogs that died as a result of the MCT. The horizontal bar set for a value of Ki67 of 0.050 and a value of MCM7 of 0.25.
50 Figure 16. KM plot obtained from the combination of Ki67 and MCM7 with the individual threshold set respectively at 0.018 and 0.18 in the left and KM plot for threshold set at 0.050 for Ki67 and a value of 0.25 for MCM7.
Table 10. KM survival analyses for the combination of Ki67 and MCM7 with median survival time (MST) and survival probability at 1-, 2- and 3-year.
51 Table 11. Multivariable Cox regression analyses for the combination of Ki67 and MCM7 with
52
6.3 WEAKNESS OF THE STUDY 6.3.1 DATA ACCUMULATION
One of the major weaknesses of this study is its retrospective nature. Follow up data were obtained directly by the referring practice or by the owners. The data might have been incomplete or inaccurate in same cases.
6.3.2 CASE SELECTION AND FOLLOW UP
In order to reduce confounders and possible artefacts related to retrospective nature of the study, several measures were adopted: o Only dogs with an adequate follow up were included in the study. o Dogs with multiple tumours should have been ideally excluded, but this
would have had a huge impact in the final number of cases.
o Only patients treated with surgery and steroids were allowed in the study as treatment is a major confounder.
The drawback of the applications of these measures is that it reduced greatly the number of cases available for the study.
6.3.3 SURVIVAL
One of the problems with studies in veterinary medicine is the definition of the entry and of the end point.
In this study, the date of the first submission of the histopathology sample is chosen as entry point as it is easy to retrieve and consistent for all patients. Another possibility would have been choosing the date in which the owner or the veterinary surgeon first noted the lump on the dog, but this would have been extremely
53 subjective and dependant on many variables. For example, some owners are more careful in examining their own dog or seek the veterinary attention sooner than others; similarly, some veterinary surgeons are more proactive in investigating and treating a cutaneous mass than others.
The end point of the study is death related to the MCT. This included spontaneous death or euthanasia directly related to local or systemic disease.
As veterinarians, we are very fortunate to be responsible of the wellbeing of our patients from the first visit to the end of life. In the same way we recommend a diagnostic procedure or a treatment, we sometimes advise for the humane demise of our patient. The most common reason for euthanasia is the deterioration of the quality of life to the point that euthanasia is a kind relief to suffering. However, the concept of ‘acceptable’ quality of life varies enormously between owners and veterinarians making the decision extremely subjective. Moreover, concurrent problems such as systemic diseases (chronic renal disease, diabetes mellitus, etc.) or simply the severe osteoarthritis seen often in old dogs contribute greatly to the final decision. In such occasions the investigator has a dilemma because it is difficult to decide whether the mast cell tumour was the reason for euthanasia or not.
54
6.3.4 MITOTIC INDEX, IMMUNOHISTOCHEMISTRY, IMAGE CAPTURE, AND CELL COUNTING.
There are some limitations in the laboratory related part of the study.
The Ki-67 and the MCM7 were performed by the author who is not a pathologist. However, adequate training was provided by the pathologists involved in the study and the best effort was made in order to produce reliable data. My opinion is that counting negative and positive cells for evaluation of Ki-67 and MCM7 is quite straightforward once the staining technique has been set up adequately. This aspect can also be considered a further strength of both these tests considering a future widespread use in a commercial setting.
The digital image obtained for each immunohistochemistry stain to perform the differential counting was taken following the previously described method [25, 46]. The picture was obtained approximately 1/3 of the distance from the deep and lateral margin to avoid necrotic areas often present in the centre of the tumour or inflammation at the periphery. However, tumours are not homogeneous by definition and there are areas of higher proliferation adjacent to areas of decreased proliferation. Therefore, the limitation of such method is that the exact site of image capture is completely at discretion of the operator. We tried to overcome this problem with a strict blinding process in which the person (RR) obtaining the image and assigning a random
55 identification number was different from the person (DB) counting the cells.
56
7.0 CONCLUSION
The present study confirms that MCM7 is an excellent prognostic marker in cutaneous MCTs. The performance of MCM7 expressed as area under the curve in the ROC curve or as hazard ratio in the multivariable Cox regression analysis is the same in Patnaik intermediate grade MCTs as it is including all three histological grades. This is the main difference with Ki67 that is an excellent test when used to divide the Patnaik intermediate grade in two categories with different prognosis, but does not perform as well when applied to all three histological grades.
Another interesting finding of this study is that MI, Ki67 and MCM7 are independent prognostic markers and therefore it would make sense to combine them to improve their individual prognostic value. Unfortunately in this study cases with high Kiupel grade overlapped entirely with cases with high mitotic index and therefore we could not evaluate the new grading system independently.
In general, the mitotic index is a good test characterised by very high specificity, but lacks of sensitivity in detecting intermediate grade MCT with poor prognosis. Most commercial laboratories offer routinely MI and Kiupel histologic grade as it can be performed from HE sections at no additional cost. Our results suggest that dogs with increased MI or high Kiupel grade have a worse prognosis warranting further staging and probably further treatment. For cases with intermediate Patnaik grade, low Kiupel grade and low mitotic index, we recommend performing either Ki67, MCM7, or better both. Ki67 or MCM7 are equally good and there is no reason to suggest one over the other if they are done individually. However, the combination of the two increasing the individual threshold value allows obtaining a better test characterised by a very good sensitivity (83%) and an excellent specificity (93%).
57
BIBLIOGRAPHY
1. Bostock, D.E., Neoplasms of the skin and subcutaneous tissues in dogs and cats. Br Vet J, 1986. 142(1): p. 1-19.
2. Finnie, J.W. and D.E. Bostock, Skin neoplasia in dogs. Aust Vet J, 1979. 55(12): p. 602-4.
3. London, C.A. and B. Seguin, Mast cell tumors in the dog. Vet Clin North Am Small Anim Pract, 2003. 33(3): p. 473-89, v.
4. Gieger, T.L., N.C. Northrup, and M. Wall, Clinical management of mast cell tumors in
dogs. Compend Contin Educ Pract Vet, 2005. 27(1).
5. Withrow, S.J. and D.M. Vail, Small Animal Clinical Oncology. 2007, St. Louis, Missouri: Saunders Elsevier.
6. Ma, Y., et al., Clustering of activating mutations in c-KIT's juxtamembrane coding
region in canine mast cell neoplasms. J Invest Dermatol, 1999. 112(2): p. 165-70.
7. London, C.A., et al., Spontaneous canine mast cell tumors express tandem
duplications in the proto-oncogene c-kit. Exp Hematol, 1999. 27(4): p. 689-97.
8. Letard, S., et al., Gain-of-function mutations in the extracellular domain of KIT are
common in canine mast cell tumors. Mol Cancer Res, 2008. 6(7): p. 1137-45.
9. Zemke, D., B. Yamini, and V. Yuzbasiyan-Gurkan, Mutations in the juxtamembrane
domain of c-KIT are associated with higher grade mast cell tumors in dogs. Vet
Pathol, 2002. 39(5): p. 529-35.
10. Downing, S., et al., Prevalence and importance of internal tandem duplications in
exons 11 and 12 of c-kit in mast cell tumors of dogs. Am J Vet Res, 2002. 63(12): p.
1718-23.
11. Giantin, M., et al., c-KIT messenger RNA and protein expression and mutations in
canine cutaneous mast cell tumors: correlations with post-surgical prognosis. J Vet
Diagn Invest, 2012. 24(1): p. 116-26.
12. Webster, J.D., M. Kiupel, and V. Yuzbasiyan-Gurkan, Evaluation of the kinase
domain of c-KIT in canine cutaneous mast cell tumors. BMC Cancer, 2006. 6: p. 85.
13. Patnaik, A.K., W.J. Ehler, and E.G. MacEwen, Canine cutaneous mast cell tumor:
morphologic grading and survival time in 83 dogs. Vet Pathol, 1984. 21(5): p. 469-74.
14. Murphy, S., et al., Relationships between the histological grade of cutaneous mast cell
tumours in dogs, their survival and the efficacy of surgical resection. Veterinary
Record, 2004. 154(24): p. 743-6.
15. Meuten, D.J., Tumors in Domestic Animals. 4 ed. 2002, Ames, Iowa: Iowa State Press - Blackwell Publishing Professional.
16. Murphy, S., et al., Effects of stage and number of tumours on prognosis of dogs with
cutaneous mast cell tumours. Veterinary Record, 2006. 158(9): p. 287-91.
17. Mullins, M.N., et al., Evaluation of prognostic factors associated with outcome in
dogs with multiple cutaneous mast cell tumors treated with surgery with and without adjuvant treatment: 54 cases (1998-2004). J Am Vet Med Assoc, 2006. 228(1): p.
91-5.
18. Ishiguro, T., et al., Relationship of disease progression and plasma histamine
concentrations in 11 dogs with mast cell tumors. J Vet Intern Med, 2003. 17(2): p.