CHAPTER II
MODELS TO CALCULATE THE ELECTRIC AND OPTICAL PROPERTIES OF POLYMER DISPERSED CONDUCTIVE SILVER NANOPARTICLES
2.1 The theoretical model for electric conduction in nanoparticle/polymer composites.
The aim of this chapter is to give an overview of the theoretical model which have been developed to study the electric behavior of Polymer Dispersed Conductive Nanoparticles. The information reported in the following are in great measure taken from some excellent work appeared in literature on this argument [1-3].
Metal /polymer composite films have recently attracted more and more attention due to their great potential for electromagnetic functional materials and devices [4,5]. It is well known that the electrical conductivities of nano-metal films depend on microstructure dimensions [6-8].
Experimental results, concerning electric and optical properties in these materials have been interpreted in terms of Effective Medium Theories (EMT). Among these theoretical approaches very well know are Maxwell-Garnett (M-G) [9], Bruggeman [10], Sheng [11], Landau–Lifshitz/Looyenga (LLL) [12,13], and Monecke [14] models, which links the electric conductivity of the composite materials to the electric properties of the componetes and to their volume fractions.
A recent review of the potentiality of the potentiality of these models has been recently given in ref. [1] which concerns the investigation of the elctric conductivity of titanium nanoparticles layers The experimental data by ref.1 are here reported in fig.2.1.
Fig. 2.1 Dependence of the DC conductivity from the thickness of the titanium film[1]
The dc conductivity of the nano-titanium film increases with thickness until 37 nm. It increases abruptly when the film thickness is in the range of 5–20 nm, and remains relatively constant when the film thickness is above 37 nm. A marked decrease by many orders of magnitude is seen as the film thickness is reduced below 3.5 nm, which can be regarded as a percolation threshold for the nano-titanium films on dc conductivity in this work. The authors of Ref.[1] take in account the mechanisms suggested by Mantese and coworkers [15,16], to conclude that electrical conduction, in their investigated system, is dominated by charge transport along the backbone of the continuum with worm-like inclusions [17,18] when the film thickness was thicker than 3.5 nm. Instead, when the film thickness was under 3.5 nm they hypothesized that electrical conduction occurs by thermally assisted charge tunneling [17,18].
The dependence of DC conductivity on thickness of nano-titanium films was than explained in term of EMT models [9-14].
One of the special merit of the above mentioned paper is that it presents in a very synthetic and clear way all the EMT models.
M-G model
This model is based on the assumption that the underlying microstructure of the porous material can be reasonably described by coated spheres. For a two component
composite material, one is called host and the other is called guest. If isotropy of grains is assumed here, the effective dielectric function for the M-G model is:
(1)
where ε1 and ε2 are the dielectric function of host and guest, and k corresponds to the volume fraction of guest in the effective medium.
Bruggeman model
Unlike the M-G model, both host and guest materials are treated symmetrically in the Bruggeman model. The effective dielectric function for this model is given by:
(2)
Sheng model
Like the Bruggeman model, the component materials are treated symmetrically in the Sheng model. The effective dielectric function is obtained by solving:
(3)
Where
LLL model
Landau and Lifshitz, and Looyenga derived the theory independently. In this model, a random, homogeneous and isotropic mixture of two or more materials is assumed. For two components with dielectric functions ε1 and ε2 and the volume fraction of component 2 called k2, LLL model can be given as
(4)
Monecke model
The model is not based on a physical topology, but on an interpolation between the extreme limits of the mixture. It can be given by:
(5)
The dependence of effective dielectric function on volume fraction can be transformed into the dependence of effective dc conductivity on volume fraction. The new formulas for the five models are shown below:
(6)
Calculation performed in ref. 1 gave the conductivities as a function of the volume fraction of metal across the film thickness , according to fig. 2.2.
Fig. 2.2 dependence of the effective DC conductivity from the metal volume fraction ( Ref.1 )
All models predict the improvement of effective DC conductivity as the volume fraction of metal is increased, but their behaviors are different. For low fill fractions, the predictions are nearly identical, since there is a little topological distinction among these descriptions. The M-G model gives better agreement with experimental data than the others, especially when volume fraction of metal is not more than 0.4, but the model cannot predict the percolation threshold. The Sheng model is better when the volume fraction is more than 0.7. The Bruggeman and Sheng models predict the percolation threshold, which to some extent agrees with the experimental data. However, neither one gives a complete description of the experimental results. The other two models give a poor match with the experimental data. It should be mentioned that the distribution of particle size and the different conductivities for different particles were ignored in the simulation. Moreover, the size of nano-titanium grains increase during the film growth, which was also ignored. These simplifications lead to the deviation of theoretical predictions from experimental data. In the five EMT models, an isotropic composite is considered as a dielectric matrix (the host) with embedded spherical particles (the guest). Since, the shapes of the nano-metal grains transform during the film growth, and they can be anisotropic, two extreme limits of deviation from spheres, which are modeled aseither ellipsoids or cylinders, should be considered. This approach covers all possible degrees of anisotropy.
2.2 Optical properties of nanoparticle/polymer composites.
Nanoparticles/polymer composites are important not only with respect to the possibility to confer the typical electric properties of metals to plastic coatings , but also to design optical properties having special properties with respect to reflection absorption or scattering of given spectral components of the RF field.
When designing optical coatings, it is vital to have accurate models of their optical properties. Nanoparticle-based coatings can be optimized for specific applications by modifying their particle size, shape, volume fraction, microstructure, etc. Because the optics of nanoparticles is a complex subject, different classes of models are needed in different situations. Comprehensive set of working models for submicron particles embedded in supporting media have been developed [19-21] for metal-insulator composite solar absorbing coatings, nano structured transparent conductors, pigmented polymers, and paint coatings. Figure fig 2.1 gives a qualitative picture of regions of validity for three different nanoparticle-optics models.
Fig.2.1 A qualitative picture of regions of validity for three different nanoparticle-optics models.
These model can be classified according to the following definitions:
1) the effective-medium region, where the system can be treated in terms of EMT theories described above;
2) the independent-scattering region, were the coating material is characterized by effective scattering and absorption coefficients that are obtained by summing up the contributions from each particle. This approximation is restricted to dilute media, so each particle scatters light independently of the others.
3) The dependent scattering region.
For larger particles, both scattering and absorption are important, and multiple scattering must be taken into account. [22]
The third region lies between the two extremes. In dense media, dependent scattering effects become important[23]. In this case, a full solution of Maxwell’s equations for the appropriate structure is necessary. Effective-medium theories (EMT) can be used for visible light when the particle size is roughly 10–20nm or smaller. More rigorous limits of validity can be obtained for specific material combinations and wavelength ranges by computations [2]. One conceptual problem is that no unique solution exists because the EMTs are sensitively-dependent on the detailed arrangement of the nanoparticles. EMTs developed for simple model microstructures provide good approximations in many cases. The two most common are the Maxwell-Garnett model for particles randomly embedded in a homogeneous matrix material, and the Bruggeman model for a random mixture of two kinds of particles [21, 22]. These cases often provide good working models for applied work. Fractal particle aggregates are special cases that can be treated by electrical-impedance-network analogues [24].
The two-dimensional problem of particles sitting on a substrate surface is more difficult because interactions with image charges in the substrate cannot be ignored. However, the problem has been treated in excellent work by the Leyden group[25].
Dependent scattering occurs when the distance between adjacent particles is less than about 0.3 times the wavelength[23]. This occurs for homogeneously-distributed particles at high volume fractions, as shown in Figure 2.1. Dependent scattering models are also needed when nanoparticles stick to one another and form large aggregates. In this case we must find rigorous solutions for the electromagnetic field that take into account interference between fields scattered by different particles. Many numerical techniques have been developed and calculations for model structures containing several hundred particles are today common. A number of pieces of computer code to do this are publicly available.
Composites materials, consisting of polymers with embedded nanostructured metallic particles exhibit generally unique optical characteristics originating from the strong interaction between incident light and metallic nanoparticles. This interaction results in collective oscillations of electron clouds, so called surface plasmons, at the
interface of the metallic nanoparticles and the dielectric matrix. The resonance frequency of this interaction is strongly dependent on the metal, the surrounding dielectric medium, as well as the size and shape distribution of the nanoparticles.
The light-spectrum of spherical metal nanoparticles in dielectric media can be modeled by using the electromagnetic Mie theory[26], according to which the extinction cross-section is given by:
2 (2 1)Re( ) 1 2 L L L ext L a b k , with: (7)
were k is the wave vector, L is order of spherical multipole excitation in particle. For example L 1 correspond to dipole; L 2 correspond to quadrupole, etc.
aL, bL are the Mie coefficients express through the cylindrical Riccati-Bessel functions ψL
and ηL with arguments mx and x, (
polym er A g
mx is the optical metal to polymer
dielectric constants ratio; x kR, where Ris the radius of nanoparticle ).
A remarkable example of application of these concepts can be fond in the ref.[2] of this chapter. Where a composite of silver nanoparticles in polytetrafluoroethylene (PTFE) obtained by Physical Vapor Deposition ( PVD ) and more precisely by cosputtering from to magnetron sources, has been investigated. The morphology of a polymer/metal composite with a filling factor below the percolation threshold is shown in the TEM image in Fig. 2.3
) ( ) ( ) ( ) ( ) ( ) ( x mx mx m x mx x mx m a L L L L L L L L L ) ( ) ( ) ( ) ( ) ( ) ( x mx m mx x mx m x mx b L L L L L L L L L
Fig.2.3. TEM micrograph of a silver-PTFE nanocomposite ( f_0.2) prepared by co-sputtering from two magnetron sources.
The clusters have a size between 5 and 10 nm. They are spherical and are separated from each other. The electrical properties changed with the filling factor from a polymer-like to a metal-like material. Thereby, the transition is sharp and occurs in a relatively narrow range near the percolation threshold, where a path of percolated particles is formed through the material for the first time. The resistivity changes over several orders of magnitude for a change in the amount of metal of only a few percent. The Plasmon resonance and value of the resistivity is shown in fig.2.4
Fig. 2.4 Change of the resistivity (solid squares) and plasmon resonance wavelength (open circles) with the filling factor.
A resistivity drop from values around 5 M Ohmxcm_ to 5_mOhm xcm. The percolation threshold was located at a filling factor of f= 0.35. This is in agreement with other works. For example, a theoretical approach for spherical clusters gives the percolation threshold with f _0.29 [27]. In experiments with gold nanoclusters in different polymer matrices the percolation threshold was found at f_0.43 (Teflon AF) and f= 0.20 (Poly(a-methylstyrene)) [28].
The optical properties were also studied as a function of the filling factor. Even films with a thickness of a few nanometers had an intensive yellow color. This color effect is based upon the surface plasmon resonance. For silver and other noble metal
particles in polymers the Plasmon resonance frequencies are in the visible range. The position of the absorption maximum depends on the cluster morphology like size, shape, and particle distance as well as on the matrix material. The absorption maxima for small filling factors should be found theoretically between 350 and 420 nm depending on the surrounding dielectric matrix [14]. We observed a red shift of the absorption maximum from 405 nm for small filling factors to more than 500 nm for filling factors above the percolation threshold.
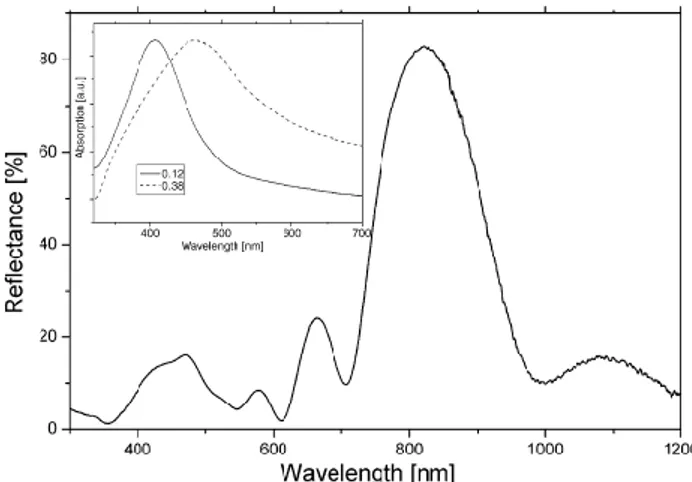
Fig. 2.5 Optical properties: UV–Vis reflectance spectrum of Bragg multilayer system with five polymer/composite double layers; inset: UV–Vis example spectra for two different filling factors with absorption peaks due to the plasmon resonance.
Near the percolation a stronger dependence of the resonance frequency on the filling factor was observed. With increasing metal concentration inside the composite film near the percolation threshold the gaps between single clusters become smaller and the cluster size and shape can also change due to coalescence of the particles. The resulting significant red shift of the absorption maximum is in good agreement with theoretical models [29]. The changes in
the resistivity and the shift of the plasmon resonance with the filling factor is shown in Fig. 2.4. Representative spectra for two different filling factors are given in the inset of Fig. 2.5
Temperature dependence of PDMNP films conductivity may valuable details of the transport mechanism as a reliable example of this possibility we report here the study of ref. [3]
In this paper the author reported on temperature dependent electrical transport and optical properties of porous thin films consisting of ITO nanoparticles produced by a wet-chemical method. The films were spin coated from a dispersion of ITO nanoparticles with a narrow size distribution. In a practical application, the dispersion would be printed directly onto the substrate to produce fine-patterned structures. However, in this work large area depositions were preferred in order to enable analyses of the optical and electrical properties of the nanoparticle films.
ITO nanoparticles with a tin to indium atomic ratio of 5% were produced by a commercial wet-chemical method (Nanogate GmbH ). The primary particle diameter size was 16nm as measured by a laser back scattering method using a LECOTRAC LTU-150 Ultrafine Particle Size Analyzer. Thin films were produced by spin coating a dispersion of the
ITO nanoparticles onto glass substrates. The film thickness, measured by a Dektak 3030 mechanical stylus profilometer, was found to be 1.1 mm.
Temperature dependent electrical transport in semiconductor materials is a complex property, whose reconciliation with theory demands a detailed knowledge of the local electronic structure. A theoretical modeling is also made difficult by the fact that there are several different transport mechanisms exhibiting a negative temperature coefficient of the resistivity; among these one finds tunneling and hopping conduction. Hopping conduction can be represented by an exponential temperature dependent resistivity r (t) of the form [30]
(8)
where B1 , B2 , and q are constants. A conduction mechanism dominated by hopping between localized states distributed randomly in the film yields a temperature dependence as described by Eq. (8) with q=4 [30]. Another hopping conduction mechanism, characterized by q=1, is representative of localized states distributed in a periodic array ( i.e., nearest neighbor hopping, NNH ) [30] The granular-metal system is characterized by a distribution of small metallic grains separated by thin insulating
layers. In such systems, the resistivity is governed by a charging energy Ec , which is inversely proportional to a capacitance C, i.e.,
(9)
where h is a constant and e is the electronic charge. A small particle size gives a small capacitance, which results in a large Ec . Then (t) is dominated by electrons hopping between the metal grains. The corresponding granular-metal model (GM) is given by Eq. ( 8) with q=2 [30]. A different temperature dependent resistivity appears if the metallic regions can be regarded as large internally connected clusters separated by thin insulating layers. This yields a much higher total capacitance, which results in Ec being negligible compared to the thermal energy kBt, where kB is Boltzmann’s constant. In such samples the resistivity is dominated by fluctuation induced tunneling between the metallic regions, and (t) is given by [31]
(10)
where B3 is a constant and t0 and t1 are related to the properties of the insulating barriers between the metallic clusters and obtained from [32]
and
Here A is the barrier area, V0 is the barrier height, m is the charge carrier mass, w is the width of the barrier, 0 is the permittivity for free space.
Ionized impurities are an important source of scattering in doped semiconductors. If this scattering dominates, the TCR is negative and the temperature dependent drift mobility is given by[33]
In a heavily doped degenerate semiconductor, the temperature dependent charge carrier concentration due to intrinsic carriers is negligible because of the high doping level. Thus the temperature dependence of (T) is given by (T), so that
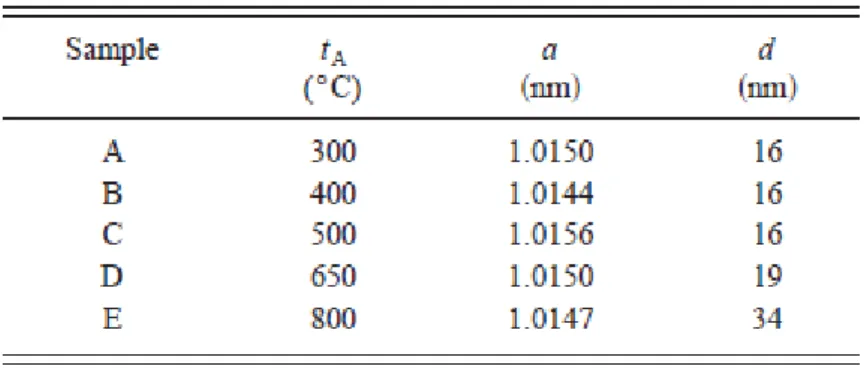
The investigated films were those reported in tab.2.1
Tab.2.1 Sample data showing annealing temperature tA for treatment at 1 h in air and 1 h in N2 , lattice parameter a, and mean grain size d.
The experimental as well as the calculated resistivities are reported in the fig. 2.6
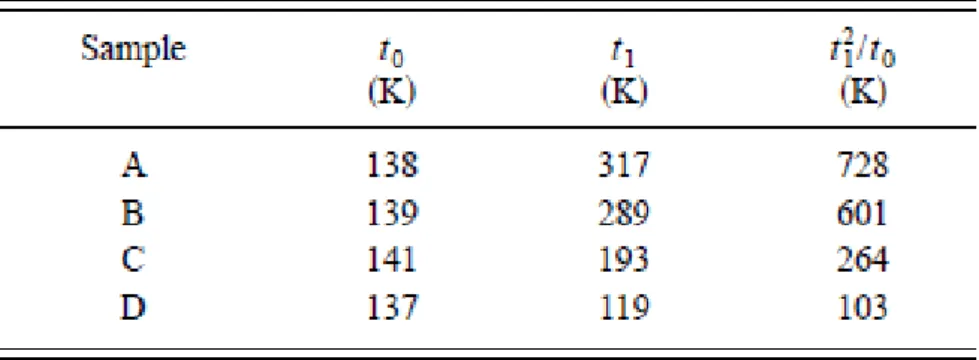
Fig. 6. Normalized resistivity versus temperature t for samples A–D characterized in Table I. Experimental data are shown together with computations from the fluctuation induced tunneling model Eq. (10 )using the fitting parameters in Table II.
The experimental resistivity data for samples A–D are compared to data obtained from the fluctuation induced tunneling model in Fig. 6. Good agreement is observed for all samples in the whole temperature range. The fitting parameters, i.e., t0 and t1 , are given in Table II.
TABLE II. Data for the fitting parameters t0 and t1 in the fluctuation induced tunneling model; see Eq (10)
REFERENCES
[1] Hao Du, Huang Chenb, Jun Gong, Tie Gang Wang, Chao Sun, Soo Wohn Lee, Li Shi Wen, “microstructure on dc conductivity of nano-titanium films”,
Applied Surface Science, 233 (2004) 9 9–104
[2] Ulrich Schu¨rmann, Haile Takele, Vladimir Zaporojtchenko, Franz Faupel, “Optical and electrical properties of polymer metal nanocomposites prepared by magnetron co-sputtering” Thin Solid Films 515 (2006) 801 – 804
[3] J. Ederth, P. Johnsson, G. A. Niklasson, A. Hoel, A. Hultaker, P. Heszler, and C. G. Granqvist, A. R. van Doorn and M. J. Jongerius, D. Burgard, “Electrical and optical properties of thin films consisting of tin-doped indium oxide nanoparticles”, PHYSICAL REVIEW B 68, 155410 (2003)
[4] M. Scalora, M.J. Bloemer, A.S. Pethel, J.P. Dowling, C.M. Bowden, A.S. Manka, J. Appl. Phys. 83 (1998) 2377.
[5] J.S. Sheng, J.T. Lue, Appl. Opt. 31 (1992) 6117.
[6] Z.L. Tang, R.F. Huang, L.S. Wen, Acta Metall. Sin., 32 (1996) 308.
[7] X.H. Cao, Z.L. Tang, R.F. Huang, L.S. Wen, Acta Metall. Sin., 32 (1996) 405. [8] Z.L. Tang, R.F. Huang, L.S. Wen, Chin. J. Mater. Res. 11 (1997) 438.
[9] J.C. Maxwell Garnett, Philos. Trans. R. Soc. London, Ser. A, 203 (1904) 385. [10] D.A.G. Bruggeman, Ann. Phys. 24 (1935) 636.
[11] P. Sheng, Phys. Rev. Lett. 45 (1980) 60.
[12] L.D. Landau, E.M. Lifshitz, Electrodynamics of Continuous Media, 2nd ed., Butterworths/Heinenann, Oxford, 1982, p. 42. [13] H. Looyenga, Physica 31 (1965) 401.
[14] J. Monecke, J. Phys. Condens. Matter 6 (1994) 907.
[15] J.V. Mantese, W.A. Curtin, W.W. Webb, Phys. Rev. B 33, (1986) 7897. [16] J.V. Mantese, W.W. Webb, Phys. Rev. Lett. 55 (1985) 2212.
[17] B. Abeles, P. Sheng, M.D. Coutts, Y. Arie, Adv. Phys. 24, (1975) 407. [18] B. Abeles, Appl. Solid State Sci. 6 (1976) 1.
[19] G.A.Niklasson, SPIE—The International Society for Optical Engineering,2006 [20] H. Xu, E. J. Bjerneld, M. K¨all, and L. B¨ orjesson,, Spectroscopy of Single Hemoglobin Molecules by Surface Enhanced Raman Scattering, Phys. Rev. Lett. 83, pp. 4357–4360, 1999.
[21] G. A. Niklasson and C. G. Granqvist, Optical properties and solar selectivity of coevaporated Co-Al2O3 composite films, J. Appl. Phys. 55, pp. 3382–3410, 1984. [22] G. A. Niklasson, Optical properties of inhomogeneous two-component materials, in C. G. Granqvist ed., Materials science for solar energy conversion systems, pp. 7– 43, Pergamon, Oxford, 1991.
[23] C. L. Tien and B. L. Drolen, Thermal radiation in particulate media with dependent and independent scattering, in T. C. Chawla ed., Annual review of numerical fluid
mechanics and heat transfer 1, pp. 1–32, Hemisphere, New York, 1987.
[24] J. A. Sotelo, V. N. Pustovit, and G. A. Niklasson, Optical constants of gold blacks: Fractal network models and experimental data, Phys. Rev. B 65, p. 245113, 2002.
[25] D. Bedeaux and J. Vlieger, Optical properties of surfaces,World Scientific, London, 2001.
[26] Mie G. , Ann. Phys. 1908. Vol. 25. P. 377-422.
[27] E.J. Garboczi, K.A. Snyder, J.F. Douglas, M.F. Thorpe, Phys. Rev., E 52 (1) (1995) 819.
[28] H. Takele, U. Schu¨rmann, V. Zaporojtchenko, F. Faupel, accepted for publication in Europ. Journ. Phys.
[29] U. Kreibig, M. Vollmer, Optical Properties of Metal Clusters, Springer Berlin, 1995.
[30] N. Mott, Metal-Insulator Transitions Taylor and Francis, London, (1990). [31] P. Sheng, Phys. Rev. B 21, 2180 (1980).
[32] Z. H. Wang, M. S. Dresselhaus, G. Dresselhaus, K. A. Wang, and P. C. Eklund, Phys. Rev. B 49, 15 890 -1994.
[33] B. R. Nag, Electron Transport in Compound Semiconductors ( Springer, Berlin, 1980), Vol. 11.
![Fig. 2.1 Dependence of the DC conductivity from the thickness of the titanium film[1]](https://thumb-eu.123doks.com/thumbv2/123dokorg/2877134.9997/2.892.345.654.110.424/fig-dependence-dc-conductivity-thickness-titanium-film.webp)