Materials and Methods
3.1 Description
The aim of the present paragraph is to describe the materials and methods adopted for the experimental investigation of the mechanical properties of masonry components. This experimental campaign were carried out at the Central Direction for Prevention and Technical Safety - Passive Protection Area of the National Fire Corps, with the aim to implement the EN 1996-1-2 [1] issues at national level.
The mechanical behavior of the main materials used for blocks and mortar joints are investigated, measuring the variation of compressive strength and deformation properties depending on the temperature. The tests were performed on cylindrical specimens, on a set of temperatures between 20°C and 700°C. The compressive strength, the ultimate strain (in absence of preload), the free thermal strain and the
equivalent Young modulus were measured for each test, in comparison with results obtained from tests carried out at room temperature (20°C). As mentioned in the introduction to this dissertation, possible variations of resistance and ultimate strain at high temperatures due to the preload were then not investigated. The experimental campaign concerned about two hundred cylindrical specimens with a diameter of 100 mm and a height 200 mm, according to EN 12390-1 [35] but unlike specified to RILEM recommendations [36, 37, 38, 39, 40], which indicates the use of more slender samples with a maximum diameter/height ratio of 1:3 for ordinary concrete.
Three typologies of test, described in the following paragraphs, were performed:
TEST 1 – CMC (Cold Mechanical Characterization – cold/loading condition);
TEST 2 – TCTP (Thermal Characterization of the Transient Phase – hot/unloading condition);
TEST 3 – HMC (Hot Mechanical Characterization – hot/loading condition);
Materials of the following typologies were tested:
Clay (CLAY);
Aerated autoclaved concrete (AAC);
Lightweight concrete (LWC);
Façade lightweight concrete (LWC-FV);
Hydraulic lime mortar with cement, classes M5 and M10 (EN 998-2 [41] and EN 1015-11 [4998-2] classification).
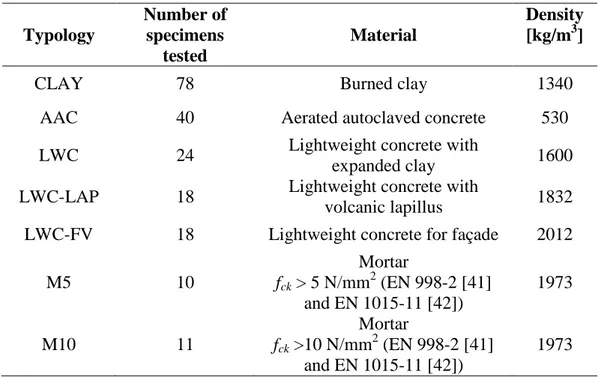
The storage conditions and the number of the specimens for each tested material are summarized in Table 3.1.
Typology Number of specimens tested Material Density [kg/m3]
CLAY 78 Burned clay 1340
AAC 40 Aerated autoclaved concrete 530
LWC 24 Lightweight concrete with
expanded clay 1600
LWC-LAP 18 Lightweight concrete with
volcanic lapillus 1832
LWC-FV 18 Lightweight concrete for façade 2012
M5 10 Mortar fck > 5 N/mm2 (EN 998-2 [41] and EN 1015-11 [42]) 1973 M10 11 Mortar fck >10 N/mm2 (EN 998-2 [41] and EN 1015-11 [42]) 1973
Tab. 3.1. Storage conditions of cylindrical specimens.
The CLAY material chosen for the investigation is used for the most common blocks found as in the Italian market. It consists for 96% of ordinary clay with the addition of 4% of mud of paper as lightening element that amplifies the thermal insulating properties. The maximum firing temperature reached for the manufacture of the blocks is about 950°C.
The AAC material tested is mainly used for loadbearing masonry blocks with maximum size of about 600×250×400 mm. The raw components for one cubic meter of this standard material with a density of 530 kg/m³ are 67% of sand, 19% of cement, 10% of hydrated lime and 4% of anhydrite.
Three types of lightweight concrete with expanded clay aggregates were tested. The mix adopted for LWC included 16.7% of Portland cement, 45.8% of expanded clay with an average size less than 2 mm (12.5%) and equal to 2÷4 mm (33.3%), 33.3% of sand (average diameter less than 3mm) and 4.2% of gravels of 3÷5 mm.
In LWC-LAP material, volcanic lapillus with a density of 0.97 g/cm3 was used as aggregates with an average diameter of 5÷8 mm. The weight percentages of the components were 12% of Portland cement, 85% of lapillus aggregates and 3% of expanded clay gravels (average diameter of 3÷8 mm). Instead, the components of the mix adopted for the LWC-FV material included the same quantity of Portland cement (12%), 9% of expanded clay gravels with an average diameter of 2÷4 mm (4%) and 3÷8 mm (5%), and 79% of limestone aggregates.
Finally, for the realization of the samples of mortar M5 were used 14% of cement, 14% of hydraulic lime and 72% of sand, while for those of mortar M10 the percentages of the same raw components were respectively 18%, 9% and 73%. All samples were checked so that they were without defects (chips, cracks, etc.) and had passed a dimensional and base-flatness control.
3.2 Experimental campaign
The campaign provided firstly the experimental determination of mechanical properties of various materials at room temperature; for this purpose, a test procedure, called Cold Mechanical Characterization (TEST 1 – CMC), was
developed, with the aim to reach an accuracy comparable to those guaranteed by the EN 771 [43, 44, 45] and EN 998-2 [41].
In order to determine the mechanical properties at high temperatures, in absence of pre-loads, it was necessary to evaluate the amount of temperature variations within samples volume. For this reason, a second preliminary test procedure was developed, called Thermal Characterization of the Transient Phase (TEST 2 – TCTP).
Finally, the tests that led to the effective determination of mechanical properties at high temperatures were carried out according to the methodology defined as Hot Mechanical Characterization (TEST 3 – HMC). In the next paragraphs the specifications of these three test procedures are described.
3.2.1 Test procedure for the Cold Mechanical Characterization (TEST 1 – CMC)
The TEST 1 – CMC consisted of subjecting the samples to a compression test carried out at room temperature and normal humidity condition. This was achieved by applying an increasing quasi-static compression load by metal plates until failure, reading the corresponding ultimate deformation. The instrumentation used consisted of:
- a hydraulic loading machine, controlling displacement by a unit connected to a computer with recording software;
- an electronic signal converter taking the average of signals from the LVDTs. The output signal (average of the three LVDTs) was sent to the control of the loading machine;
- a signal generator connected to the signal converter, in order to power the LVDTs.
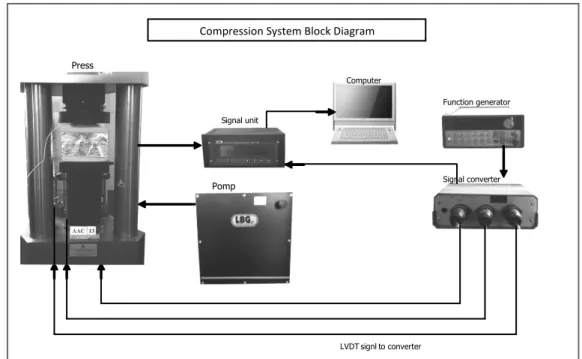
The flow diagram of Figure 3.1a illustrates the set of instruments used for TEST 1 – CMC.
The press used was a machine for uniaxial load of LBG Ltd® C300 model with option of tension-compression (up to 3000 kN for compression testing of cylindrical and cubic specimens and up to 2000 kN for bending testing of the joists). The accuracy thus obtained was ± 1% and repeatability of 1%.
The piston stroke of the press was monitored using three LVDTs (of HBM WSF® series), endowed of a piston with spring return, extension up to 20mm and sensitivity 10% ± 15 mV/V.
The signal converter was designed to adapt and mediate signals from LVDTs at the entrance of the unit. This system has allowed to monitor in real-time screen the deformation behavior of the specimen.
It was necessary to use a function generator Agilent 33120A® to power the transducers which required a sinusoidal voltage of frequency equal to 5 kHz and an amplification of 7.2 ppV.
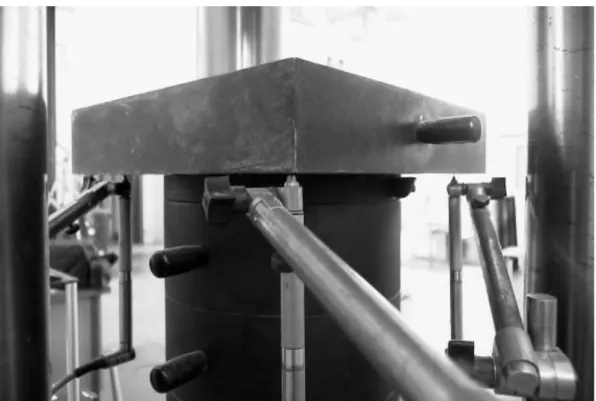
The acquisition of the LVDTs displacements required by the system was properly calibrated before the tests; subsequently we proceeded with the placement of the
three LVDTs, as shown in Figure 3.1b, so that they found themselves completely pressed against the lower plate of the machine.
The configuration parameters of the press were:
impact threshold: pump motor during preload equal to 10% rpm;
load limit of 500 kN;
stroke limit of 10 mm;
threshold automatic stop at rupture corresponding to 90% of the maximum load from 5% of limit load.
LVDT signl to converter Signal converter Function generator Computer Signal unit Pomp Press
Compression System Block Diagram
Fig. 3.1b: Application of the three LVDT transducers.
The tests were organized with a preload of 1÷3 kN, for the adaptation of the plates to the samples, followed by the effective test; RILEM procedure [37] provided a lower value of preload (≤0.05 MPa) and the application of three loading-unloading cycles before the effective test execution.
At the failure of each sample, the loading program was automatically stopped. The specimens were loaded at a loading rate of 0.5 MPa/s, measured with a precision of ±1%, according to RILEM standards [37, 38] for the determination of the compressive strength and the stress-strain relation for ordinary concrete subjected to high temperatures.
3.2.2 Test procedure for the Thermal Characterization of the Transient Phase (TEST 2 – TCTP)
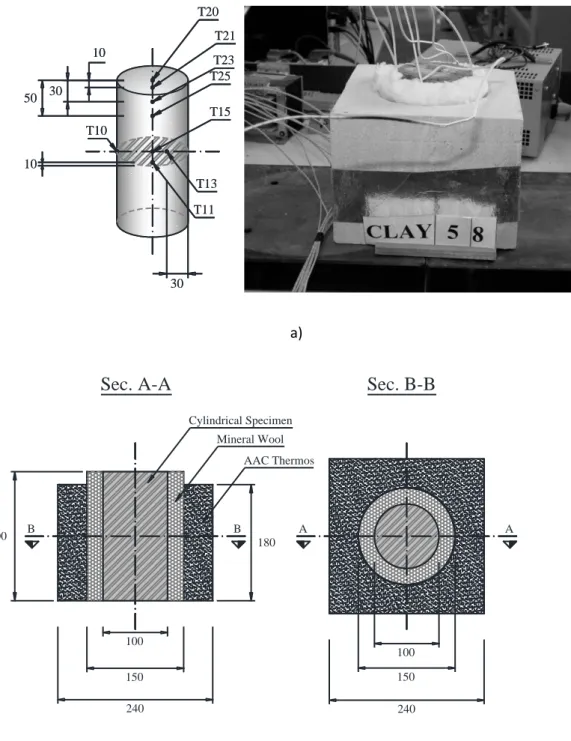
The Thermal Characterization of the Transient Phase (TEST 2 – TCTP) was performed for the monitoring of temperatures in eight points of the test samples, where the thermocouples were applied according to the scheme shown in Figure 3.2a.
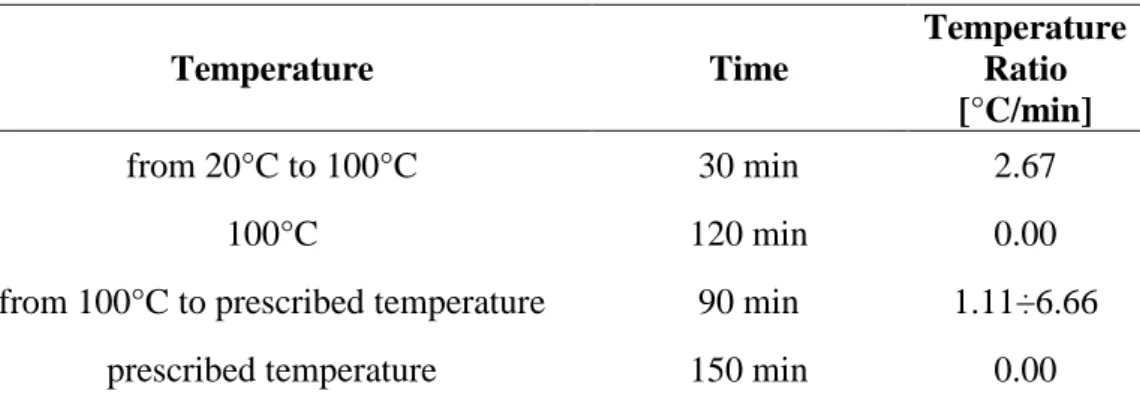
The samples, after being coated with mineral wool, were placed in a muffle furnace, subjected to the predetermined heating program of Table 3.2 and then, once they reached an almost uniform temperature distribution inside them, were extracted and inserted in a “thermos” made of AAC and pre-heated at 200°C to minimize the heat loss (Figure 3.2b).
Temperature Time Temperature Ratio [°C/min] from 20°C to 100°C 30 min 2.67 100°C 120 min 0.00
from 100°C to prescribed temperature 90 min 1.11÷6.66
prescribed temperature 150 min 0.00
Tab. 3.2: Time history of heating program for specimens.
The reduction in temperature has been recorded for at least 3 minutes from the time of the extraction of samples from the furnace, in order to have the information to update or modify, if necessary, the data from the Hot Mechanical Characterization (TEST 3 – HMC) tests.
10 50 30 30 T20 T21 T23 T25 T13 T11 T10 10 T15 10 50 10 30 30 T20 T21 T23 T25 T13 T11 T10 T15 a) B B A A
Sec. A-A Sec. B-B
100 150 240 100 150 240 180 200 Cylindrical Specimen Mineral Wool AAC Thermos b)
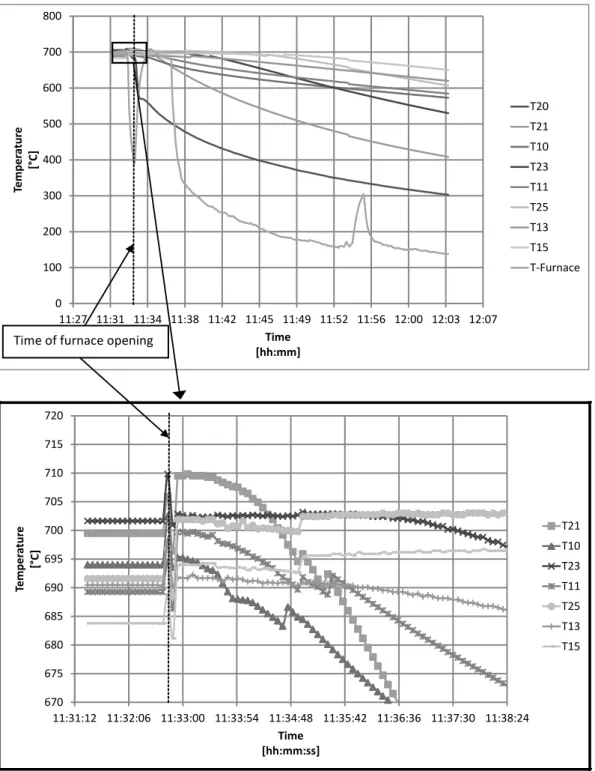
For example, the temperature curves obtained after a TEST 2 – TCTP at 700°C on a sample of clay are shown in Figure 3.3.
By observing the diagrams of TEST 2 – TCTP of each sample, for brevity omitted in this dissertation, it was inferred that the mineral wool cover around the sample, plus the above pre-heated thermos, limited the heat loss in the sample in a short period (about 3 min) sufficiently to run the TEST 3 – HMC. In fact the maximum reduction in temperature recorded in the TEST 2 – TCTP was about 5% on the lateral surface of the samples; therefore, it had a negligible influence on the results of the TEST 3 – HMC.
The TEST 2 – TCTP allows to obtain more detailed results about the thermal mapping of the samples respect to the RILEM recommendations [37, 38, 39], which however would have predicted a different standard heating program based on a first phase with a constant gradient of 1°C/min up to the prescribed maximum temperature and a second steady phase of 60 ± 5 minutes.
3.2.3 Test procedure for the Hot Mechanical Characterization (TEST 3 – HMC)
The Hot Mechanical Characterization (TEST 3 – HMC) consisted of a compression test after the preset heating program of Table 3.2. As for the TEST 1 – CMC, samples of the same material, on which the TEST 3 – HMC was carried out at a fixed temperature, were taken.
0 100 200 300 400 500 600 700 800 11:27 11:31 11:34 11:38 11:42 11:45 11:49 11:52 11:56 12:00 12:03 12:07 Temper at ur e [° C] Time [hh:mm] T20 T21 T10 T23 T11 T25 T13 T15 T-Furnace 670 675 680 685 690 695 700 705 710 715 720 11:31:12 11:32:06 11:33:00 11:33:54 11:34:48 11:35:42 11:36:36 11:37:30 11:38:24 Temper atu re [° C] Time [hh:mm:ss] T21 T10 T23 T11 T25 T13 T15
Time of furnace opening
These samples were subjected to the same preliminary checks described previously, after which they were instrumented with a thermocouple application. Indeed, the preliminary execution of TEST 2 – TCTP permitted the use of a single thermocouple for each sample, unlike the three ones required from RILEM recommendations [37, 38, 39, 40].
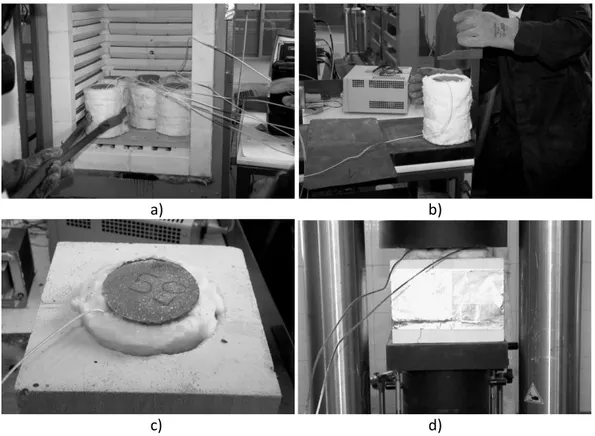
The main phases of the TEST 3 – HMC procedure were (Figure 3.4):
positioning the samples in the furnace with heating program by TEST 2 – TCTP;
extraction of the sample from the furnace;
measurement of the sample height with centesimal gauge (1/100 mm accuracy);
inserting of the specimen into the pre-heated thermos;
sample placement in the press and the compression test running as for TEST 1 – CMC.
The data recorded from this test allowed the calculation, for each sample, of the free thermal strain εth, the coefficient of linear expansion ath, the compressive
strength fc and the ultimate strain εcu0.
The apparent moduli of elasticity Eb (blocks) and Em (mortar) tangent-secant to
the stress-strain curve, for values corresponding to about 40% of the strength fc for
a) b)
c) d)
Figure 3.4: Main phases of the TEST 3 – HMC procedure: a) extraction from furnace; b) height measurement with centesimal gauge; c) inserting of specimen in the thermos; d) compression test execution.