Università Politecnica delle Marche
Scuola di Dottorato di Ricerca in Scienze dell’Ingegneria Corso di Dottorato in Ingegneria Industriale
---
Trace Metals and Dissolved Organic Carbon in Biochar
Varying with Feedstock Type and Pyrolysis Temperature
Ph.D. Dissertation of:
Enrico Mancinelli
Supervisor:Prof. Giorgio Passerini
Assistant Supervisor:
Prof. Edita Baltrėnaitė
Ph.D. Course coordinator:
Prof. Ferruccio Mandorli
XVI edition - new series
Acknowledgements
To Prof. Edita Baltrenaite and Prof. Giorgio Passerini, for shedding light on the PhD march. To the contributions of the Professors, Researchers and PhD students of the Institute of Environmental Protection and the Department of Environmental Protection of Vilnius Gediminas Technical University. The support provided by the Institute of Environmental Protection and the Department of Environmental Protection of Vilnius Gediminas Technical University is greatly acknowledged.
Dedication
This one, with gratitude, is for Franca, Patrizia, Franco, Lola, Olga
Abstract
The content of carbon in labile forms (e.g. dissolved organic carbon (DOC)) and potentially hazardous inorganic substances (e.g. trace metals) in biochar (BC) may limit or prevent the utilization of BC for environmental remediation purposes. BCs were produced from slow pyrolysis at different temperatures (i.e. 300, 450 and 700 °C) from different types of feedstock (i.e. wood chips (WC), lignin (LG), digested sewage sludge (DSS), and pine bark (PB)). Total trace metal (Cd, Cr, Cu, Ni, Pb, and Zn) concentration, leachability, and bioavailability were investigated in BCs from WC (BCWC), LG (BCLG), and DSS (BCDSS). DOC leachability from BCs was investigated via up-flow percolation test method. The most suitable pyrolysis temperature (450 or 700 °C) for reducing trace metal leachability and bioavailability depends on the trace metal considered. The temperature of 450 °C was effective in stabilizing Cr and Ni in the analyzed BCs as these trace metals were not prone to leaching or present in bioavailable forms. In the tested BCs, an increase in pyrolysis temperature made trace metals such as Zn and Cu more stable in the char matrix, decreasing in the bioavailable fractions, hindering leachability of Zn, and decreasing leachability of Cu to <1 % of the total Cu concentration. Trace metals such as Cd and Pb did not show a clear temperature trend, increasing or decreasing in the bioavailable or leachable fractions depending on the feedstock. Analysis of the up-flow percolation test showed the same temperature related trend in DOC leachability from BCWC and BCLG, with high temperature (700 C) BCs releasing lower cumulative amounts of DOC compared with low
temperature (450 C) BCs, which were in the range 0.02–0.07 % and 0.06–0.09 % of total carbon (TC) content, respectively. DOC leaching from BCPB varied with pyrolysis temperatures and types of leachant (i.e. urban storm-water runoff (USWR)). For all the adopted pyrolysis temperature, BCPB released cumulative amount of DOC up to 0.01 % of the TC content with pathway USWR. High temperature (i.e. 700 °C) BCPB released lower cumulative amount of DOC (up to 0.02 % of the TC content) with roof USWR. It is likely that the leachant (i.e. pathway USWR) with relatively higher pH and DOC concentration limited the release of DOC from the BC matrix, whereas the types of leachant (i.e. deionized water, and roof USWR) with relatively lower pH and DOC concentrations enhanced the release of DOC from the BC matrix.
Notations
Symbols
C – carbon; Cd – cadmium; Cr – chromium; Cu – copper; H – hydrogen; M – molarity; N – nitrogen; Ni – nichel; O – oxygen; Pb – lead; S – sulfur; Zn – zinc.Abbreviations
BC – biochar;BCDSS – biochar from digested sewage sludge;
BCDSS450 – biochar from digested sewage sludge at the pyrolysis temperature of 450 ºC; BCDSS700 – biochar from digested sewage sludge at the pyrolysis temperature of 700 ºC; BCLG – biochar from lignin;
BCLG450 – biochar from lignin at the pyrolysis temperature of 450 ºC; BCLG700 – biochar from lignin at the pyrolysis temperature of 700 ºC; BCPB – biochar from pine bark;
BCPB300 – biochar from pine bark at the pyrolysis temperature of 300 ºC; BCPB450 – biochar from pine bark at the pyrolysis temperature of 450 ºC; BCPB700 – biochar from pine bark at the pyrolysis temperature of 700 ºC; BCWC – biochar from wood chips;
BCWC450 – biochar from wood chips at the pyrolysis temperature of 450 ºC; BCWC700 – biochar from wood chips at the pyrolysis temperature of 700 ºC; DOC – dissolved organic carbon;
DSS – digested sewage sludge; DW – dry weight;
EBC – European Biochar Certificate; EC – electrical conductivity;
EU – European Union;
FAAS – flame atomic absorption spectrophotometry;
GFAAS – graphite furnace atomic absorption spectrophotometry; LG – lignin;
PB – pine bark; TC – total carbon;
WC – wood chips;
WWTP – wastewater treatment plant.
Chemical compounds
CaCl2 – calcium chloride;
CH4 – methane;
CO – carbon monoxide; CO2 – carbon dioxide;
HCl – hydrochloric acid; HCN – hydrogen cyanide; HNO3 – nitric acid;
Content
INTRODUCTION …….……….….….…..1 Problem formulation …….…….…….……….…..1 Topicality of work…….……….……….……..….1 Research object…….…….……...……….….……1 Aim of work ……..…….…….…….…….…….………...……….1 Tasks of work……..…….…….…….………...….1Methodology of the research ………….…….…...….………...2
Scientific novelty of the research ………….…..….……….….….…...2
Practical value of the results………….…….………..……...2
1 TRACE METALS AND DISSOLVED ORGANIC CARBON IN BIOCHAR REVIEW……….………3
1.1 Biochar from slow pyrolysis………3
1.2 European policies and regulations related to biochar………..…….4
1.3 Types of feedstock for biochar production………..…….4
1.4 Trace metals in biochar ………..……….…….5
1.5 Dissolved organic carbon in biochar ………...6
1.6 Environmental implications related to trace metals and dissolved organic carbon in biochar……….…………10
2 MATERIALS AND METHODS……….…..12
2.1 Feedstock and biochar production……….…….12
2.2 Physical analysis of the feedstock………..……14
2.3 Physical analysis of the biochars……….…..….15
2.4 Chemical analysis of the biochars and the feedstock….……….…...15
2.5 Trace metal and dissolved organic carbon leachability via up-flow percolation test …..…...………17
2.6 Quality assurance……...……….…20
2.7 Calculation and statistical analysis of experimental data...………21
3 RESULTS………...…25
3.1 Biochar production……….…25
3.2 Physico-chemical properties of biochars..………..…26
3.3 Carbon loss resulting from pyrolysis of pine bark…….………33
3.4 Elemental analysis of pine bark and biochars from pine bark...……….34
3.5 Trace elements in biochars and feedstock………..…37
3.7 Citric acid extractable trace metals in biochars………..……….46
3.8 Electrical conductivity and pH of eluates………....48
3.9 Dissolved organic carbon leaching from biochars………...…52
CONCLUSIONS………...……58
RECOMMENDATIONS ……….………61
REFERENCES ……….………62
List of figures
Fig. 1 Scatter plot and box-and-whisker plot for dissolved organic carbon content of biochar
from slow pyrolysis………...9
Fig. 2 Mean dissolved organic carbon content of biochar from slow pyrolysis of
cellulose-rich feedstock, of lignin-cellulose-rich feedstock, and of manure and waste……….………10
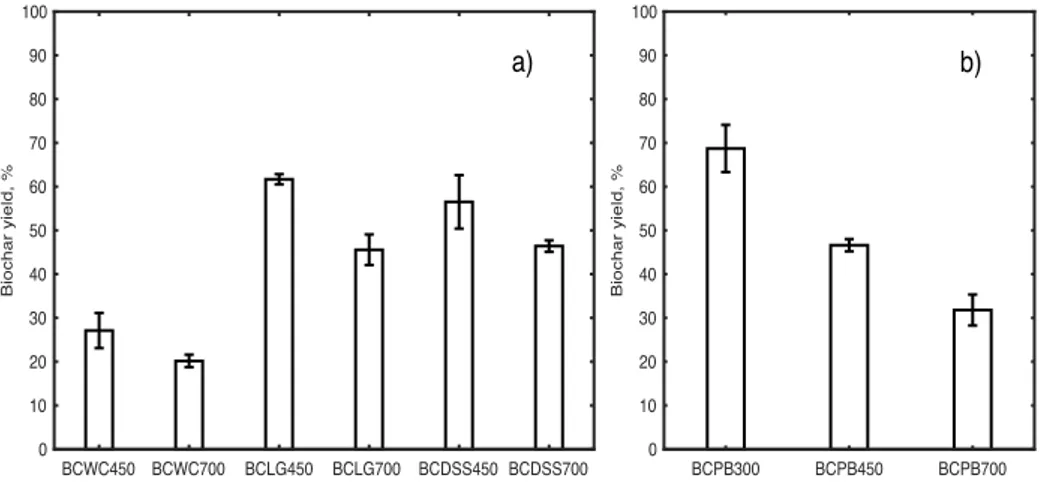
Fig. 3 The setup of the up-flow percolation test……….………..………18 Fig. 4 Mean values of yield of biochars from wood chips, lignin, digested sewage sludge,
and pine bark...25
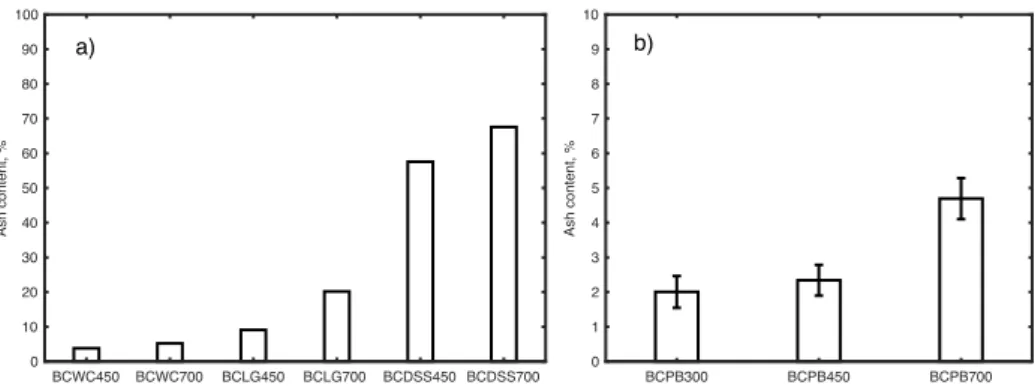
Fig. 5 Mean values of ash content of biochars from wood chips, lignin, digested sewage
sludge, and pine bark………27
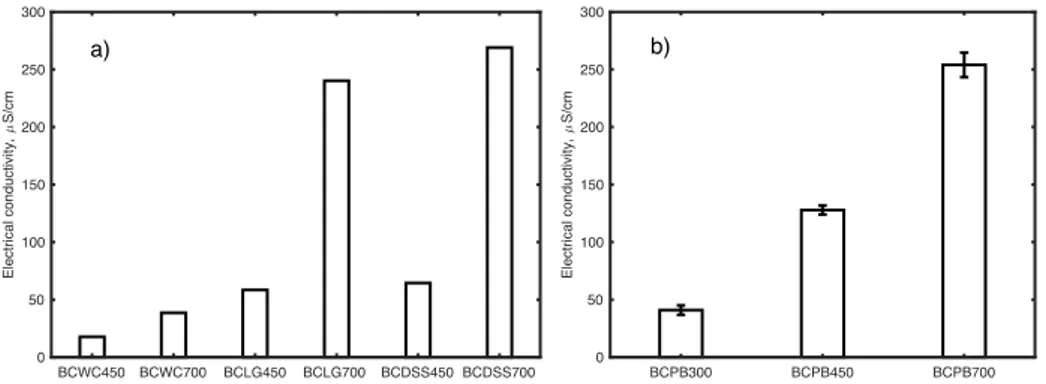
Fig. 6 Mean values of electrical conductivity of biochars from wood chips, lignin, digested
sewage sludge, and pine bark ……….……….…28
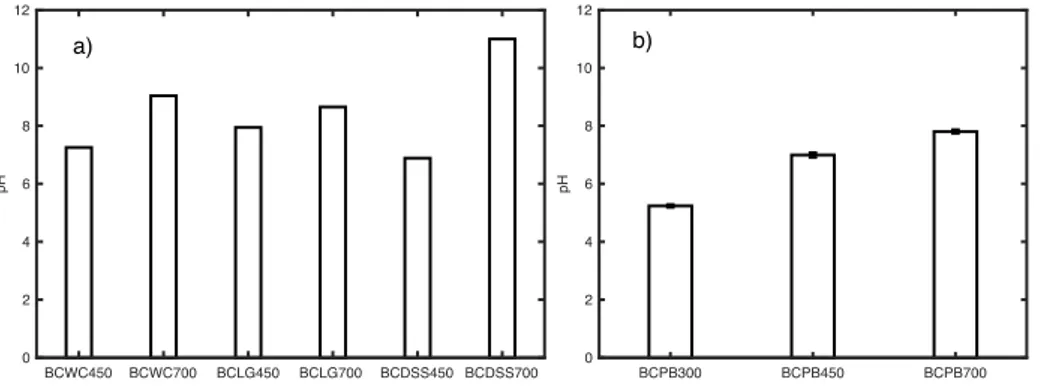
Fig. 7 Mean values of pH of biochars from wood chips, lignin, digested sewage sludge, and
pine bark……….……….…29
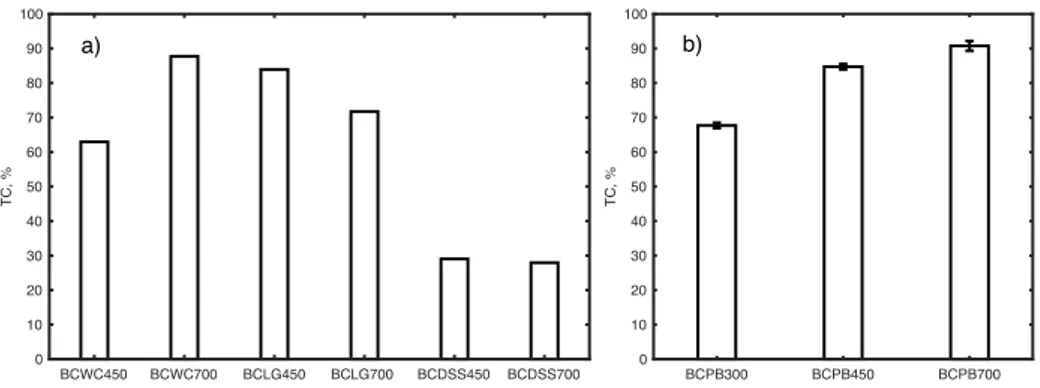
Fig. 8 Mean values of total carbon of biochars from wood chips, lignin, digested sewage
sludge, and pine bark………..30
Fig. 9 Dissolved organic carbon content in biochars from wood chips, lignin, digested sewage
sludge, and pine bark determined via batch method……….……… 31
Fig. 10 Dissolved organic carbon content expressed as a percentage of total carbon content
of biochars from wood chips, lignin, digested sewage sludge, and pine bark…………32
Fig. 11 Carbon loss resulting from pyrolysis of pine bark ……….……….34 Fig. 12 The van Krevelen plot of the elemental data calculated for pine bark (PB) and biochar
from PB at 300, 450, and 700 °C……… 36
Fig. 13 Cumulative quantity of Cu released by biochars (BCs) from wood chips, BCs from
lignin, and BCs from digested sewage sludge at various cumulative liquid to solid ratios, expressed as percentages of the respective total trace metal concentration………..…..42
Fig. 14 Cumulative quantity of Zn released by biochar from digested sewage sludge at 450
°C at various cumulative liquid to solid ratios, expressed as percentages of the respective total trace metal concentration……….………43
Fig. 15 Cumulative quantity of Cd released by biochars (BCs) from wood chips, BCs from
lignin, and BCs from digested sewage sludge at various cumulative liquid to solid ratios, expressed as percentages of the respective total trace metal concentration..…..………44
Fig.16 Cumulative quantity of Pd released by biochars (BCs) from wood chips, BCs from
lignin, and BCs from digested sewage sludge at various cumulative liquid to solid ratios, expressed as percentages of the respective total trace metal concentration..………45
Fig. 19 Mean values of pH of the eluates collected at various liquid to solid ratios from roof
and pathway urban storm-water runoff up-flow percolation tests with pine bark (PB), and biochar from PB at 300, 450, and 700 °C ……….……….……….49
Fig.20 Mean values of electrical conductivity of biochar eluates collected at various liquid
to solid ratios ….………….……….….……….……….……….…50
Fig. 21 Mean values of electrical conductivity of the eluates collected at various liquid to
solid ratios from roof and pathway urban storm-water runoff up-flow percolation tests with pine bark (PB), and biochar from PB at 300, 450, and 700 °C………51
Fig. 22 Mean values of dissolved organic carbon of biochar eluates collected at various liquid
to solid ratios………... 53
Fig. 23 Mean values of dissolved organic carbon released by pine bark (PB), and biochar
from PB at 300, 450, and 700 °C in the eluates collected at various liquid to solid ratios from roof and pathway urban storm-water runoff up-flow percolation tests….……….55
List of tables
Table 1 Electrical conductivity, pH, ash and moisture content of the feedstock……..……13 Table 2 Rainfall conditions, flow-rate and chemical parameters measured in the urban
storm-water runoff samples collected during two storm events on 29 May and 7 June 2017…20
Table 3 Elemental analysis of pine bark (PB) and biochar from PB at 300, 450, and 700 °C
………..………...35
Table 4 Order of trace metal concentration dry weight as detected in the feedstock and in the
produced biochars………37
Table 5 Total trace metal (Cd, Cr, Cu, Ni, Pb, and Zn) concentrations in feedstock and in
biochars………..………..38
Table 6 Retention rate of the trace metals detected in biochars from wood chips, lignin, and
digested sewage sludge……….……….….……41
Table 7 Dissolved organic carbon content in biochars from wood chips and lignin determined
via up-flow percolation test expressed as a percentage of the respective total carbon content………..………...54
Table 8 Dissolved organic carbon content in pine bark (PB) and biochars from PB
determined via up-flow percolation test with urban storm-water runoff expressed as a percentage of the respective total carbon content………..….56
Supplemental material
Table S1 Cumulative quantity of trace metals released per kg biochar at the cumulative liquid
to solid ratio equal to 10 compared to the Lithuanian standards for the limitation of hazardous trace metals discharge to surface water ……….………..75
Table S2 Mean values of moisture content of biochars from wood chips, lignin, digested
Mutter, ich bin dumm
Introduction
Problem formulation
Biochar may contain potentially hazardous inorganic substances that may limit or prevent the utilization of biochar for environmental remediation purposes. Biochar contains carbon in labile forms that are prone to be leached as dissolved organic carbon. Physical and chemical characteristics of biochar vary over a wide range depending on the types of feedstock and the production conditions (e.g. pyrolysis temperature). To avoid potential drawbacks when utilizing biochar both in soil and water system application, it is necessary to evaluate biochar trace metal and dissolved organic carbon content and leachability.
Topicality of work
Biochar technology embraces several environmental issues (e.g. soil improvement, waste management, climate change mitigation, energy production, and remediation of contaminated sites) that are at the forefront of the scientific community. Biochar, as a novel technique, is neither regulated nor standardized. Before testing biochar for environmental remediation purposes, physical and chemical characteristics are to be assessed. The content and the extent to which trace metal and dissolved organic carbon are released from biochar limit or prevent the application of biochar for environmental management.
Research object
Trace metal and dissolved organic carbon content and leachability from biochar varying with types of feedstock and pyrolysis temperatures.
Aim of work
The aim of the work was to investigate variability of trace metal and dissolved organic carbon content and leachability of biochars produced for environmental application in soil or water systems.
Tasks of work
1. To assess the influence of feedstock selection and changes in pyrolysis conditions (i.e. pyrolysis temperature) on total trace metal (Cd, Cr, Cu, Ni, Pb, and Zn) concentration,
2. To investigate the influence of the type of feedstock and the production temperature on dissolved organic carbon content of biochar from slow pyrolysis, based on data gathered from the literature;
3. To investigate the influence of the type of feedstock and production temperature on the dissolved organic carbon content and leachability of biochar from slow pyrolysis.
Methodology of the research
A metadata analysis was performed for collecting data related to dissolved organic carbon content of biochar from the literature. Biochar was produced from slow pyrolysis at different temperatures from different types of feedstock. Based on methodologies reported in the literature, physical and chemical properties of biochars were investigated. Up-flow percolation tests were performed based on standard or specific methodology for analyzing trace metal and dissolved organic carbon leachability of biochars.
Scientific novelty of the research
Based on data gathered from the literature, a linear regression of the values of dissolved organic carbon content of biochar from slow pyrolysis was calculated. Physical and chemical characteristics of biochar from different types of feedstock at different pyrolysis temperatures were evaluated. Dissolved organic carbon content and leachability of biochar from several types of feedstock at different pyrolysis temperatures were investigated. Trace metal content, leachability, and bioavailability in biochar from several types of feedstock at different pyrolysis temperatures were assessed. Potential environmental applications were considered for the tested biochars.
Practical value of the results
Understanding the parameters (i.e. feedstock type and pyrolysis temperature) that affect the amount of dissolved organic carbon released by biochar could be an effective tool for designing ad hoc biochar production and application. If pyrolysis can reduce trace metal leachability and availability in biochars from potentially contaminated feedstock, it may also reduce some of the environmental concerns associated with biochar water system application or land application.
1 Trace metals and dissolved organic carbon in biochar
review
1.1 Biochar from slow pyrolysis
Biochar (BC) as a filtering media has been reported to be a promising remediating tool for a variety of potential hazardous organic and inorganic substances both in soil and water systems.
The European Biochar Certificate (EBC European Biochar Certificate 2015) specifies that ‘‘Biochar is produced by pyrolysis of sustainably obtained biomass under controlled conditions with clean technology and is used for any purpose that does not involve its rapid mineralization to CO2 and may eventually become a soil amendment’’.
BC used for environmental remediation (Zheng et al. 2015) purposes has received considerable attention in recent years both as a filtering media (Chen et al. 2011; Baltrėnas et al. 2015; Komkienė and Baltrėnaitė 2015) and as a soil amendment for releasing nutrients (Mukherjee and Zimmerman 2013), sequestering carbon, enhancing soil quality and sequestering a variety of contaminants, such as trace metals (Karami et al. 2011; Park et al. 2011). As a low-cost sorbent (Ahmad et al. 2014), BC has attracted increasing attention for applications in treating multi-element polluted water such as landfill leachate (Chemerys and Baltrėnaitė 2017) and urban storm-water runoff (USWR) (Beck et al. 2011; Reddy et al. 2014; Tian et al. 2014; Shimabuku et al. 2016; Kuoppamäki et al. 2016).
BC from slow pyrolysis encompasses BC produced in the range of 350–1000 °C in a low-oxygen thermal process (EBC European Biochar Certificate 2015) characterized by a low heating rate (up to 100 °C/s) and a residence time of hours (Spokas et al. 2011).
Feedstock for BC production is subjected to physical and chemical alterations during the pyrolysis process, thereby affecting the properties of the resulting BC matrix (Rehrah et al. 2014). At temperatures below 450 °C, cellulose and hemicellulose decompose into light molecular weight compounds, tending to form pyrolytic vapors (Lee et al. 2013). In the work by Yang et al. (2007), hemicellulose and cellulose were quickly pyrolyzed, with the main weight loss occurring in the range of 220–315 and 315–400 °C, respectively. According to Zhao et al. (2014), a part of the cellulose content of the feedstock does not volatize and contribute to the lignin pool of the biochar produced through pyrolysis process. Lignin decomposes over a wide range of temperature (150–900 °C) (Yang et al. 2007), being the main responsible for BC formation (Lee et al. 2013). Furthermore, the higher is the
(Gani and Naruse 2007). However, researches based on comparisons between thermochemical behavior of single biomass components (i.e. cellulose, lignin and hemicelluloses) may overlook complex interactions occurring during pyrolysis of raw biomass (Liu et al. 2017).
As far as the influence of pyrolysis temperature on the physico-chemical properties of BC is concerned, several authors have reported a shift to higher pH (Jindo et al. 2014; Yuan et al. 2015), higher electrical conductivity (EC) (Al- Wabel et al. 2013; Rehraha et al. 2014), higher ash and total carbon (TC) content (Gundale and De Luca 2006; Cross and Sohi 2011; Aller 2016) with the increase in pyrolysis temperature. Furthermore, increases in pyrolysis temperature result in biochars with higher C content and lower N, H and O contents due to losses of H-and O-containing functional groups and volatile compounds (Novak et al. 2009; Wu et al. 2011; Crombie et al. 2012) and concurrent formation of aromatic C (Rutherford et al. 2012).
1.2 European policies and regulations related to biochar
BC production is a cross-cutting technology addressing issues covered by several European Union (EU) policy areas such as waste management, agricultural policy, climate change, and energy policy (Montanarella and Lugato 2013). At present, no EU regulation or directive expressly refers to BC (Hammond 2016). As regards the use of BC for soil amendment purposes, it is likely that the regulation of BC application to soil could resemble soil amendment guidance relating to sewage sludge and composts (Freddo et al. 2012). The Circular Economy Package (EC 2016) listed BC, as an inorganic soil improver, among the products to be included in the annexes to the new EU fertilizer regulation that is currently under revision. These annexes are expected to set the end-of-waste criteria regarding BC adoption for soil amendment purposes. According to Meyer et al. (2017), once the carbonaceous material obtained through thermochemical treatments (e.g. pyrolysis) of waste biomass ceases to be considered waste because of achieved safety and quality levels and labelled as BC, it might be registered under the REACH directive (EC 2006).
As to meeting feedstock sustainability criteria (EBC European Biochar Certificate 2015), biomass waste with minor or no use are generally selected for BC production. To this respect, BC technology is intimately linked to policy drivers such as sustainable and smart use of resources (EC 2016) that are at the forefront of the European Union.
1.3 Types of feedstock for biochar production
A large variety of feedstock types has been utilized for BC production (Aller 2016). Both pristine feedstock (e.g. forestry residue), that is produced in large quantities with minor or no
use, and potentially contaminated feedstock (e.g. phytoremediation biomass, wood processing waste, and sewage sludge) are of particular interest to meet sustainability criteria and add value to biochar production. Although, the European Biochar Certificate (EBC European Biochar Certificate 2015) set a list of materials that are suitable for producing BC with minor or no risks of unintended contamination resulting from BC application to soil or water.
In the present dissertation, forestry residue and biodegradable by-products of industrial processes were considered as feedstocks suitable for biochar production in Lithuania. From the waste management point of view, the pyrolysis of sewage sludge is an interesting technique since it leads to both a reduction in the waste volume and the stabilization of the organic matter (Hossain et al. 2011). In Lithuania, in 2012 the production and disposal of sewage sludge from urban wastewater accounted for 45 thousand tons in dry substance with about 14 % used for agricultural purposes and 26 % utilized for composting and other applications (Eurostat 2015). Between 2001 and 2009 a 78 % decrease in sludge landfilling and a 23 % increase in the agricultural use of sludge was recorded in Lithuania (Kelessidis et al. 2012). Lignin is a massive by-product of biorefinery industries (Li et al. 2014). Almost all of the bagasse obtained from sugar processing is utilized as fuel for boilers by the sugar mill itself. Other processes and products that traditionally rely on it as a raw material are electricity generation, pulp and paper production, and products based on fermentation (Pandey et al. 2000). BCs produced from lignin at moderate temperature are seldom reported even though lignin is used for producing activated carbon through a pyrolysis process (Li et al. 2014). According to Katinas et al. (2007), the total amount of wood and wood waste for bioenergy production is estimated as 4.55 million m3 solid volume, per year in Lithuania.
Pine bark is a biomass waste produced with a great amount per year with minor use (e.g. bark mulch, and energy production), thus it has been investigated for application in bio-filters as a low-cost bio-sorbent (Luo and Lindsey 2006; Dalahmeh et al. 2012). Lithuania produces about 2.5 million m3 of forest cutting waste per year for potential use in BC production
(Baltrėnaitė et al. 2016).
1.4 Trace metals in biochar
BC itself may contain potentially hazardous inorganic substances (Hilber et al. 2017) that may limit or prevent the utilization of BC for environmental remediation purposes. The presence of metals is likely to depend on contaminated feedstock or on the use of processing conditions that may favor their accumulation in BC (Hossain et al. 2011; Lu et al. 2011; Bernardo et al. 2014).
and the chemical composition of the feedstock (Buss et al. 2016; Huang et al. 2017). Except for some trace metals (e.g. Cd) that easily volatilize during pyrolysis, trace metals which are initially present in the parent material generally remain and become concentrated in the BCs (Lievens et al. 2008; Yuan et al. 2015; Liu et al. 2017; Roberts et al. 2017). Applying low heating rates and low temperatures (<450 °C) enhances the extent to which Ni is retained in BC during pyrolysis of biomass (Liu et al. 2017). Lu et al. (2015), analyzing the behavior of trace metals in BC produced from sewage sludge at pyrolysis temperatures in the range of 300–700 °C, found that BC retained 90.4–98.3 % of Pb, 96.4–99.5 % of Zn, 92.5–99.3 % of Ni, 85.8–98.5 % of Cd, 81.5–94.5 % of Cu and 70.0–87.5 % of Cr. The thermo-stable behavior of the trace metals during pyrolysis was explained as the result of the transformation of the studied trace metals from mineral salts and hydroxide into oxide and sulphide forms. In the work by Méndez et al. (2012), BC from sewage sludge pyrolyzed at 500 °C had a higher content of Cu (31 %), and Pb (30 %), as well as about 28 % more Ni, Cd and Zn than the feedstock.
Several studies have reported a decrease in metal availability and leachability from BC as a result of physical and chemical alterations occurring during pyrolysis of waste biomass (Lin et al. 2012; Devi and Saroha 2014; Yargicoglu et al. 2015; Roberts et al. 2017). An investigation of plant available trace element concentrations in BC from digested waste water sludge pyrolyzed over a range of temperatures from 300 up to 700 °C, demonstrated that the concentrations of Cd, Cu, and Zn in the diethylene triamine pentaacetic acid extract of BC were lower than those in the feedstock (Hossain et al. 2011). In the study by Lu et al. (2011), sewage sludge from a wastewater treatment plant (WWTP) was pyrolyzed for 2 h at 550 °C. The amount of trace metals such as Zn (1400 mg/kg), Cu (536 mg/kg), Pb (107 mg/kg) and Ni (76.5 mg/kg) detected in the resulting BC posed negligible concern for metal leaching because of their undetectable level (<0.01 mg/l) in the standard toxicity characteristic leaching procedure extract.
Although the concentration, the leachability, and the bioavailability of trace metals in BC have been becoming one of the main focuses of research on the production and characterization of BC, it is still unclear which factors (e.g. pyrolysis temperature and type of feedstock) determine trace metal behavior during pyrolysis process (Evangelou et al. 2014), trace metal concentration and composition in BC (Tan et al. 2015), and leachability from BC (Wu et al. 2016).
1.5 Dissolved organic carbon in biochar
The content and the forms of C in BC varies depending on the types of feedstock (e.g. lignin-or cellulose-rich feedstocks) and the processing conditions (e.g. pyrolysis temperature) (Aller 2016). BC contains C in labile forms that are prone to be leached as DOC. Several studies
have reported an influence of feedstock selection and pyrolysis conditions (i.e. heating rate, residence time and temperature) on the content and the extent to which DOC is released from BC (Lin et al. 2012; Mukherjee and Zimmerman 2013; Alburquerque et al. 2014; Graber et al. 2014).
To investigate the influence of the type of feedstock and the production temperature on the DOC content of BC from slow pyrolysis, data were collected from the literature to conduct a metadata analysis. However, when comparing results of DOC analysis it should be considered that the amount of DOC released from BCs assessed via batch tests has been reported to depend on various parameters such as the ratio of the solvent to solute (Mukherjee and Zimmerman 2013), temperature and pH of the extraction solution (Li et al. 2017). BC has been produced from a large variety of types of feedstock. BC classification depending on the feedstock was adapted from Aller (2016), as follow:
–
BC from lignin-rich feedstock (e.g. lignin, tree part, wood, sawdust, almond and cacao shells, and olive stones);–
BC from cellulose-rich feedstock (e.g. cellulose, grasses, straws, grains, stalks, peanut hulls and shells, sugarcane leaves and bagasse, and maize silage);– BC from manure and waste (e.g. manures, bio-solids, green waste (e.g. mushroom residue, greenhouse waste, and olive pomace)).
With the aim of collecting data related to the present review, the search platform Engineering VillageTM (Elsevier, Netherlands) was used. The search criteria were adopted following
Gurwick et al. (2013):
– articles published in peer reviewed journals in the period from 2007 to 2016, including relevant articles cited by recent studies or published in the afore mentioned time span; – articles published in languages other than English were discarded;
– if either the pyrolysis parameters (e.g. temperature, heating rate or residence time) or the type of thermochemical process (e.g. slow pyrolysis) for producing BC were not clearly reported, data were not considered for calculations;
– for the search query the following terms were entered: “biochar”, “dissolved organic carbon”, “water soluble organic carbon”, “water extractable organic carbon”;
– for determining DOC content of BC, we considered only data referring to samples obtained through one-step extraction or stirring methods filtered through a filter with pore size ≤ 0.45-m.
As for DOC analysis of BC via batch test method, if the measured concentration of DOC in the samples were reported as mg/l, the DOC content (g/kg) of BC was calculated considering the mass of BC and the volume of extractant (Jamieson et al. 2014). To evaluate the temperature-related trend of DOC content of BC, DOC contents of BC were plotted versus
the respective pyrolysis temperatures and a relation was determined by step-wise linear regression with slope and intercept considered significant at p ≤ 0.05.
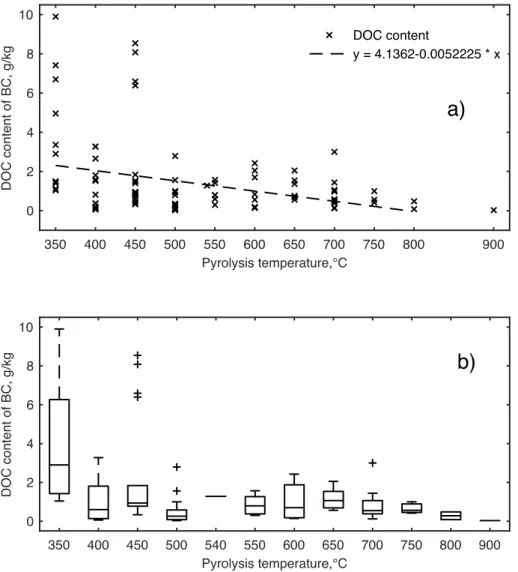
Figure 1a shows a linear relation between DOC content of BC from slow pyrolysis and the temperatures in the range of 350–790 °C. Lower temperatures (< 350 °C) were not considered as it would have resulted in a strong degree of scatter (data not shown).
The linear relation in Figure 1a does not fit for temperatures higher than 790 °C, as the BC produced at these temperatures would be associated to negative DOC content. There was a weak correlation (r2 = 0.1) of the data with the linear model with intercept (4.1) and slope
(0.005) significant at p < 0.001, with a sufficient degree of scatter at temperatures in the range of 350–450 °C (Fig. 1b). The observed weak correlation suggests that not only the peak temperature but also other parameters (e.g. heating rate, residence time, and pressure) of the thermochemical process concur in determining the DOC content of BC. Jamieson et al. (2014) suggested that pyrolysis conditions such as fast heating rates and low residence times may lead to produce BCs that are more prone to leaching DOC. Increasing pyrolysis temperature has been generally reported to result in a decrease in DOC content of BC (Zhang et al. 2015; Smith et al. 2016). However, rising pyrolysis temperatures in the range 350–450 C have resulted in BC with higher DOC content in the works by Graber et al. (2014) and Luo et al. (2015).
As for the influence of the type of feedstock on DOC content as well as the extent to which it is prone to leaching from BC, several authors have reported that BCs from wood and woody biomass generally release less DOC compared to non-wood biomass (e.g., agricultural residue and animal wastes) (Mukherjee and Zimmerman 2013; Graber et al. 2014).
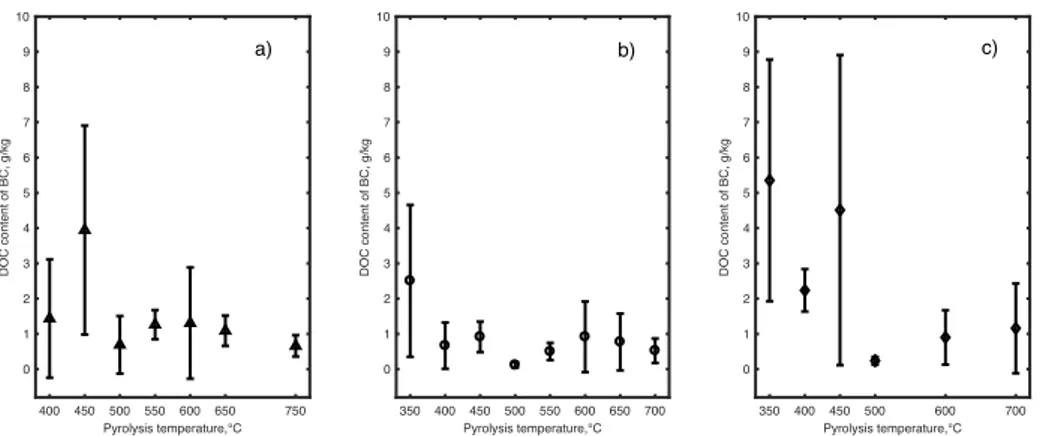
Alburquerque et al. (2014) observed that the influence of feedstock selection for BC production on the measured DOC concentrations was highest for BC at lower temperatures (i.e. 350 and 450 C) compared with higher temperature (i.e. 600 C). According to data retrieved from the literature grouped depending on the type of feedstock and pyrolysis temperature (Fig. 2), mean DOC content of BC from manure and waste (Fig. 2c) was the highest (2.24–5.35 g/kg) in the temperature range of 350–450 °C.
Mean DOC content of BC from cellulose-rich feedstock (Fig. 2a) was the highest (0.69–1.31 g/kg) in the temperature range of 500–650 °C. Mean DOC content of BC from lignin-rich feedstock (Fig. 2b) was the lowest in the temperature range of 350–550 °C (0.12–2.50 g/kg) as well as at 700 °C (0.520.35 g/kg).
The extent of DOC leaching from BC and the parent feedstock likely depends on factors such as chemical forms, physical association, and location (bulk or surface) of C (Wu et al. 2011; Mukherjee and Zimmerman 2013).
As for the mechanism that leads to the release of DOC from BC, Jones et al. (2011) suggested that DOC is released at first from the surface and later from the BC matrix following a
Fig. 1 Scatter plot (a) and box-and-whisker plot (b) for dissolved organic carbon (DOC)
content of biochar (BC) from slow pyrolysis. n = 102
Linear regression (a) for the values of DOC content of BC in the temperature range 350–790 °C. Box-and-whisker plots (b) show median (i.e. central line), upper (25%) and lower (75%) quantile (i.e. lower and upper bounds of the box, respectively) of the data, maximum and minimum values outside the central box that are not outliers (vertical lines), and outliers (cross symbols). Adapted from Mancinelli et al (2017a)
diffusion-limited mechanism. Micropores carry the portion of DOC in BC that is more prone to leaching with increasing temperature and pH of the leachant (Li et al. 2017). In column leaching tests performed by Beesley and Marmiroli (2011) and Iqbal et al. (2015), DOC was observed to be rapidly released from biochar with no substantial amount of DOC recorded after a few eluate samples.
1.6 Environmental implications related to trace metals and dissolved
organic carbon in biochar
Trace metals in a water-soluble form may represent an environmental issue when they are bioavailable or when they mobilize through soil or water media. In water systems, DOC interacts with dissolved trace metal affecting their mobility and bioavailability through the formation of DOC–metal complexes.
As regards environmental risk caused by metal species within BC, the safe level of BC application to soil depends on the metal content of the biomass feedstock and the pyrolysis conditions (McHenry 2009; Shackley et al. 2010). Trace metals such as Cd and Pb are non-essential elements, having no definite biological function in organism and plant (Bolan et al. 2013). Therefore, introducing trace amount of bioavailable Cd and Pb in soil through BC land application is highly undesirable (Wu et al. 2016).
BC-borne DOC may represent a source of impairment of aquatic environment containing organic species producing an inhibitory effect on the growth of aquatic micro-organisms (Smith et al. 2012), increasing metal mobility through complexation, and altering redox
Fig. 2 Mean dissolved organic carbon (DOC) content of biochar (BC) from slow
pyrolysis of cellulose-rich feedstock (a), of lignin-rich feedstock (b), and of manure and waste (c). Error bars show standard deviation. n = 33 (a). n = 42 (b). n = 22 (c). Retrieved from Mancinelli et al. (2017a)
reactions and speciation of metals (Qu et al. 2016). Uchimiya et al. (2013) observed that DOC released by BCs in the temperature ranging 350–500 C was enriched with carboxyl and poly(phenolic) functionalities that are able to affect metal mobilization via complexation with metal ions.
Formation of DOC metal complexes competing with the adsorption capacity of BC (Iqbal et al. 2015) and fouling of BC surface (Ulrich et al. 2015) have been reported as potential negative effect of DOC on the BC effectiveness in filtering polluted water.
Furthermore, BC-borne DOC may reduce BC effectiveness in carbon sequestration (Wu et al. 2011; Liu et al. 2016). Having lower aromaticity and less fused aromatic structures than bulk biochar, DOC is expected to have lower environmental recalcitrance (Qu et al. 2016). Regarding the recalcitrance of BC-borne DOC in water media (i.e. river water), Norwood et al. (2013) has reported a half-life of 30–40 days for DOC from biochar at 250 °C.
BC may be subject to post production treatment (e.g. rinsing) to limit the release of DOC (Ngueleu et al. 2014). Although, from a sustainable point of view, producing BC with no need for treatments that may be water demanding or energy consuming should be the first choice. Hence, to limit the content of DOC in BC, Smith et al. (2016) has suggested to adopt pyrolysis temperatures above 400 C.
However, the environmental implications of biochar-derived DOC have not been well elucidated, and further studies are on demand (Luo et al. 2015).
2 Materials and methods
2.1 Feedstock and biochar production
Four types of biodegradable materials were selected as feedstock for BC production. As to be representative of widely available types of feedstock in Lithuania, materials for producing biochar were selected as follow:
– as potentially contaminated feedstock, three types of bio-degradable by-products of industrial processes were chosen (i.e. wood chips (WC), lignin (LG), and digested sewage sludge (DSS);
– as pristine feedstock, pine bark (PB).
DSS was collected from an urban waste water treatment plant in Klaipėda which is the third largest city in Lithuania, with a population of about 159 thousand people in 2013. Sewage sludge production in Klaipėda county has been calculated as 47 thousand tonnes per year (Havukainen et al. 2011). Sewage sludge was subjected to digestion, dewatering and low-temperature drying treatment.
WC were provided by a sawmill in Kaliningrad, Russian Federation. In 2006, 21 % (362 thousand tonnes) of the total wood waste imported to the European Union came from Russia (Villanueva et al. 2010).
LG was produced as a by-product of a sugar refining industry based in Lithuania.
PB was collected from the stem of Scots pines (Pinus silvestris L.) in the forest stands located in the premises of Vilnius Gediminas Technical University in Vilnius, Lithuania. Samples were collected from the external surface of stem bark at a height of about 1.5 m above ground. The bark samples were considered representative of a relatively clean suburban area as the sampling area was subjected to no point neither linear (distance from roads >100 m) sources of air pollution. Scots pine was selected as it is a widespread tree species in several European areas and it is abundant in Lithuania. Of the total area covered by forests (about 2 million ha) in Lithuania, about 35.5 % (721 thousand ha) consists of Scots pine forests (Krakau et al. 2013). Of the 8.97 million m3 trees that are annually felled in Lithuania, Scots pine represents
the most felled (29.3 %) tree species with about 2.6 million m3 (Kuliešis et al. 2016).
The physico-chemical properties of the four types of feedstock are listed in Table 1. The quantity of air-dried feedstock used for pyrolysis at 450 °C was 1070 g WC, 430 g LG, 1750 g PB, and 830 g DSS whereas the amount used at the pyrolysis temperature of 700 °C was 1400 g WC, 1050 g LG, 2750 g PB, and 1330 g DSS.
The pyrolysis of the raw materials was carried out according to the procedure described elsewhere (Komkiene and Baltrenaite 2016). Air dried feedstock was weighed and wrapped in aluminium foil in order to create an oxygen-limited environment. Slow pyrolysis was
performed in a E5CK-T muffle furnace with a heating rate of about 10 °C/min, under oxygen-limited conditions, and under atmospheric pressure. Pyrolysis was performed at the peak temperatures of 300, 450 and 700 ± 5 ºC.
The peak temperatures were chosen to be representative of charring stages occurring during biochar formation (i.e. the temperature of 300 °C for amorphous char (200–350 °C), temperature of 450 °C for composite char (350–500 °C), and the temperature of 700 °C for turbostratic char (>500 °C)) (Keiluweit et al. 2010; Zhao et al. 2014). Biochar is produced at temperatures 350 °C (EBC European Biochar Certificate 2015). However, different studies labelled as biochar the carbonaceous solid product of pyrolysis process at temperatures in the range 250–300 °C (Liu et al. 2016; Zhang et al. 2015; Smith et al. 2016; Yue et al. 2016). The holding time at the desired peak temperatures was of 2 h. Each of the production combinations (the four types of feedstock at two different pyrolysis temperatures) was repeated three times. At the end of the production process, the samples were left to cool in the muffle furnace overnight. In order to determine the yield of BC, the obtained BC samples were weighed at the end of the production process.
The obtained BCs were assigned the following codes:
– BCWC450 and BCWC700 for BC from wood chips (BCWC) at the pyrolysis temperatures of 450 and 700 °C, respectively;
– BCLG450 and BCLG700 for BC from lignin (BCLG) at the pyrolysis temperatures of 450
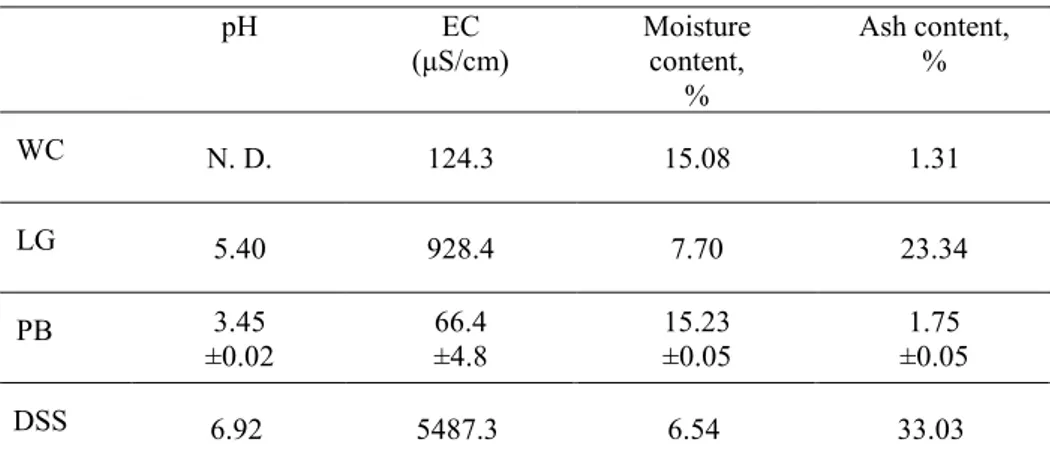
Table 1 Electrical conductivity (EC), pH, ash and moisture content of the feedstock
pH EC (μS/cm) Moisture content, % Ash content, % WC N. D. 124.3 15.08 1.31 LG 5.40 928.4 7.70 23.34 PB 3.45 ±0.02 66.4 ±4.8 15.23 ±0.05 1.75 ±0.05 DSS 6.92 5487.3 6.54 33.03
Values are shown as the mean value of two observations (n = 2) for the samples from WC, LG, and DSS. Values are shown as the mean value of three observations (n = 3) ± standard deviation for the samples from PB. N. D. – not determined
– BCPB300, BCPB450 and BCPB700 for BC from pine bark (BCPB) at the pyrolysis temperatures of 300, 450 and 700 °C, respectively;
– BCDSS450 and BCDSS700 for BC from digested sewage sludge (BCDSS) at the pyrolysis temperatures of 450 and 700 °C, respectively.
2.2 Physical analysis of the feedstock
The present dissertation is based on the results of research activities performed at the laboratories of the Institute of Environmental Protection and the Department of Environmental Protection of Vilnius Gediminas Technical University during two visits under the Erasmus Programme. Therefore, the methods followed slightly differed depending on the aims of the performed researches as well as on time and resource constraints.
Feedstock for BC production is subjected to physical and chemical alterations (e.g. attrition, cracking, micro-structural rearrangement) during the pyrolysis process, thereby affecting the properties of the resulting BC matrix (Rehrah et al. 2014). Therefore, the methods adopted to determine the physico-chemical characteristics of the BC and the feedstock are often dissimilar. Whenever possible, in the present dissertation, the same methods were adopted for the analysis of both the BCs and the feedstock in order to facilitate the comparison of the results.
As regards the moisture content of the feedstock, samples were put in crucibles, weighed and heated in an oven to a temperature of 105 °C for 2 h according to ISO 18134-2:2015 – Solid
biofuels - Determination of moisture content - Oven dry method - Part 2: Total moisture - Simplified method. The crucibles were allowed to cool down at room temperature in a
desiccator, then weighed again. This process was repeated, heating the samples for 1 h until the weight was stabilised.
In order to determine the ash content of WC, LG, and DSS, the samples were put in crucibles, weighed and heated to a temperature of 450 °C for 150 min in an E5CK-T muffle furnace (Pundytė et al. 2011). The samples were left to cool in the muffle furnace overnight then weighed in order to determine the mass loss. This process was repeated until the weight of the residue was stabilised. To determine the ash content of PB, the samples were put in crucibles, weighed, and heated to a temperature of 550 °C for 1 h in an E5CK-T muffle furnace according to the guidelines of EBC (EBC European Biochar Certificate 2015). An analytical balance (Kern 770, Germany) with a sensitivity of 0.0001 g was used.
The EC of PB was measured with a conductivity metre (inoLab Cond 740 WTW) using a water extract with a mass ratio of 1:10 (weight/volume) after shaking (RS12 Rotoshake, Gerhardt, Germany) for 1 h at 20 rpm and filtering through high-quality filter paper (KA2, pore size 10–25 μm, Czech Republic) according to the guidelines of EBC (EBC European Biochar Certificate 2015). The EC of WC, DSS and LG was measured with a conductivity
meter (inoLab Cond 740 WTW) using a water extract with a mass ratio of 1:5 (water/dry solid) after shaking (RS12 Rotoshake, Gerhardt) for 20 minutes at 20 rpm and filtering through high quality filter paper (KA2, pore size 10–25 m) (Thompson et al. 2002 cited in Johnsson et al. 2005).
2.3 Physical analysis of the biochars
The moisture content of the BCs was measured according to the method mentioned in ASTM
D1762 ̶ 84: The Standard Test Method for Chemical Analysis of Wood Charcoal. In order to
determine the moisture content, 1g BC samples were weighed and then heated at 105 °C in an open crucible until the weight was stabilised. An analytical balance (Kern 770) was used. The ash content of BCWC, BCLG, and BCDSS were measured according to the method mentioned in ASTM D1762 ̶ 84: The Standard Test Method for Chemical Analysis of Wood
Charcoal. The samples were heated in an E5CK-T muffle furnace to a temperature of 750
°C for 6 h. To determine the ash content of BCPB, the samples were put in crucibles, weighed, and heated to a temperature of 550 °C for 1 h in an E5CK-T muffle furnace according to the guidelines of EBC (EBC European Biochar Certificate 2015). For weighting the samples, an analytical balance (Kern 770) was used.
EC measurements of BCWC, BCLG, and BCDSS were performed in 1% (w/w) solution of BC in deionised water with a conductivity meter (inoLab Cond 740 WTW) after stirring for 20 min at laboratory temperature (Ahmedna et al. 1997 cited in Reharaha et al. 2014). The EC of BCPB was measured with a conductivity meter (inoLab Cond 740 WTW) using a water extract with a mass ratio of 1:10 (weight/volume) after shaking (RS12 Rotoshake, Gerhardt) for 1 h at 20 rpm and filtering through high-quality filter paper (KA2, pore size 10–25 μm) according to the guidelines of EBC (EBC European Biochar Certificate 2015).
2.4 Chemical analysis of the biochars and the feedstock
The pH value of DSS and LG was determined in a 1:5 volume ratio 1 M KCl (Merck, Germany) according to the method mentioned in ISO 10390 2005: Soil quality Determination
of pH. Ten ml of LG or DSS were added to 50 ml of potassium chlorate, then shaken (RS12
Rotoshake, Gerhardt) for 60 min at 20 rpm. The suspension was allowed to stand for 60 min before measuring the pH with an electronic glass electrode (SevenMulti ion/pH/ORP module Mettler Toledo, Switzerland). The pH value of PB was determined in a 1:5 volume ratio 0.01 M CaCl2 according to the method mentioned in the guidelines of EBC (EBC European
Biochar Certificate 2015).
The pH value of BCWC, BCLG, and BCDSS was measured in 1:20 w/v ratio 1 M KCl (Merck) solution, according to a method described in Carrier et al. (2012). Three grams of BC were added to 60 ml of potassium chlorate, then shaken (RS12 Rotoshake, Gerhardt) for 30 minutes at 20 rpm. The pH value of BCPB was determined in a 1:5 volume ratio 0.01 M CaCl2 according to the method mentioned in the guidelines of EBC (EBC European Biochar
Certificate 2015). Before measuring the pH, the pH-meter was calibrated as described above for the pH determination of the feedstock.
Aliquots of about 1–3 mg dried (105 °C) ground PB and BCPB were tested for C, H, N, S, and O with a CHNS-O elemental analyser (EuroVector EuroEA3000 series, Italy). For C, H, N, and S determination, samples were placed in tin capsules and the elemental analyser was run in combustion mode. Analysis of oxygen was performed separately from CHNS analysis. Samples were placed in silver capsules and the elemental analyser was run in pyrolysis mode. DOC concentration in the BCs was determined via a batch test method. Water extracts were prepared using a 1:20 (w:v) suspension after shaking (RS12 Rotoshake, Gerhardt) for 180 min according to a method described in Dias et al. (2010). Samples of BCWC, BCLG, and BCDSS were filtered through a syringe (pore size 0.45 μm, Pall Corporation, USA). Samples of BCPB were filtered through cellulose acetate 0.45 μm pore size filter paper (Prat-Dumas, France). DOC was determined by a Total Organic Carbon (TOC) analyser (Shimadzu-V CSN, Japan). Samples were stored at 4 ºC in the dark till DOC analysis was accomplished. Total carbon (TC) in the BCs was determined according to Vaitkutė et al. (2010), with slight modifications. The fraction of BC samples passing through a 900 μm sieve (Retsch) was selected for TC determinations, and no further grinding was done. TC content was measured on aliquots of 0.025–0.028 mg using a Total Organic Carbon Analyzer TOC-V Shimadzu equipped with a solid sample module SSM-5000 (Shimadzu) via dry combustion at 900 °C. Total trace metal (Cd, Cr, Cu, Pb, Ni, and Zn) content was determined for both the potentially contaminated feedstocks (i.e. WC, LG, and DSS) and the resulting BCs (i.e. BCWC, BCLG, and BCDSS). Prior to digestion, the samples of the feedstock and the BCs were reduced to ash following the steps described in Pundytė et al. (2011). Prior to FAAS or GFAAS analysis, a 0.5-g ash sample was mixed with an aqua regia solution (3 ml HNO3 (65 %) and 9 ml of
HCl (37 %)) then heated in an Ethos 900 Milestone Microwave digestion system for 52 min. In order to eliminate any solids remaining after the digestion process, samples were filtered through high-quality filter paper (KA2, pore size 10–25 μm). The resulting sample was poured into a 50-ml flask, and the volume was made up to 50 ml with deionised water (Butkus and Baltrenaitė 2007). The concentration in solution was measured using flame atomic absorption spectrophotometry (FAAS) (210VGP atomic absorption spectrophotometer Buck Scientific, USA). When the concentration of trace metals such as Cd, Cu, and Pb was too low to be accurately detected by FAAS, a graphite furnace (GFAAS) was used. The detection
limits of Cu, Cr, Ni, and Zn were 0.1, 0.2, 0.2, and 0.04 mg/l using FAAS. The GFAAS detection limits of Cd, Cu, and Pb were 0.0001, 0.001, and 0.002 mg/l, respectively. All the procedures were carried out in accordance with the methods mentioned in CEN/TS
16188:2012: Sludge, treated biowaste and soil—Determination of elements in aqua regia and nitric acid digests—Flame atomic absorption spectrometry method (FAAS).
Bioavailable trace metal (Cd, Cr, Cu, Ni, Pb, and Zn) concentrations in BCs (i.e. BCWC, BCLG, and BCDSS) were determined according to Carrier et al. (2012). A wet digestion in 1 % citric acid (>99.5 % purity, AVSISTA, Lithuania) was carried out by adding warmed (80 °C) 1% citric acid (50 ml) to weighed BC samples (2.5 g) in 250-ml test tubes. The solutions were heated (DK 20 Heating Digester VELP SCIENTIFICA, Italy) to 80 °C for 10 min and shaken. This procedure was repeated three times. The resulting sample was filtered through high-quality filter paper (KA2, pore size 10–25 μm) and poured into a 50-ml flask. The concentration in solution was measured using the FAAS method. When the concentration of trace metals such as Cd, Cu, and Pb was too low to be accurately detected by FAAS, the GFAAS method was adopted.
2.5 Trace metal and dissolved organic carbon leachability via up-flow
percolation test
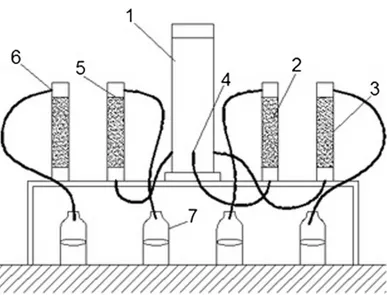
Up-flow percolation tests were performed in order to assess trace metal and DOC leachability from biochars. Figure 3 shows the apparatus that was employed for the up-flow percolation test.
Leaching behavior of Cd, Cr, Cu, Ni, Pb, and Zn from BCWC, BCLG, and BCDSS was investigated according to the methodology described in CSN P CEN/TS 14405:
Characterisation of waste—Leaching behavior tests—Up-flow percolation test (under specified conditions). Each column with a diameter of 5.5 cm was packed with BCWC,
BCLG, and BCDSS to a height of 27.4±0.5 cm. The leachant (i.e. deionized water) was forced through each column from the bottom to the top at approximately 12 ml/h, and the eluate was collected in glass bottles by means of plastic tubes. The leachant was circulated upward in order to displace air from pores and to minimize preferential flow in the packed material (Mohanty and Boehm 2015).
For FAAS or GFAAS analysis, about 50 ml of the eluate from the collected sample was filtered through sterile Acrodisc syringe filters with a Supor (hydrophilic polyethersulfone) membrane and pore size 0.45 μm (Pall Corporation). Trace metals (Cd, Cr, Cu, Ni, Pb, and Zn) were determined by FAAS or GFAAS analysis. All the procedures were carried out in accordance with the methods mentioned in ISO 8288: Water quality—Determination of
methods; ISO 9174: Water quality—Determination of chromium—Atomic absorption spectrometric methods.
The eluate collected during the up-flow percolation test of BCWC and BCLG at liquid to solid (L/S) ratios equal to 1, 3, and 5 l/kg dry weight (DW) was analyzed for EC, pH and DOC measurements. DOC measurements were taken only in the eluates collected from the up-flow percolation test performed on BCWC450, BCWC700, BCLG450, and BCLG700. These BCs were selected for testing DOC leaching behaviour because of the TC analysis results that are discussed in the results section.
The first volume of eluate equal to a cumulative L/S ratio of 1 l/kg DW (i.e. 0.137, 0.131, 0.210, 0.317 litres of eluate from BCWC450, BCWC700, BCLG450, and BCLG700, respectively) was not analysed for DOC. At the beginning of the column leaching test (i.e. until L/S ratios of 0.1 or 0.5 l/kg DW), labile species may be rapidly released by the tested material with the resulting elution curve showing a first flush behaviour (Van der Sloot and Dijkstra 2004). DOC measurements were taken for the eluate collected at L/S ratios equal to 1, 3, and 5 l/kg DW, thus not considering the fraction of DOC in BCLG and BCWC that is subject to rapid washout.
For DOC analysis, samples of about 40 ml volume were taken from the eluate collected during the up-flow percolation test. After filtering the samples through a syringe (pore size
Fig. 3 The setup of the up-flow percolation test. 1—column containing the leachant; 2—
material to test; 3—column; 4—leachant inlet; 5—top layer of material to test; 6— leachate outflow; 7—bottles for collecting the eluate. Retrieved from Mancinelli et al. (2016)
0.45 μm, Pall Corporation), DOC was determined by employing a total organic carbon (TOC) analyzer (Shimadzu–V CSN).
EC and pH were measured immediately after sampling on the whole water sample. EC was measured with a conductivity meter (inoLab Cond 740 WTW) in accordance with the methodology of ISO 7888: Water quality – Determination of electrical conductivity. pH was measured with an electronic glass electrode (SevenMulti ion/pH/ORP module Mettler Toledo) after calibrating the pH-meter as described above for the pH determination of the feedstock. pH measurements were carried out in accordance with the methodology described in ISO 10523: Water quality – Determination of pH.
Changes in DOC levels of USWR after up-flow percolation tests with PB and BCPB were investigated by the means of the apparatus shown in Figure 3.
Two impervious surfaces were selected to represent an urban environment and to deliver USWR samples supposed to be characterized by different chemical parameters because of differences in material composition and usage (Göbel et al. 2007). The two impervious surfaces were in the premises of Vilnius Gediminas Technical University, in Saulėtekio Street, Vilnius, Lithuania. USWR samples were collected from the downspouts of a roof of a building located along Saulėtekio Street (54° 43′ 27.70′′ N, 25° 20′ 03.70′′ E). The gutters, the downspouts, and the roofing material are all made of galvanized metal. USWR samples were collected from a ditch along a pathway in a pedestrian zone (54° 43′ 15.56′′ N, 25° 20′ 15.35′′ E). The ditch drains the USWR coming from a meadow and a pathway surface. Both the ditch and the pathway are made of concrete.
USWR samples were collected during two storm events on 29 May and 7 June 2017. The characteristics of the monitored rainfall events, the flow-rate measured during the sampling of USWR, and the measured chemical parameters are shown in Table 2.
The meteorological data were provided by the meteorological station of Vilnius University located in Vilnius (54° 40′ 58.39′′ N, 25° 15′ 38.23′′ E), being about 6 km far from the sampling sites. USWR samples were collected manually by taking grab samples directly from the drainage flow. Sequential sampling was performed collecting multiple samples (about 5 l each) in pre-cleaned polyethylene bottles till the cumulative volume of 25 l was reached for each site. Measurements of the flow-rate of the runoff water were done at the time of sampling according to Spurlock (1999).
Each column was packed with 100 g DW of PB, BCPB300, BCPB450, and BCPB700 (Fig. 3). The whole water samples (i.e. USWR samples from the roof and pathway surface) were utilized as leachant for up-flow percolation tests. Up-flow percolation tests were performed in duplicate for each type of leachant for each type of material. Eluates were collected at L/S ratios equal to 0.5, 1, 2, 3, and 5 l/kg DW equivalent to the volume of 50, 100, 200, 300, and
500 ml, respectively. The leachant was circulated upward to assure thorough contact between the DOC in the leachant and the surface of BC (Iqbal et al. 2015).
The USWR samples and the eluates from PB and BCPB were characterized for water chemical parameters (i.e. pH, EC, and DOC concentrations). EC and pH were determined immediately after sampling on the whole water sample (i.e. samples of USWR and the eluates). For determination of EC and pH in USWR samples, an aliquot of 100 ml was retrieved from each sub sample of about 5 l each. EC was measured with a conductivity meter (inoLab Cond 740 WTW) in accordance with the methodology of ISO 7888: Water
quality – Determination of electrical conductivity. pH was measured with an electronic
glass electrode (SevenMulti ion/pH/ORP module Mettler Toledo) after calibrating the pH-meter with buffer solutions as previously described for pH analysis of the feedstock. pH measurements were carried out in accordance with the methodology described in ISO
10523: Water quality – Determination of pH. After EC and pH determinations, the USWR
and the eluate samples were vacuum filtered, 0.45-m pore size cellulose acetate filter (Prat-Dumas), and stored in the dark at 4 °C till DOC analysis. DOC was determined by employing a TOC analyzer (Shimadzu–V CSN).
2.6 Quality assurance
For quality assurance, measurements were repeated three times. If not specified, samples from BCWC, BCLG, and BCDSS were prepared in duplicate. If not specified, samples from
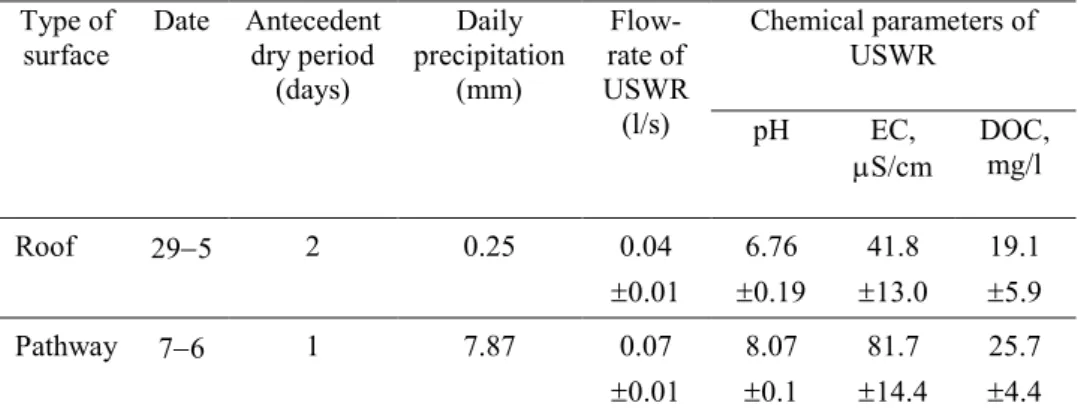
Table 2 Rainfall conditions, flow-rate and chemical parameters measured in the urban
storm-water (USWR) runoff samples collected during two storm events on 29 May and 7 June 2017 Type of surface Date Antecedent dry period (days) Daily precipitation (mm) Flow-rate of USWR (l/s) Chemical parameters of USWR pH EC, S/cm DOC, mg/l Roof 295 2 0.25 0.04 0.01 6.76 0.19 41.8 13.0 19.1 5.9 Pathway 76 1 7.87 0.07 0.01 8.07 0.1 81.7 14.4 25.7 4.4 Flow-rates and chemical parameters are shown as the mean value (n = 5) standard deviation. EC – electrical conductivity; DOC – dissolved organic carbon
BCPB were prepared in triplicate. Standard solutions of Cd, Cr, Cu, Ni, Pb and Zn (1000 ppm) (Buck Scientific, USA) were used for FAAS or GFAAS calibration. All the chemicals used in this study were of analytical grade and the solutions were prepared with deionised water. Concentrated nitric (65 %) and hydrochloric (35 %) acid was employed for the digestion of the samples. For GFAAS and FAAS analysis, in order to monitor for possible contaminations deriving from the sample preparation procedure, for every three samples a reagent blank was prepared following the entire sequence of steps as described above for total trace metal determination in DW. For citric acid extractable trace metal determination using the FAAS and GFAAS methods, a reagent blank was prepared following the entire sequence of steps as previously described for trace metal analysis in citric acid extraction. For pH analysis in KCl extract, a blank sample was prepared following the entire sequence of steps as described for pH analysis. For the up-flow percolation test, two blanks were collected from a column filled with the leachant (i.e. deionised water) following the steps described in CSN P CEN/TS 14405.
For DOC determination in BCWC, BCLG, and BCDSS, two blank samples were prepared following the entire sequence of steps, as described for DOC analysis.
To check for any possible DOC contamination during field sampling and travel to the laboratory, on each sampling site a container for collecting USWR was filled with deionized water and transferred to the laboratories for DOC analysis. Aliquots of field blanks were subsequently utilized for testing possible additional contamination of DOC from laboratory equipment, filling an empty column of the up-flow percolation test apparatus with aliquots of field blanks and preparing two blank samples following the entire sequence of steps as described for the up-flow percolation test. In each sample the coefficient of variance of the measurements of DOC was under 2 %.
2.7 Calculation and statistical analysis of experimental data
Statistical analysis was carried out using Excel (Microsoft, USA) and MATLAB R2016b (Mathworks, USA). The descriptive statistics of the data were defined by calculating the mean and standard deviation (St. Dev.) values for the observations with n ≥ 3.
Analysis of variance (ANOVA) was used to test differences between the data obtained in the present research study. Two-way ANOVA was performed to evaluate significant differences between the physical and chemical parameters (i.e. measurement value) grouped depending on the types of feedstock (i.e. WC, LG, and DSS) or the pyrolysis temperatures (i.e. 450, and 700 °C). Comparisons between the physical and chemical parameters and the types of material (i.e. PB, BCPB300, BCPB450, and BCPB700) were carried out suing two-way ANOVA. Differences were reported as significant (p < 0.05) or non-significant (p > 0.05).
When the Bartlett test rejected the null hypothesis that the data come from normal distribution with equal variance, Welch’s t-tests were evaluated for the null hypothesis that two groups have equal means at 5 % significance level.
To evaluate possible relations among the water chemical parameters (i.e. pH, EC, and DOC concentrations) measured in the eluate samples of the up-flow percolation tests with USWR, relations were determined by step-wise linear regression with slope and intercept considered significant at p ≤ 0.05.
The analysis of the blank samples showed that elements such as Cd (0.0003 mg/l), Cr (0.2 mg/l), and Pb (0.0317 mg/l) had a mean concentration above the detection limit. Therefore, for the computation of the concentration C (mg/kg DW) of metals in DW, a correction was applied by subtracting the mean concentration detected in the blank analysis B (mg/l) from that obtained in the analysis of the digested ashes A (mg/l), as follows:
= − × ×
(1)
where D is the dilution factor equal to 10 applied for the determination of Zn using the FAAS method and Cd using the GFAAS method both for the analyzed types of feedstock and for the biochar; V is the final volume, ml; m is the dry weight mass of the sample, g.
BC yield (Y) was calculated according to Lu et al. (2015), as follows: , % = ×
(2)
where W1 is the dry weight mass of the feedstock (g); and W2 is the dry weight mass of biochar (g).
In order to assess the ability of the pyrolysis process to concentrate the trace metals in the produced BCs (i.e. BCWC, BCLG, and BCDSS), the retention rate (RR) of trace metals in BCs was calculated as the ratio of trace metal concentration in BCs (C2, mg/kg DW) and the respective feedstock (C1, mg/kg DW) (Lu et al. 2015), according to the following equation:
�� = � � � , % = × ×
(3)
As far as the up-flow leaching test is concerned, for each set L/S ratio, the cumulatively released quantity (∑Ui) of an element, mg/kg DW, were calculated for analysis in the eluate fraction as described below:
∑ �=∑ �× �
(4) where: Vi– volume of the eluate fraction, l; i – index of the eluate fraction from 1 to 7; Ci – concentration of the analysed element in the eluate fraction mg/l; mo – dry mass of the test portion in the column, kg.
When the concentration of a studied element in an eluate fraction was below the detection limit the values were displayed as the upper limit (i.e. Ui is calculated considering Ci equal to the detection limit) and the lower limit (i.e. Ui is calculated considering Ci equal to zero) (CSN P CEN/TS 14405).
Carbon loss (Closs, %) (i.e. the content of carbon of the feedstock that is not retained in the
biochar during pyrolysis) resulting from pyrolysis of PB at different peak temperatures was calculated using the equation adapted from Zhao et al. (2014), as follow:
����= [ − ( × ×× )] ×
(5) where W1 is the dry weight mass of the feedstock, g; TC1 and TC2 is the total carbon content
of the feedstock and the biochar, respectively, %; Y is the BC yield defined in equation (2), %.
The dissolved organic carbon (DOC; g/kg) contents of BCs and PB were calculated using the following equation adapted from Jamieson et al. (2014):
= ×
(6)
where V – volume of deionized water utilized as extractant, l; M – dry mass of biochar, g; C – measured concentration of DOC in the sample, mg/l. DOC concentrations measured in the samples prepared from BCWC, BCLG, and BCDSS were corrected by subtracting the mean concentration (20.4 mg/l), as measured in the blank samples.
The cumulative released quantity (∑� �) of DOC expressed as a percentage of total carbon content of BCWC and BCLG was calculated as follows: