Running Head: Social reciprocity at different levels Article type: Research paper
Title: A statistical procedure for testing social reciprocity at group, dyadic and individual levels
Authors: David Leiva, Antonio Solanas and Lluís Salafranca
Affiliation: Department of Behavioural Sciences Methods, Faculty of Psychology; University of Barcelona
Corresponding author: David Leiva, Departament de Metodologia de les Ciències del Comportament, Facultat de Psicologia, Universitat de Barcelona, Passeig de la Vall d’Hebron, 171, 08035-Barcelona, Spain. Electronic mail may be sent to David Leiva at: [email protected]
Abstract
This paper examines statistical analysis of social reciprocity, that is, the balance between addressing and receiving behaviour in social interactions. Specifically, it focuses on the measurement of social reciprocity by means of directionality and skew-symmetry statistics at different levels. Two statistics have been used as overall measures of social reciprocity at group level: the directional consistency and the skew-symmetry statistics. Furthermore, the skew-symmetry statistic allows social researchers to obtain complementary information at dyadic and individual levels. However, having computed these measures, social researchers may be interested in testing statistical hypotheses regarding social reciprocity. For this reason, it has been developed a statistical procedure, based on Monte Carlo sampling, in order to allow social researchers to describe groups and make statistical decisions.
1. Introduction
Social reciprocity is considered a significant issue in social interaction research and it has been studied in a broad set of substantive areas that include clinical and health psychology, child development and organizational psychology (Miller and Byrnes, 1997; Liang et al., 2001; Dabos and Rousseau, 2004; Howe and Recchia, 2005; Väänänen et al., 2005). Social researchers have dealt widely with the study of dyadic interactions, that is, the set of interdependent interactions between pairs of individuals in groups. In this regard, classical studies conducted in social psychology included sociometric data in order to quantify dyadic interactions (Moreno, 1934; Forsyth and Katz, 1946). Organizing dyadic data in two-way matrices is especially useful when researchers are interested in studying group social dynamics. Here, social researchers may be interested in studying several levels of association (Malloy and Albright, 2001), and it is for this reason that descriptive measures and statistical tests at different levels of analysis are needed to analyze social interaction.
Since round robin designs are frequently used to gather interaction data (for more details about other designs in social interaction analysis, see Kenny et al., 2006), this study deals specifically with this design type. In round robin designs, dyadic data are obtained for all possible pairs of individuals in the given groups. It should be highlighted that round robin designs have been widely used in the study of social reciprocity (Warner et al., 1979; Kenny and Nasby, 1980; Whitley et al., 1984; Hemelrijk, 1990a, b) and social dominance (Rapoport, 1949; Landau, 1951; Appleby, 1983; de Vries, 1995, 1998).
Several statistical techniques have been proposed to quantify social reciprocity at group, dyadic and individual levels. For instance, in order to obtain group measures of social reciprocity, two quantifications can be used: the directional consistency (DC; van Hooff
and Wensing, 1987) and the skew-symmetry (Solanas et al., 2006) statistics. The directional consistency statistic quantifies the directionality in social interactions and is based on absolute differences between individuals’ dyadic measurements. The skew-symmetry statistic (Φ) is a measure of social reciprocity at group level and is mainly founded on the skew-symmetric part of a sociomatrix. While the former index takes into account absolute discrepancies between dyadic measurements, the latter considers the squared differences. Additional measures can also be obtained from the skew-symmetry statistic to quantify dyadic and generalized reciprocity, denoted respectively by κ and ε. As a complement to this, social researchers may compute the symmetric part of a sociomatrix to quantify social reciprocity and, thus, obtain the symmetry statistic, denoted by Ψ (Solanas et al., 2006).
In order to highlight the main differences between the DC and skew-symmetry statistic, it should be borne in mind that dyadic quantifications of social reciprocity can be obtained by means of the skew-symmetry statistic (e.g. dyadic decomposition of the skew-symmetrical part, υi←j/υj). In addition, social researchers can also obtain individual
contributions to the symmetrical part in the group (e.g. contribution to skew-symmetry of individual j, υj). These additional decompositions have not been developed
for the DC statistic. Therefore, the skew-symmetry statistic enables social researchers to analyze groups at global, dyadic and individual levels, while the DC only allows an overall measure of social reciprocity to be obtained.
Once social researchers have obtained different group social reciprocity measurements, they may need to make decisions regarding their statistical significance. For this reason, they might be interested in taking decisions about social reciprocity at group, dyadic and individual levels. A statistical procedure has been proposed for experimental and natural settings in social psychology in which a Monte Carlo sampling procedure is
used to test social reciprocity at group level (Leiva et al., 2008). Note that other statistical tests would be needed for making decisions at dyadic and individual levels. Therefore, the main aim of this study is to propose a statistical procedure, based on Monte Carlo sampling, for taking statistical decisions at the three levels of social reciprocity: group, dyadic and individual. An SAS/IML program has been developed to compute these statistics and to provide statistical significance. This program is available for researchers that might be interested on request from the authors.
2. A procedure for testing social reciprocity at different levels of analysis
As discussed above, the directionality and skew-symmetry statistics enable social researchers to describe groups at individual, dyadic and group levels. Nevertheless, they may also be interested in taking statistical decisions regarding null hypotheses, but the exact distributions for directionality and skew-symmetry statistics have not been analytically derived. For this reason, a computer-intensive method is proposed for estimating sampling distributions for directionality and skew-symmetry statistics at different levels.
Monte Carlo sampling is used here to test the null hypothesis that a sample was randomly drawn from a specified population. In Monte Carlo sampling, simulated samples are drawn from a specified population and statistical values of simulated samples are compared to the outcome (Noreen, 1989). That is, the outcome can be located in the estimated sampling distribution. Therefore, we propose a Monte Carlo procedure for testing any null hypothesis regarding directionality and skew-symmetry in sociomatrices.
The mathematical model that underlies this procedure requires three assumptions. The first one states that the probability of the event whereby “individual i addresses
behaviour to individual j” (pij) remains constant during the observation period. This
assumption is necessary for round robin designs since they imply different occasions of interaction across time and these interactions are aggregated in a sociomatrix (Warner et al., 1979; Boyd and Silk, 1983; Tufto et al., 1998; Adams, 2005; Kenny et al., 2006). The second assumption refers to the independence between successive encounters (Appleby, 1983; Boyd and Silk, 1983). As the procedure uses aggregated data, it is not possible to estimate the dependence from the data at hand. This premise is also applicable to the Social Relations Model (SRM; Warner et al., 1979) as the order effects cannot be controlled (Kenny et al., 2006). The independence between successive interactions permits the distribution of Xij to be modelled by a binomial distribution with
parameters cij and pij, where cij denotes dyadic interaction frequency between individuals
i and j. This probabilistic approach has been used in social interactions studies (Tufto et al., 1998). The third assumption states that dyads are independent. This is another frequent supposition in statistical methods applied to social interaction, for instance, the SRM (Warner et al., 1979; Kenny et al., 2006). According to this assumption the dyad is the unit of analysis and the relationship between the pair of individuals is only a function of what occurs in each dyad, independently of the other individuals’ interactions.
The Monte Carlo sampling explained below generates sociomatrices according to parameters pij, the particular values of which depend on the specific null hypothesis to
be tested in applied research. The procedure also requires the following values: cij and n
(group size). The outcomes calculated for the original sociomatrix are located in their respective sampling distributions, a comparison that allows p values to be obtained (i.e., statistical significance level).
Below we describe the Monte Carlo sampling procedure to estimate statistical significance for the directionality and skew-symmetry statistics at different levels of analysis:
1) Select a test statistic. As discussed above, we are interested in quantifying and making decisions regarding social reciprocity by means of directionality and skew-symmetry statistics at different levels of analysis. The Monte Carlo sampling will be carried out for each statistic in order to obtain its statistical significance.
2) Define the population. Social researchers should specify several aspects in order to carry out the Monte Carlo sampling. Specifically, they should specify the amount of behaviour per dyad (cij) and the symmetry level in dyads under the null hypothesis (pij).
The matrix C with the dyadic interaction frequencies (cij) will be specified when the
original sociomatrix is defined. Matrix π with the parameters pij is specified in this step.
The procedure is flexible and can be applied to any null hypothesis, but social researchers might be mainly interested in testing the null hypothesis of complete reciprocation, which states that dyadic relations are symmetrical among all individuals (pij = 0.5). The following expression corresponds to this null hypothesis:
0: ij ji; , 1, 2,3, , ;
H p p i j n i j and i j
Thus, the following matrix π states the null hypothesis for which complete
reciprocation exists in a group:
0 0.5 0.5 0.5 0 0.5 0.5 0.5 0 Π
3) Input the original sample. In this case, social researchers should input the original sociomatrix X. Once the original sociomatrix is specified, the matrix C can be obtained. As cij = xij + xji, the matrix C is symmetrical.
4) Compute the outcome. That is, the DC and Φ statistics for the original sociomatrix, as well as the other measures at dyadic and individual levels, are calculated.
5) Set NS. In this step social researchers have to specify the number of simulated sociomatrices in order to estimate sampling distributions. For instance, NS = 99,999. Thus, a sampling distribution with 99,999 pseudostatistics will be estimated for all statistics.
6) Set iter and nsc counters to 0. The iter counter controls the iterations during the process. Additionally, the nsc counter corresponds to the number of significant cases and allows statistical significance to be computed in the final step.
7) Draw a sample from the specified population and compute its pseudostatistic. Statistics at different levels are computed for this drawn sociomatrix. Then compare these pseudostatistics with the outcomes. This comparison allows us to compute the number of significant cases. The computation of nsc depends on the statistic, for instance, the significant cases when testing the skew-symmetry statistic at group level (Φ) are the number of simulated matrices that have a value of this statistic greater than or equal to the Φ statistic corresponding to the original matrix. A further description of the measures and the computation of their corresponding nsc is shown in Table I. For instance, if a pseudostatistic Φ is as large as or larger than the real Φ value then add 1 to the nsc counter and then go to step 8). Otherwise, if this pseudostatistic is lower than the original value then go directly to the next step.
8) Add 1 to the iter counter and repeat step 7) till the iter counter equals NS. For instance, if NS is set as being equal to 99,999, step 7) will iterate until iter equals 99,999.
9) Compute the significance level. In order to obtain statistical significance, p value is computed as (nsc + 1) / (NS + 1), where NS equals the number of the matrices generated and nsc is the number of significant cases. This is a valid statistical test as it ensures that the original statistic is among the set of simulated statistics, thus, p value can never be smaller than 1 / rep (Noreen, 1989; Onghena and May, 1995; Manly, 2007).
As discussed above, social researchers are often interested in testing the complete reciprocation hypothesis. However, other hypotheses could be tested as the procedure allows researchers to specify any probability values corresponding to different degrees of social reciprocity, taking into account the constraint that probabilities within any dyad, pij and pji, always are equal to 1.
3. Illustrative examples
3.1 Example I: Analyzing social interaction in groups of captive primates
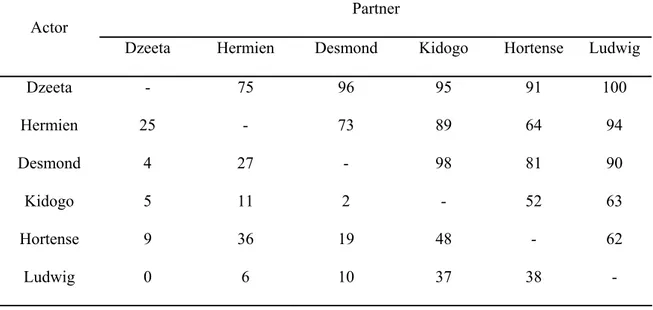
The first example is taken from Vervaecke et al. (1999). In this paper dyadic encounters in a group of six captive bonobos were studied. This sociomatrix was originally used for ordering individuals into ranks, specifically into competitive rank orders in a feeding context. The directional consistency index was also obtained by means of this experimental dyadic test, but no statistical inference related to this index was included. Table II shows the sociomatrix that contains the feeding scores, that is, each cell xij
represents the number of times that the ith individual takes food when the jth individual is present. INSERT TABLE II INSERT TABLE I ABOUT HERE ABOUT HERE
On the basis of the procedure presented here, researchers can obtain some information about the social reciprocity level in the group, the presence of significant patterns of skew-symmetry at the individual level and the statistical significance of several measures at the dyadic level. The results from the analysis at the group level give social researchers some evidence about the non-reciprocal style in social interactions. The empirical value of the DC index was found to be statistically significant (DC = 0.631; p < 0.01). Similar results were found for the skew-symmetry index (Φ = 0.328; p < 0.01). Note that the DC and the skew-symmetry statistics range from 0 to 1 and from 0 to 0.5, respectively.
Table III contains the results from the individual analysis of social reciprocity. Focusing on the normalized measurement of skew-symmetry for each individual (υj), that is, the
individuals’ contributions to the skew-symmetry weighted by their degree of activity, it can be noted that all individuals in the group show statistically significant asymmetrical relationships (p < 0.01). The following rank order was achieved after ordering individuals according to the magnitude of their asymmetrical relationships values (υj):
Dzeeta, Desmond, Ludwig, Kidogo, Hermien and Hortense. These results partially concur with the rank order obtained by means of the dyadic tests in the original study conducted by Vervaecke et al. (1999), as Dzeeta occupied the highest dominance rank and also showed the largest skew-symmetrical value.
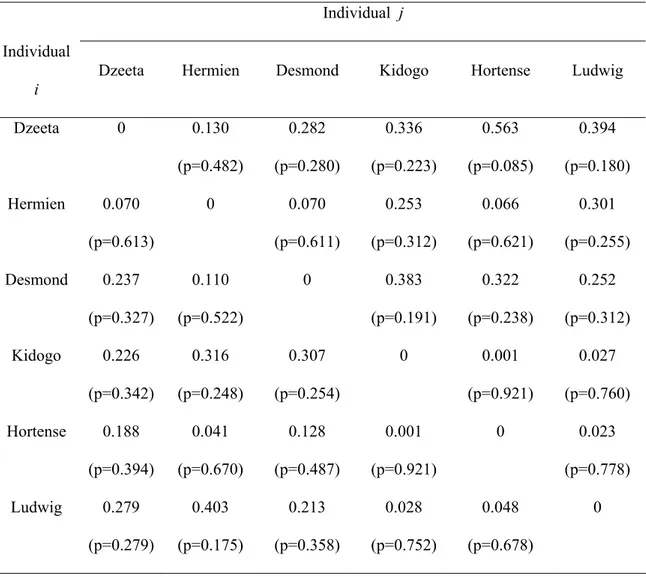
As can be seen in Table IV, there are no significant differences from the simulated statistics under the null hypothesis for the decomposition of υj into partner’s
contributions. Hence, there exists a skew-symmetrical pattern in the overall functioning of the group, but this pattern is not explained by specific dyadic relationships. In other words, all individuals were skew-symmetrical in their interactions regardless of who the partner was. INSERT TABLE INSERT TABLE III ABOUT HERE IV ABOUT HERE
The descriptive measure of generalized reciprocity obtained by means of the skew-symmetrical part (ε = 0.896; p < 0.01) confirms the previous conclusions but not the dyadic reciprocity quantification (κ = 0.789; p = 0.738). Consequently, there is a match between the proportion of skew-symmetry that individuals addresses and receives within the dyads (dyadic reciprocity), but this match is not present in the global performance of individuals (generalized reciprocity). These results seem to be related to the existence of the dyadic hierarchical relations in the group. In other words, individuals within a dyad consistently behave in a skew-symmetrical manner. For instance, if one primate frequently takes the food in the presence of its partner in the dyad, the second one will not obtain the food in most trials. Accordingly, there will be a skew-symmetrical relation between them since the dominant individual is responsible for a significant part of the skew-symmetrical behaviour of the submissive individual and vice versa. In the case of the lack of generalized reciprocity, this may point to the fact that there are circular triads in the group.
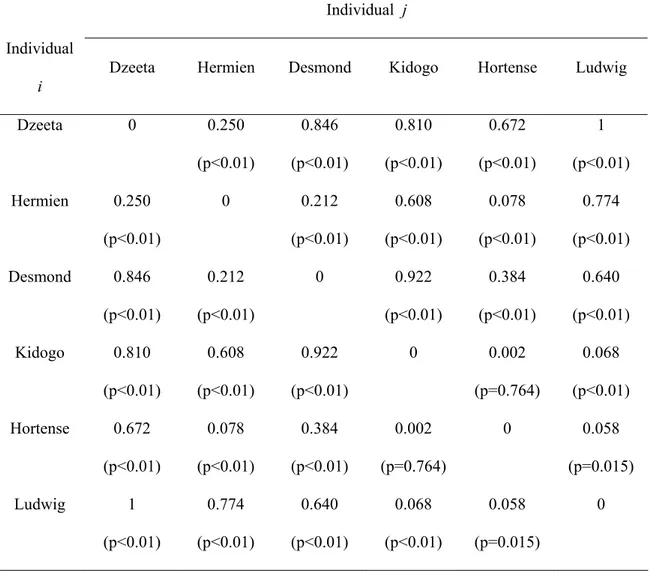
Nevertheless, when matrix Ω is analyzed (Table V), that is, the balanced dyadic reciprocity (see Solanas et al., 2006), all dyads appear to be non reciprocal with the exception of the dyad formed by Hortense and Kidogo (ωi←j = 0.002; p = 0.764). This
means that these two individuals show a high level of similarity in their relationship. This index quantifies dyadic reciprocity as a balance between the individuals’ contribution to skew-symmetry and symmetry. That is, the index resembles the discrepancies between observed behaviours, but it expresses similarities between 0 and 1.
To summarize, the group shows asymmetrical relations at the overall level; there is only one pair of individuals for whom the relationship is practically symmetrical if the dyadic level is considered; skew-symmetry in dyadic relations is not due to any one
particular individual; all individuals show significant levels of skew-symmetry in their relationships at the individual level; pairs of individuals seem to adjust their mutual level of skew-symmetry in a reciprocal way (dyadic reciprocity); and there is no match between individuals’ skew-symmetrical pattern as actors and partners (lack of generalized reciprocity).
3.2 Example II: Analyzing social reciprocity in aggressive patterns in a human group
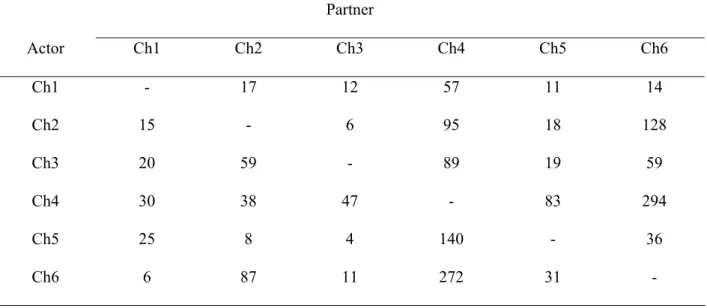
The second example is a sociomatrix taken from Kenny et al. (2007). In this study, a group of six third-grade children is observed in order to quantify the dyadic aggression during play interactions. Table VI shows the sociomatrix of the aggression data. In this matrix, rows represent number of aggressions initiated by individuals (actor) and columns show the number of aggressions that each child receives from the others (partner). By means of the proposed procedure researchers would be able to determine whether a significant skew-symmetrical pattern in the children’s aggression exists, as well as obtaining information about the individual and dyadic levels in this social psychology study.
By means of a Monte Carlo test with 99,999 randomizations we found that the directional consistency statistic was significant (DC = 0.236; p < 0.01). A similar result was found in the case of the skew-symmetry statistic (Φ = 0.034; p < 0.01). Consequently, a non reciprocal pattern in aggressive behaviour can be observed in the group. This means that there will be at least one individual who mainly behaves more aggressively than the others.
INSERT TABLE VI ABOUT HERE
Table VII shows the normalized contributions to symmetry and skew-symmetry (λj and
skew-symmetrical part was found for all individuals (p < 0.01), although they can be ordered as follows: Ch3 > Ch2 > Ch1 > Ch5 > Ch4 > Ch6. Note that individuals 2 and 3 show a larger skew-symmetrical pattern in comparison to that shown by the other children in the group.
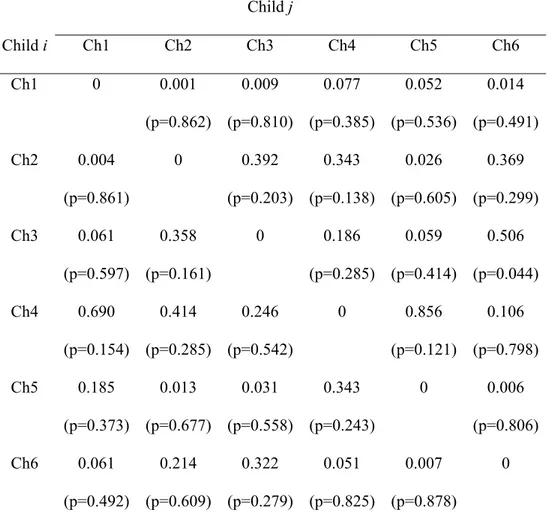
As can be noted in Table VIII, there is only one dyadic relation for which the skew-symmetry of a child can be mainly explained by her/his relation to another. Specifically, the skew-symmetrical pattern shown by child 6 can mainly be assigned to her/his interactions with child 3 (υCh3←Ch6/υCh6 = 0.506; p = 0.044). No other significant dyadic
pattern was found in the group. That is, the normalized skew-symmetrical part of each individual regarding the aggressive dyadic interaction cannot be explained by any specific dyadic relationship.
When analyzing the generalized and dyadic reciprocity indices regarding the skew-symmetrical part, a non significant effect was found (ε = 0.330; p = 0.536 and κ = 0.673; p = 0.632, respectively). Therefore, the proportion of skew-symmetry given and received at group level or at dyadic level is similar among the individuals. That is, children who mainly behave in a skew-symmetrical way towards others are also responsible for skew-symmetry in the others. For instance, if a child is the main aggressor in the group and also the less threatened individual, she/he will be the individual that induces others to be more helpless. Complementarily, children who tend to be non-aggressive will receive a larger number of aggressions from more aggressive children. This reciprocal pattern in the skew-symmetrical part may be related to bullying. INSERT TABLE VII ABOUT HERE INSERT TABLE VIII ABOUT HERE
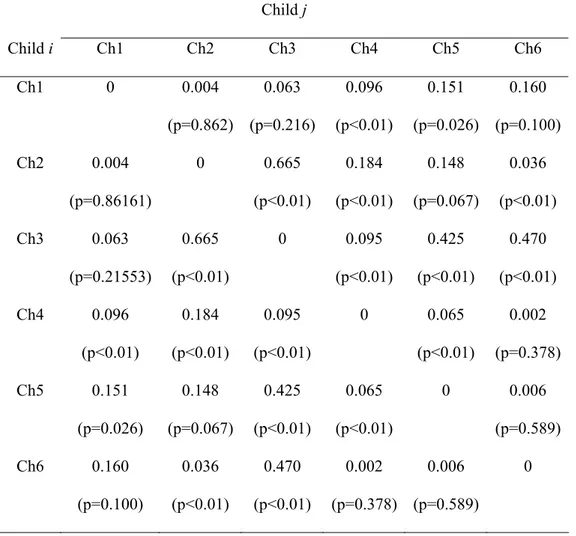
When analyzing matrix Ω, 6 out of the 15 dyads were found to be very similar in their relationships (p > 0.05). Specifically, the dyads Ch1-Ch2, Ch1-Ch3, Ch1-Ch6, Ch2-Ch5, Ch4-Ch6 and Ch5-Ch6 show social reciprocity (Table IX). It should be noted that
these results are confirmed when observing the empirical sociomatrix. In the dyads described above there exists a balance between aggression addressed and received by individuals.
To conclude, there is no symmetry at the group level; there are six dyads in which the relationships are reciprocal; the skew-symmetry of child 6 is explained by her/his particular relationship with child 3; all children show significant levels of skew-symmetry; there is an adjustment between individuals’ skew-symmetrical pattern at dyadic and group levels (dyadic and generalized reciprocity).
INSERT TABLE IX ABOUT HERE 4. Summary
Social researchers have to take into account several levels of analysis when measuring social reciprocity in groups. The present study deals with this important aspect in social research. Note that neither the original work in which the directional consistency statistic was proposed (van Hooff and Wensing, 1987) nor the original work regarding the skew-symmetry statistics (Solanas et al., 2006) dealt with statistical inference. For this reason, several statistical tests have been proposed here for testing social reciprocity at different levels. Specifically, Monte Carlo sampling has been used to estimate sampling distributions for individual, dyadic and group statistics. Then, social researchers can locate the empirical value in the corresponding sampling distribution and obtain its statistical significance. Although any null hypothesis could be used when simulating sociomatrices, the complete reciprocation hypothesis may be the most relevant one for social researchers. In this sense, it seems to be more feasible to state that all individuals have the same probability of addressing behaviour within a dyad as this seems to be the most significant hypothesis regarding social reciprocity. However,
this statistical procedure can be used for testing any other hypothesis depending on the substantive interest of social researchers.
Given that no statistical software has been developed for testing social reciprocity at different levels of analysis, we have developed an SAS/IML program that allows social researchers to carry out the computation and the related statistical tests proposed here. First, the program computes the DC and several measures of skew-symmetry at individual, dyadic and group levels for any sociomatrix. Once the empirical measures are computed, social researchers can obtain statistical significance regarding these quantifications by means of a Monte Carlo sampling.
These statistical tests have been demonstrated by applying them to several published sociomatrices. This procedure allows social researchers to obtain complementary information regarding social reciprocity at different levels of analysis. For instance, researchers are able to determine the main contributors to skew-symmetry in groups, different patterns of dyadic interactions and similarities in social relationships.
The procedure proposed in this paper can be useful when analyzing dynamics in human and non human groups, organizations or any group of agents in which interactions are registered. Both observational and experimental settings in social interaction research can be studied by means of the social reciprocity measures presented here and appropriate statistical tests can be conducted in order to make decisions regarding this aspect of group dynamics.
To sum up, although more research is needed to obtain exact sampling distributions, the Monte Carlo sampling described in our study enables social researchers to obtain statistical significance for global, dyadic and individual measures of social reciprocity.
We would like to thank Dr. Hilde Vervaecke and Dr. Antonius Cillessen for giving us their permission to reuse part of their data in the present work. This research was partially supported by the Ministerio de Educación y Ciencia, grant SEJ2005-07310-C02-01/PSIC, and by the Comissionat per a Universitats i Recerca of Departament d’Innovació, Universitats i Empresa of the Generalitat de Catalunya and the European Social Fund, grants 2005SGR00098 and 2008FIC00156.
6. References
Adams, E. S.: Bayesian analysis of linear dominance hierarchies. Anim Behav 69: 1191–1201 (2005)
Appleby, M. C.: The probability of linearity in hierarchies. Anim Behav 31: 600–608 (1983)
Boyd, R., Silk, J. B.: A method for assigning cardinal dominance ranks. Anim Behav 31: 45–58 (1983)
Dabos, G. E., Rousseau, D. M.: Mutuality and reciprocity in the psychological contracts of employees and employers. J Appl Psychol 89: 52–72 (2004)
de Vries, H.: An improved test of linearity in dominance hierarchies containing unknown or tied relationships. Anim Behav 50: 1375–1389 (1995)
de Vries, H.: Finding a dominance order most consistent with a linear hierarchy: a new procedure and review. Anim Behav 55: 827–843 (1998)
Forsyth, E., Katz, L.: A matrix approach to the analysis of sociometric data: Preliminary report. Sociometry 9: 340–347 (1946)
Hemelrijk, C. K.: A matrix partial correlation test used in investigations of reciprocity and other social interaction patterns at group level. J Theor Biol 143: 405–420 (1990a)
Hemelrijk, C. K.: Models of, and tests for, reciprocity, unidirectionality and other social interaction patterns at a group level. Anim Behav 39: 1013–1029 (1990b)
Howe, N., Recchia, H.: Playmates and teachers: reciprocal and complementary interactions between siblings. J Fam Psychol 19: 497–502 (2005)
Kenny, D. A., Kashy, D. A., Cook, W. L.: Dyadic data analysis. Guilford Press, New York (2006)
Kenny, D. A., Nasby, W.: Splitting the reciprocity correlation. J Pers Soc Psychol 38: 249–256 (1980)
Kenny, D. A., West, T. V., Cillessen, A. H. N., Coie, J. D., Dodge, K. A., Hubbard, J. A., et al.: Accuracy in the judgment of aggressiveness. Pers Soc Psychol Bull 33: 1225–1236 (2007)
Landau, H. G.: On dominance relations and the structure of animal societies: I. Effect of inherent characteristics. Bull Math Biophys 13: 1–19 (1951)
Leiva, D., Solanas, A., Salafranca, Ll.: Testing reciprocity in social interactions: A comparison between the directional consistency and skew-symmetry statistics. Behav Res Meth 40: 626–634 (2008)
Liang, J., Krause, N. M., Bennett, J. M.: Social exchange and well-being: Is giving better than receiving? Psychol Aging 16: 511–523 (2001)
Malloy, T. E., Albright, L.: Multiple and single interaction dyadic research designs: Conceptual and analytic issues. Basic Appl Soc Psychol 23: 1–19 (2001)
Manly, B. F. J.: Randomization, bootstrap and Monte Carlo methods in Biology, 3rd edn. Chapman and Hall, Boca Raton (2007)
Miller, D. C., Byrnes, J. P.: The role of contextual and personal factors in children’s risk tasking. Dev Psychol 33: 814–823 (1997)
Moreno, J. L.: Who shall survive? Nervous and Mental Disease Publishing, Washington, DC (1934)
Noreen, E. W.: Computer-intensive methods for testing hypotheses: An introduction. Wiley, New York (1989)
Onghena, P., May, R. B.: Pitfalls in computing and interpreting randomization test p values: A commentary on Chen and Dunlap. Behav Res Meth Instrum Comput 27: 408–411 (1995)
Rapoport, A.: Outline of a probabilistic approach to animal sociology: I. Bull Math Biophys 11: 183–191 (1949)
Solanas, A., Salafranca, Ll., Riba, C., Sierra, V., Leiva, D.: Quantifying social asymmetric structures. Behav Res Meth 38: 390–399 (2006)
Tufto, J., Solberg, E. J., Ringsby, T.: Statistical models of transitive and intransitive dominance structures. Anim Behav 55: 1489–1498 (1998)
van Hooff, J. A. R. A. M., Wensing, J. A. B.: Dominance and its behavioral measures in a captive wolf pack. In: H.W. Frank (ed.), Man and wolf, pp. 219–252. Junk Publishers, Dordrecht (1987)
Väänänen, A., Buunk, B. P., Kivimäki, M., Pentti, J., Vahtera, J.: When it is better to give than to receive: Long-term health effects of perceived reciprocity in support exchange. J Pers Soc Psychol 89: 176–193 (2005)
Vervaecke, H., de Vries, H., Van Elsacker, L.: An experimental evaluation of the consistency of competitive ability and agonistic dominance in different social contexts in captive bonobos. Behaviour 136: 423–442 (1999)
Warner, R. M., Kenny, D. A., Stoto, M.: A new round-robin analysis of variance for social interaction data. J Pers Soc Psychol 37: 1742–1757 (1979)
Whitley, B. E., Ward, J., Snyder, H. N.: Peer preferences in a desegregated school: A round robin analysis. J Pers Soc Psychol 46: 799–810 (1984)
Tables
Table I. Summary of some of the measures of social reciprocity provided by the SAS/IML program, their corresponding level of analysis and an explanation of the computation of the significant cases (nsc).
Statistics
Level of analysis
Computation of nsc
DC Group Greater than or equal
Φ Group Greater than or equal
Ψ Group Less than or equal
δ Group Greater than or equal
κ Group Less than or equal
ε Group Less than or equal
λj Individual Less than or equal
υj Individual Greater than or equal
υi←j/υj Dyadic Greater than or equal
Table II. Dyadic feeding scores in a group of six captive bonobos (Vervaecke et al., 1999; Brill publishers. Printed with permission).
Partner Actor
Dzeeta Hermien Desmond Kidogo Hortense Ludwig
Dzeeta - 75 96 95 91 100 Hermien 25 - 73 89 64 94 Desmond 4 27 - 98 81 90 Kidogo 5 11 2 - 52 63 Hortense 9 36 19 48 - 62 Ludwig 0 6 10 37 38 -
Table III. Statistical analysis of social reciprocity at individual level. The empirical value for the individual normalized contributions to symmetry and skew-symmetry (λj
and υj, respectively) is shown. Statistical significance for each statistic is shown in
brackets; a Monte Carlo sampling with 99,999 replications has been carried out in order to obtain these values.
λj υj Dzeeta 0.583 (p<0.01) 0.417 (p<0.01) Hermien 0.722 (p<0.01) 0.278 (p<0.01) Desmond 0.625 (p<0.01) 0.375 (p<0.01) Kidogo 0.675 (p<0.01) 0.325 (p<0.01) Hortense 0.807 (p<0.01) 0.193 (p<0.01) Ludwig 0.663 (p<0.01) 0.337 (p<0.01)
Table IV. Ratiosυi←j/υj for each dyad and their p value – shown in brackets- obtained by
means of a Monte Carlo sampling in which 99,999 random matrices were generated.
Individual j
Individual
i
Dzeeta Hermien Desmond Kidogo Hortense Ludwig Dzeeta 0 0.130 (p=0.482) 0.282 (p=0.280) 0.336 (p=0.223) 0.563 (p=0.085) 0.394 (p=0.180) Hermien 0.070 (p=0.613) 0 0.070 (p=0.611) 0.253 (p=0.312) 0.066 (p=0.621) 0.301 (p=0.255) Desmond 0.237 (p=0.327) 0.110 (p=0.522) 0 0.383 (p=0.191) 0.322 (p=0.238) 0.252 (p=0.312) Kidogo 0.226 (p=0.342) 0.316 (p=0.248) 0.307 (p=0.254) 0 0.001 (p=0.921) 0.027 (p=0.760) Hortense 0.188 (p=0.394) 0.041 (p=0.670) 0.128 (p=0.487) 0.001 (p=0.921) 0 0.023 (p=0.778) Ludwig 0.279 (p=0.279) 0.403 (p=0.175) 0.213 (p=0.358) 0.028 (p=0.752) 0.048 (p=0.678) 0
Table V. Ratios ωi←j and their p values obtained by means of a Monte Carlo sampling
with 99,999 generated random matrices.
Individual j
Individual
i
Dzeeta Hermien Desmond Kidogo Hortense Ludwig Dzeeta 0 0.250 (p<0.01) 0.846 (p<0.01) 0.810 (p<0.01) 0.672 (p<0.01) 1 (p<0.01) Hermien 0.250 (p<0.01) 0 0.212 (p<0.01) 0.608 (p<0.01) 0.078 (p<0.01) 0.774 (p<0.01) Desmond 0.846 (p<0.01) 0.212 (p<0.01) 0 0.922 (p<0.01) 0.384 (p<0.01) 0.640 (p<0.01) Kidogo 0.810 (p<0.01) 0.608 (p<0.01) 0.922 (p<0.01) 0 0.002 (p=0.764) 0.068 (p<0.01) Hortense 0.672 (p<0.01) 0.078 (p<0.01) 0.384 (p<0.01) 0.002 (p=0.764) 0 0.058 (p=0.015) Ludwig 1 (p<0.01) 0.774 (p<0.01) 0.640 (p<0.01) 0.068 (p<0.01) 0.058 (p=0.015) 0
Table VI. Sociomatrix of number of aggressive behaviours of child (Ch) i towards child j in a group of six children (in Kenny et al., 2007; Printed with permission).
Partner Actor Ch1 Ch2 Ch3 Ch4 Ch5 Ch6 Ch1 - 17 12 57 11 14 Ch2 15 - 6 95 18 128 Ch3 20 59 - 89 19 59 Ch4 30 38 47 - 83 294 Ch5 25 8 4 140 - 36 Ch6 6 87 11 272 31 -
Table VII. Some measures of individual contributions to symmetry and skew-symmetry in the group of children. Statistical tests have been carried out with 99,999 random matrices. Membership λj υj Ch1 0.915 (p<0.01) 0.086 (p<0.01) Ch2 0.899 (p<0.01) 0.101 (p<0.01) Ch3 0.803 (p<0.01) 0.197 (p<0.01) Ch4 0.9776170880 (p<0.01) 0.022 (p<0.01) Ch5 0.937 (p<0.01) 0.063 (p<0.01) Ch6 0.988 (p<0.01) 0.012 (p<0.01)
Table VIII. Dyadic ratiosυi←j/υj and their p values – shown in brackets- for the 15 dyads in the group. Child j Child i Ch1 Ch2 Ch3 Ch4 Ch5 Ch6 Ch1 0 0.001 (p=0.862) 0.009 (p=0.810) 0.077 (p=0.385) 0.052 (p=0.536) 0.014 (p=0.491) Ch2 0.004 (p=0.861) 0 0.392 (p=0.203) 0.343 (p=0.138) 0.026 (p=0.605) 0.369 (p=0.299) Ch3 0.061 (p=0.597) 0.358 (p=0.161) 0 0.186 (p=0.285) 0.059 (p=0.414) 0.506 (p=0.044) Ch4 0.690 (p=0.154) 0.414 (p=0.285) 0.246 (p=0.542) 0 0.856 (p=0.121) 0.106 (p=0.798) Ch5 0.185 (p=0.373) 0.013 (p=0.677) 0.031 (p=0.558) 0.343 (p=0.243) 0 0.006 (p=0.806) Ch6 0.061 (p=0.492) 0.214 (p=0.609) 0.322 (p=0.279) 0.051 (p=0.825) 0.007 (p=0.878) 0
Table IX. Ratios ωi←j and their p values obtained by means of a Monte Carlo test with
99,999 generated random matrices.
Child j Child i Ch1 Ch2 Ch3 Ch4 Ch5 Ch6 Ch1 0 0.004 (p=0.862) 0.063 (p=0.216) 0.096 (p<0.01) 0.151 (p=0.026) 0.160 (p=0.100) Ch2 0.004 (p=0.86161) 0 0.665 (p<0.01) 0.184 (p<0.01) 0.148 (p=0.067) 0.036 (p<0.01) Ch3 0.063 (p=0.21553) 0.665 (p<0.01) 0 0.095 (p<0.01) 0.425 (p<0.01) 0.470 (p<0.01) Ch4 0.096 (p<0.01) 0.184 (p<0.01) 0.095 (p<0.01) 0 0.065 (p<0.01) 0.002 (p=0.378) Ch5 0.151 (p=0.026) 0.148 (p=0.067) 0.425 (p<0.01) 0.065 (p<0.01) 0 0.006 (p=0.589) Ch6 0.160 (p=0.100) 0.036 (p<0.01) 0.470 (p<0.01) 0.002 (p=0.378) 0.006 (p=0.589) 0