UNIVERSITÀ DEGLI STUDI DI SALERNO
Dipartimento di Farmacia
PhD Program
in
Drug Discovery and Development
XXX Cycle — Academic Year 2017/2018
PhD Thesis in
PGI products of Campania region:
chemical and biological investigation of
edible parts and by-products as potential
sources of functional ingredients for
herbal, nutraceutical and cosmetic
formulations.
Candidate Supervisor(s)
Antonietta Cerulli Prof. Sonia Piacente
Table of contents
Introduction ... 1
Chapter 1: Phytochemical investigation of Corylus avellana cv. Tonda di Giffoni leaves 1.1. Giffonins A-P, Antioxidant Cyclic Diarylheptanoids from the Leaves of Corylus avellana cv. Tonda di Giffoni 1.1.1 LC-ESI/LTQOrbitrap/MS/MSn analysis ... 13
1.1.2. Results and discussion ... 17
1.1.3 Biological activity ... 57
1.2. Metabolite profiling of “green” extracts of Corylus avellana leaves by 1H NMR spectroscopy and multivariate statistical analysis 1.2.1 Results and discussion ... 63
1.3 Conclusion ... 82
1.4. Experimental section ... 83
References ... 100
Chapter 2: Byproducts of Corylus avellana cv. Tonda di Giffoni: phytochemical study of flowers, green leafy covers and shells 2.1 Quali-quantitative analysis of the phenolic fraction of the flowers of Corylus avellana, cv. Tonda di Giffoni: isolation of antioxidant diarylheptanoids 2.1.1. Results and discussion ... 108
2.1.2. Biological activity ... 123
2.2. Cyclic Diarylheptanoids from Corylus avellana cv. Tonda di Giffoni Green Leafy Covers: Determination of Their Absolute Configurations and Evaluation of Their Antioxidant and Antimicrobial Activities 2.2.1 LC-ESI/LTQOrbitrap/MS/MSn analysis ... 126
2.2.2. Results and discussions ... 127
2.2.3. Biological assay ... 145
2.3. LC-MS profiling highlights Hazelnut (cv. Tonda di Giffoni PGI) shells as a byproduct rich in antioxidant phenolics. 2.3.1. Results and discussions ... 154
2.3.2. Biological assay. ... 172
2.5. Experimental section ... 173
References ... 188
Chapter 3: Multi-class polar lipid profiling of fresh and roasted hazelnut (Corylus avellana cv. Tonda di Giffoni) by LC-ESI/LTQOrbitrap/MS/MSn 3.1. Results and discussion ... 196
3.2. Conclusion ... 237
3.3. Experimental section ... 238
References ... 240
Chapter 4: Byproducts of Castanea sativa source of the Italian PGI Product “Marrone di Roccadaspide”: phytochemical investigation of leaves and shells 4.1. Phenolics from Castanea sativa leaves and their effects on UVB-induced damage 4.1.1.. Results and discussion ... 249
4.1.2. Biological activity ... 254
4.2. Evaluation of the biological activity of the MeOH extract of the different parts (leaves, burs, green burs, shells, chestnut) of C. sativa, cv. Marrone di Roccadaspide. ... 258
4.3. Phytochemical investigation of MeOH extract of C. sativa cv. Marrone di Roccadaspide shells. 4.3.1. Results and discussions ... 262
4.4. Conclusion ... 284
4.5. Experimental section ... 285
References ... 296
General experimental procedures ... 303
Conclusion ... 311
1
Introduction
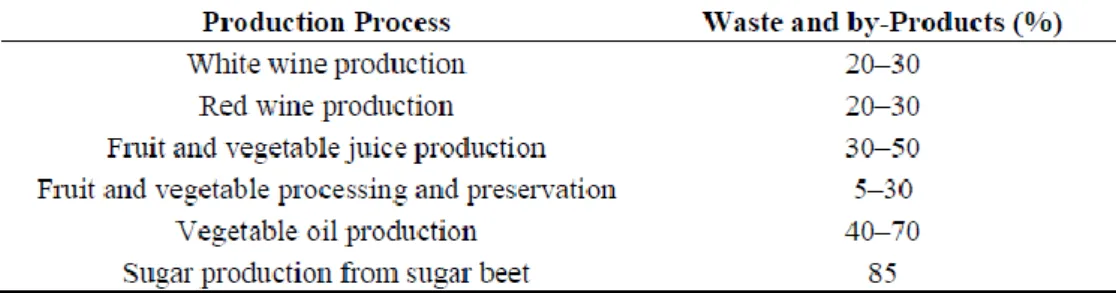
The current world production of fruits and vegetables is placed at 429 and 596 million tonne, respectively1. The waste generated by fruit and vegetable processing industries includes both solids and liquids. In particular, the food waste, can be classified into the following six categories: (a) crop waste and residues; (b) fruit and vegetables by-products; (c) sugar, starch and confectionary industry products; (d) oil industry products; (e) grain and legume by-products; and (f) distilleries’ and breweries’ by-products.
The byproducts production is estimated to be approximately 30% of the processed material2 (table 1).
Table 1. Percentage of food wastes and by-products in fruit and vegetable production.
This percentage is due to the global intensification of food production that has led to the creation of large quantities of wastes; generally the disposal of waste materials requests huge price by the industries and farmers.
For this reason, during the last years, the research has developed a great interest for the efficient reutilization of agricultural industry residues; in particular, fruit and vegetable processing by-/co-products are promising sources of valuable substances such as phytochemicals (carotenoids, phenolics, and flavonoids), antioxidants, antimicrobials, vitamins, or dietary fats that possess favorable
Introduction
2
technological activities or nutritional properties. Moreover, fruit and vegetable processing residues have traditionally been used in animal nutrition as the main feed ingredients and their effect on animal performance has been extensively studied2.
Byproducts of Protected Geographical Indication (PGI) products of Campania region: “Nocciola di Giffoni” and “Marrone di Roccadaspide”.
Horticulture in Campania is a major economic resource with an extremely varying range of products and many valued typical varieties. Typical products are characterized by a strong identification with the land they come from. PDO (Protected Designation of Origin), PGI (Protected Geographical Indication) and TSG (Traditional Specialities Guaranteed) labels in Campania contribute significantly to agricultural economy since producers and consumers have developed a strong sensibility to quality.
In Campania region there are currently 16 registered agriculture products, among which the PGI products “Nocciola di Giffoni” (Corylus avellana L.) and “Marrone di Roccadaspide”3
(Castanea sativa Mill.).
- “Nocciola di Giffoni”. The Protected Geographical Indication "Nocciola di Giffoni" refers to one of the most appreciated Italian varieties: Tonda di Giffoni.
The distinctive characteristics of the "Nocciola di Giffoni" PGI are represented from the perfectly round shape of the seed (which is the shelled hazelnut), which has a white flesh, consistent, with an aromatic flavor, and a thin and easily detachable perisperm (internal film). "Nocciola di Giffoni" is particularly suitable for roasting, peeling; moreover it is strongly requested by the industries for the production of pasta and grain, as well as, as a raw material, for the preparation of high-quality confectionery specialties.
3
"Nocciola di Giffoni" production is limited to the Salerno province around the Picentini Mountains and Irno valley4.Being a medium-early cultivar, the harvesting of the fruits usually begins as early as the third decade of August, after which the hazelnuts are dried, they are deposited in cool and ventilated places, without odors and humidity3.
- “Marrone di Roccadaspide” has been recognised as a PGI (Protected Geographical Indication) product in 2008.
The distinctive characteristics of the "Marrone di Roccadaspide " are represented by a medium size of the fruit (80-85 fruits per Kg) of a prevalently semi-spherical shape, sometimes roundish. For the valuable characteristics of the fruit, "Marrone di Roccadaspide " is among the few varieties of chestnuts in Campania to be defined botanically "brown type" and is therefore particularly required for industrial processing (over 90% of the commercial destination ), infact the industry uses them mainly for the production of marron glacés, jams, chestnuts with rum, and purees3. "Marrone di Roccadaspide" is considered, together with “Castagna di Montella” PGI and “Castagna di Serino”, among the best chestnuts produced in Campania, not only for the quality, but also for the soil and the favorable climate3.
The production area of "Marrone di Roccadaspide PGI" is located in the province of Salerno and in particular in the Alburni area3.The harvesting is carried out during the first decade of November.
The PGI products of Campania region are not only extensively used in the local gastronomy but also represent the Italian products abroad. Italy is the second producer of hazelnut with over 13% after Turkey. Campania is the first Italian
Introduction
4
region in the hazelnut production, and in Salerno 90% of the production is given by “Nocciola di Giffoni”. Italy is the leading producer of chestnuts: in Campania, the growing area of PGI “Marrone di Roccadaspide” is very large, and represents about 50% of the production of Salerno province.
The high importance of these products is evident, considering that only the 10-15% of the nuts are used fresh while the remaining part is for the food industry. Even if the nutritive features of these PGI products are well known, in some cases very little is known about their metabolome. A deeper insight on the chemical composition of this PGI products has the purpose to protect the reputation of the regional foods, to promote rural and agricultural activity, to help producers to obtain a premium price for their authentic products, and to eliminate the unfair competition and misleading of consumers by non-genuine products, which may be of inferior quality.
In particular, attention has been focused on the parts of the plants not edible, which result waste products and represent a large amount of the total biomass of the products. The PGI “Nocciola di Giffoni” hazelnut skin, hazelnut green leafy cover, and hazelnut tree leaf, by-products of roasting, cracking, shelling/hulling, and harvesting processes, respectively, don’t have any commercial value and represent a huge amount of discarded material; also the by-products of the PGI “Marrone di Roccadaspide” such as shell, resulting from the fruit peeling process, wood and leaves represent waste material.
The aim of the present PhD project has been the definition of the metabolome of byproducts and of the edible parts of the selected PGI branded products; particular attention has been paid to the study of waste products as potential sources of bioactive molecules, in order to highlight the occurrence of phytochemicals to use as functional ingredients for nutraceutical, herbal and cosmetic formulations. Specifically, the objectives achieved during PhD are the following:
5
-definition of the chemical profile of the different parts of the selected plant species Corylus avellana L. cv. Tonda di Giffoni and Castanea sativa Mill. cv. Marrone di Roccadaspide;
- development of methods for the qualitative and quantitative analysis of extracts obtained from the different parts of the selected plant species;
-definition of the bioactivity profile of extracts and pure compounds.
Experimental plan
Extraction of the selected parts of plant.
Plant tissue metabolites are highly diverse. Several critical factors must be considered during extraction, such as the ratio of solvent and plant material, solvent characteristics, the time of extraction, the temperature and the choice of an appropriate method for the desired goals. The choice of a solvent is extremely important for the achievement of reliable results because it needs to be adequate for the metabolites targeted for extraction and for the analytical method.3 For this reason, a specific extraction protocol has been developed for each plant raw material, by using traditional extraction procedure or in some cases innovative extraction methods like Naviglio extraction.
Qualitative and quantitative analysis.
Following a qualitative approach (untargeted metabolomics), the extracts obtained from the different parts of the plants have been analyzed by liquid chromatography coupled to mass spectrometry (LC-MS) which is a very useful tool in phytochemistry and food chemistry, allowing to determine in a single analysis a large number of different molecules and, with the utilization of suitable fragmentation experiments and protocols, to obtain information about the structures. In particular LC coupled with electrospray multicollisional Ion trap
Introduction
6
(IT) mass spectrometry (LC-ESI(IT)MSn), due to its capacity to rapidly separate, fragment and detect a broad range of small molecules, can be considered a powerful approach for structural characterization in metabolite fingerprinting. Spectrometer with an ion trap analyser allow to run experiments of tandem mass spectrometry and MSn, increasing the number of information obtained by a single LC-MS experiment.
According to this, a high-resolution mass spectrometer has been used (i. e. Orbitrap).
To characterize unequivocally all components of the extracts, off-line isolation protocols have been performed by carrying out sequential fractionating steps with the aid of different chromatographic preparative or semi-preparative techniques. The selection of the different chromatographic protocol depends on the physical-chemical properties of the extracts and the compounds to isolate. The same analytical protocols, when performed in semi-preparative or preparative scale on a partially purified extract can lead to a fast isolation of interesting compounds. The structural determination of pure compounds has been performed by Mass Spectrometry (MS) and spectroscopic methods like CD, UV, IR but mainly by NMR.
The NMR structural assignment of metabolites has been obtained by 1D-(1H and
13
C) and 2D-NMR (DQF-COSY, HSQC, HMBC, TOCSY, ROESY).
In particular, the NMR structural assignment of plant metabolites has been carried out acquiring scalar coupling homonuclear spectra (1D-TOCSY, 2D-TOCSY, COSY) for the determination of the molecule spin-systems, heteronuclear spectra (HSQC, HMBC) for the identification of the substitution pattern and for the assembly of the molecule moieties, dipolar coupling homonuclear spectra (NOESY, ROESY) for a further assessment of the substructures contained in the molecule and for the definition of the configurational orientations particularly in those cases with well-defined conformational properties. Moreover, to determine
7
the relative configuration a combined QM (quantum mechanical)/NMR approach, has been followed in the frame of collaborations.
In some cases, metabolite profiling analysis has been followed by quantitative analyses based on mass spectrometry targeted approach. In particular, LC-ESI/QqQ/MS/MS, with a very sensitive and selective mass tandem experiment such as Multiple Reaction Monitoring (MRM), has been used.
Evaluation of the biological activity of the PGI product extracts and of the pure compounds.
On the basis of the chemical composition of the PGI products, biological assays have been carried out on extracts and pure compounds considering the chemical nature of the isolated metabolites. Preliminarly, in the frame of collaborations, the cytotoxicity has been evaluated to highlight the non-toxic concentration; successively different biological assays have been performed, mainly aimed at evidencing the antioxidant potential of the extracts and pure compounds.
Introduction
8
References
1. Waliaveetil, E.; Ramesh, R. Handbook of Postharvest Technology (book),
2003, 819-844.
2. Kasapidou, E.; Sossidou, E.; Mitlianga, P Fruit and Vegetable Co-Products as Functional Feed Ingredients in Farm Animal Nutrition for Improved Product. Quality. Agriculture 2015, 5, 1020-1034
3. www.agricolture.regione.campania.it
4. Petriccione, M.; Ciarmiello, L. F.; Boccacci, P.; De Luca, A.; Piccirillo, P., Evaluation of 'Tonda di Giffoni' hazelnut (Corylus avellana L.) clones. Scientia
9
Chapter 1
Phytochemical investigation of Corylus avellana cv.
Tonda di Giffoni leaves
11
Introduction
Hazelnut (Corylus avellana L.), belonging to the Betulaceae family, is a tree which may grow up to 6 m, exhibiting deciduous leaves which are rounded, 6–12 cm long, softly hairy on both surfaces, and with a double-serrate margin; hazelnut is one of the most popular tree nuts on a worldwide basis and ranks second in tree nut production after almond. Italy is the second largest producer of hazelnut (13%) after Turkey; the main products of C. avellana are kernels, nutritious food with a high content of healthy lipids1, used by the confectionary industry, consumed raw (with skin) or preferably roasted (without skin). The leaves of C.
avellana are used in traditional medicine for the treatment of varicose veins and
hemorrhoidal symptoms and also for their mild antimicrobial effects2. Antioxidant activity has been reported for hazelnuts and leaves of C. avellana1. Previous phytochemical investigations on the leaves resulted in the isolation of phenolic constituents, such as flavonoids, caffeic acid, and linear diarylheptanoid derivatives3.
The Italian “Nocciola di Giffoni”, also known as “Tonda di Giffoni”, is a labeled PGI (Protected Geographical Indication) product of the Campania region, representing an important economic resource.
Although the nutritive features of the PGI “Nocciola di Giffoni” hazelnut are well known4,5, no studies are reported on the chemical composition of the leaves of C.
Chapter 1
12
new bioactive compounds from C. avellana6, 7,the MeOH extract of the leaves was investigated.
The phytochemical investigation of C. avellana cv. Tonda di Giffoni leaves allowed us to isolate and characterize, by 1D and 2D NMR experiments, 16 new cyclic diarylheptanoids and diaryletherheptanoids, some of which highly hydroxylated, named giffonins A-P. Cyclic diarylheptanoids are characterized by a C-C bond between C-1 and C-2 positions of the two aromatic rings, while cyclic diaryletherheptanoids are characterized by an ether linkage between C-1 and C-17 of the two aromatic moieties. In particular, in this chapter the following topics are reported:
- isolation and structural elucidation of giffonins A-I, some of which characterized by the presence of only one stereogenic centre on the heptyl moiety; for these compounds (giffonins B, C and E-H) the absolute configuration has been established through the application of the modified Mosher’s method.
- isolation and structural elucidation of giffonins J-P, possessing at least two stereogenic centres on the heptyl unit; in this case a combined QM/NMR approach has been used to establish the relative configurations. - evaluation of the effects of giffonins A-P on oxidative damage of human plasma lipids, induced by H2O2 and H2O2/Fe2+.
13
1.1. Giffonins A-P, Antioxidant Cyclic Diarylheptanoids from the Leaves of
Corylus avellana cv. Tonda di Giffoni
1.1.1 LC-ESI/LTQOrbitrap/MS/MSn analysis
The leaves of C. avellana cv. Tonda di Giffoni (910 g) have been dried and extracted at room temperature using solvents of increasing polarity.
High-performance liquid chromatography coupled to multiple-stage linear ion-trap and orbiion-trap high-resolution mass spectrometry in negative electrospray ionization mode (LC-ESI/LTQOrbitrap/MS/MSn) analysis, of the MeOH extract of C. avellana leaves allowed us to obtain a preliminary plant metabolite profiling.
Figure 1.1.. LC-MS profile of the MeOH extract of C. avellana leaves.
LC-MS profile of the MeOH extract highlighted peaks with m/z values corresponding to a wide range of phenolic compounds. In particular, the LC-MS spectrum showed ions characterized by typical fragmentation patterns of flavonoids, and further peaks suggesting the occurrence of diarylheptanoid derivatives (fig. 1.1).
Chapter 1
14
Diarylheptanoids
Since the first diarylheptanoid isolated in 1815, more than 500 diarylheptanoids have been identified. Diarylheptanoids occur frequently in plants belonging to the Betulaceae family; they rappresent a class of natural products based on the 1,7-diphenylheptane skeleton that are mainly found in terrestrial plants.
They can be divided into linear or cyclic compounds. There is a smaller number12 of cyclic diarylheptanoids that are formed from the corresponding linear type by phenolic oxidative coupling, either C-C coupling leading to meta,meta-bridged biaryls or C-O coupling leading to bridged diaryl ethers (fig. 1.2). So, they can be classified into three subgroups, namely linear diarylheptanoids, cyclic diaryletherheptanoids, and cyclic diarylheptanoids (fig. 1.2)12.
1 2 3 4 5 6 7 1' 1'' 6'' 6' 5'' 5' 4'' 4' 3' 3'' 2'' 2' O 1 2 3 4 5 6 7 8 9 10 11 12 13 14 15 16 17 18 19 1 2 3 4 5 6 7 8 9 10 11 12 13 14 15 16 17 18 19 B C A
Figure 1.2. A) linear diarylheptanoids; B) macrocyclic diaryletherheptanoids; C) macrocyclic
diarylheptanoids.
The biosynthesis of diarylheptanoids starts from L- phenylalanine; which thanks to the action of phenylalanine-ammonia-lyase (PAL) loses the amine group leading to cinnamic acid. The subsequent action of the cinnamate 4-hydroxylase (C4H) converts cinnamate into p-coumarate. At this point the concatenated actions of the 4-cumarate CoA ligase (4CL), of the p-cumaroyl shikimato transferase (CST) combined with the action of p-coumaroyl 5-O-shikimato 3'-hydroxylase (CS3'H), leads to the synthesis of caffeoyl-CoA. Finally, the caffeoyl-CoA O-methyltransferase (CCOMT) leads to the feruloyl-CoA, which represents the starting point for the synthesis of most of the diarylhepanoids
15
known today13. The combination of two phenylpropanoid moieties in the form of CoA-esters with malonyl-CoA generates a diarylheptanoid derivative.
Chapter 1
16
Linear diarylheptanoids are abundant in plants of the genera Curcuma, Zingiber,
Alpinia (Zingiberaceae), Alnus and Betula (Betulaceae). Cyclic diarylheptanoids
are distributed in Myrica (Myricaceae), Acer (Aceraceae), Garuga (Burseraceae),
Corylus, Betula, Carpinus (Betulaceae), and Juglans (Juglandaceae) species13. The aromatic rings of linear
diarylheptanoids are often
hydroxylated or methoxylated. C-4' and C-4'' hydroxyl groups can be acetylated or glycosylated. Natural occurring molecules with unsubstituted aromatic rings are scarce. The aliphatic C-7 chain is either saturated or can have up to three double bonds. Further possibility is the presence of carbonyl groups at C-3 and/or C-5. On the heptane chain hydroxyl groups can be present that may be free or engaged in another function: methyl, acetyl, sulfate or glycosyl groups can be attached. Diarylheptanoids can occur as mono-, di- or triglycosides. The sugar moieties may be further substituted by phenol carboxylic acids. Diarylheptanoids can also possess flavonoid (e.g. chalcone, flavanone) moieties at C-5 or C-7. Dimeric compounds with antiproliferative activity were also isolated from Alpinia species, additionally, a chalcone moiety can also be attached to the dimeric diarylheptanoid skeleton13.
17
The co-occurrence of cyclized diarylheptanoids with their corresponding acyclic counterpart in plant such as A. japonica, and Acer Nikoense provided indication of their biosynthetic relationship.
Intramolecular phenolic oxidative coupling of linear diarylheptanoids,
would predict that
biphenylcyclophane will be meta, meta bridged in nature, while diphenylether type cyclophane be meta, para bridged. Such a structural pattern were indeed found in natural products13.
Cyclized diarylheptanoids are reported in few species of Betullaceae family, such as
Carpinus cordata8, Alnus
sieboldiana9, 10, and Ostryopsis nobilis11. Cyclic diaryletherheptanoids and cyclic diarylheptanoids show different oxidation pattern on heptanoid chain, characterized by alcoholic and chetonic funtions and cis or trans olefinic bonds; moreover, some cyclic diarylheptanoids show one or more methoxy groups on aromatic ring.
1.1.2 Results and discussion
Isolation and characterization of cyclic diarylheptanoids in the MeOH extract of C. avellana cv. Tonda di Giffoni leaves.
In order to unambiguously elucidate the compounds corresponding to the unknown peaks occurring in the LC-ESI/LTQOrbitrap/MS/MSn spectrum, the MeOH extract was purified by size exclusion chromatography, followed by
Chapter 1
18
further purification steps by reversed-phase using high-performance liquid chromatography equipped with refractive index (HPLC-RI), to obtain 16 compounds. Their structures were established by 1D and 2D-NMR experiments along with ESIMS and ESI/LTQORBITRAP/MS analysis.
The ESI/LTQORBITRAP/MS of 1 (m/z 377.1369 [M+Na]+, calcd for C21H22O5Na, 377.1365) and the 13C NMR data supported a molecular formula of
C21H22O5. The IR spectrum showed a band at 1705 cm−1 indicative of the
presence of a ketocarbonyl group.
The 1H NMR spectrum displayed signals for five aromatic protons ascribable to two aromatic rings: a signal at δ 4.41 (s), typical of the proton of a penta substituted aromatic ring and signals at δ 7.41 (2H, d, J = 8.3 Hz) and 7.01 (2H, d,
J = 8.3 Hz), due to the proton of a 1,4-disubstituted aromatic ring. The 1H NMR
data displayed further signals due to a di-substituted trans-olefinic group at δ 6.34 (d, J = 15.7 Hz) and 5.20 (dt, J = 8.0, 15.7 Hz) and four methylene groups at δ 2.32 (2H, m), 2.44 (2H, t, J = 5.5 Hz), 2.86 (2H, t, J = 5.5 Hz), and 3.03 (2H, t, J = 5.5 Hz) (fig. 1.3 and table 1.1). Moreover, two signals for two methoxy groups at δ 4.00 and 3.67 were evident.
19
Figure 1.3. 1H NMR spectrum (600 MHz, CD3OD) of giffonin A (1).
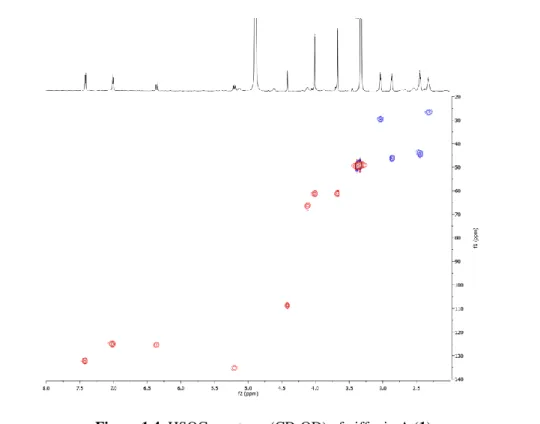
The 13C NMR spectrum of 1 showed 21 carbon signals (table 1.1), typical of diaryletherheptanoid derivatives14-16, comprising a signal at δ 211.1, ascribable to a ketocarbonyl group. The signal at δ 4.41 was attributed to H-6, which generally resonates at an abnormally high field, due to the anisotropic effect of the A ring in diaryletherheptanoids15. This observation together with the ROESY correlations of H-6 at δ 4.41 with H-18 (δ 7.01) and H.16 (δ 5.20) suggested the ether linkage between C-1 and C-17 of the aryl moieties. The HMBC correlations of H-6 (δ 4.41) with the 13C NMR resonances at δ 152.7 (C-1), 136.9 (C-2), 140.4 (C-4), 127.8 (C-5), and 125.5 (C-7) suggested the 1,2,3,4-tetrahydroxylation of the A ring. The disposition of the heptanoid chain and the position of the keto group were determined by HSQC, HMBC, and COSY experiments. (fig 1.4-1.6)
Chapter 1
20
Figure 1.4. HSQC spectrum (CD3OD) of giffonin A (1).
21
In the HMBC spectrum of 1, the methylene protons at δ 3.03 were assigned to C-13 on the basis of their correlations with the 13C NMR resonances at δ 132.2 (C-15 and C-19), 141.0 (C-14), 46.2 (C-12), and 211.1 (C-11) as showed in figures 1.5. The COSY correlation between the methylene protons at δ 3.03 and 2.86 allowed the latter methylene group to be located at C-12, and therefore the keto group to be located at C-11. The HMBC correlations of the proton at δ 6.34 (H-7) with the 13C NMR resonances of the B ring at δ 140.4 (C-4), 127.8 (C-5), and 109.0 (C-6) and the linear connectivity observed in the COSY spectrum from H-7 to H-10 were used to assign the heptanoid chain (fig. 1.6).
Figure 1.6. COSY spectrum (CD3OD) of giffonin A (1).
Finally, the HMBC correlations between the protons at δ 4.00 and 3.67 with the
13C NMR resonances at δ 136.9 (C-2) and 140.4 (C-4), respectively, allowed the
methoxy groups to be located at C-2 and C-4 of the A ring. The foregoing spectroscopic data allowed the structure of compound 1, named giffonin A, to be assigned as shown (fig. 1.7).
Chapter 1
22
Figure 1.7. giffonin A.
The ESI/LTQORBITRAP/MS of 2 (m/z 393.1318 [M+Na]+, calcd for C21H22O6Na, 393.1314) and the 13C NMR data supported a molecular formula of
C21H22O6. The 1H NMR spectrum displayed five aromatic proton signals, which
suggested the occurrence of a penta-substituted [δ 4.39 (s)] and a 1,4-disubstituted aromatic ring [δ 7.70 (dd, J = 8.3, 1.9 Hz), 7.45 (dd, J = 8.3, 1.9 Hz), 7.16 (dd, J = 8.3, 1.9 Hz), 7.00 (dd, J = 8.3, 1.9 Hz)] (table 1.1), as in 1.
The NMR data of 2 revealed that it differed from 1 by the presence of a secondary hydroxy group suggested by a signal at δ 5.23 (dd, J = 5.4, 8.9 Hz) (table 1.1). The HMBC correlations of the proton at δ 5.23 with the 13C NMR resonances at δ
131.4 (C-15), 128.4 (C-19), 143.4 (C-14), 54.2 (C-12), and 209.5 (C-11) suggested the secondary hydroxy group to be located at C-13. The presence of hydroxy groups on the heptane moiety causes the different chemical shifts for the corresponding protons on the aromatic ring (H-15 and H-19; H-16 and H-18) 11. The ROESY spectrum showed correlations between H-6 at δ 4.39 and H- 8 (δ 5.14). The aromatic proton H-19 at δ 7.70 showed a correlation with the methylene protons H-9 (δ 2.00), and H-13 at δ 5.23 showed a strong correlation with H-15 (δ 7.45).
The absolute configuration at C-13 of compound 2 was determined through the application of the modified Mosher’s method12
. Mosher derivatization was performed on compound 2, which was treated with (R)- and (S)-MTPA chloride to
O O H3CO HO H3CO 1 2 3 4 5 6 7 8 9 10 11 12 13 14 15 16 17 18 19 giffonin A
23
form (S)- MTPA and (R)-MTPA esters, respectively. To determine the absolute configuration of C-13 in 2, the Δδ (δS− δR) values were observed for signals of the protons close to C-13, revealing a 13S configuration for 2 (Fig. 1.8). Thus, on the basis of the above data the structure of 2, named giffonin B, was determined as reported (fig. 1.8).
Figure 1.8. giffonin B.
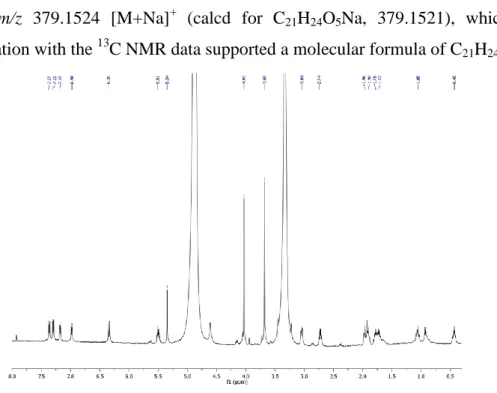
The positive-ion ESI/LTQORBITRAP/MS data of 3 showed a pseudo-molecular ion at m/z 379.1524 [M+Na]+ (calcd for C21H24O5Na, 379.1521), which in
combination with the 13C NMR data supported a molecular formula of C21H24O5.
Chapter 1
24
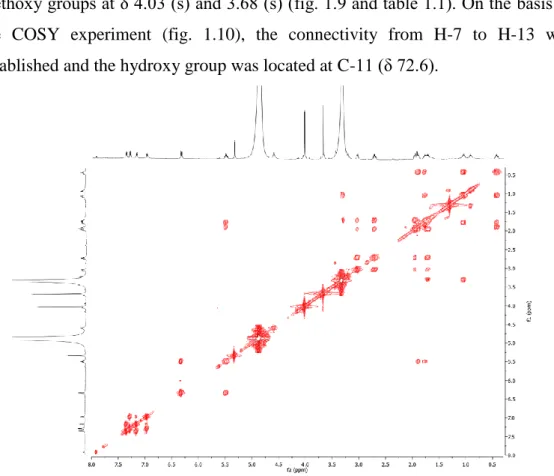
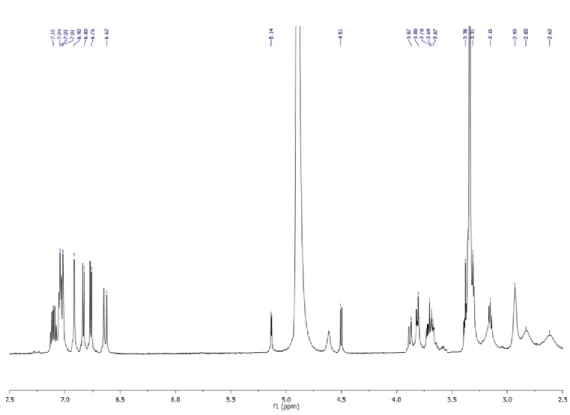
Comparison of the 1H NMR spectrum of 3 in the aromatic region with that of giffonin B (2) suggested that they share the same aromatic substitution patterns (table 1.1). Moreover, the 1H NMR spectrum displayed signals due to a disubstituted cis olefinic function at δ 6.35 (d, J = 11.4 Hz) and 5.51 (ddd, J = 11.4, 7.3, 7.3 Hz), a proton linked to an oxymethine carbon at δ 3.31, and two methoxy groups at δ 4.03 (s) and 3.68 (s) (fig. 1.9 and table 1.1). On the basis of the COSY experiment (fig. 1.10), the connectivity from H-7 to H-13 was established and the hydroxy group was located at C-11 (δ 72.6).
Figure 1.10. COSY spectrum (CD3OD) of giffonin C (3).
The methoxy groups were placed at C-2 and C-4 via the HMBC correlations between the protons at δ 4.03 and 3.68 with the 13C NMR resonances at δ 137.5
25
Figure 1.11. HSQC spectrum (CD3OD) of giffonin C (3).
Chapter 1
26
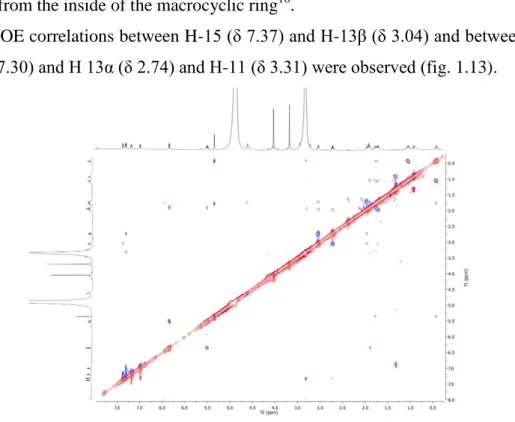
The hydroxy group at C-11, bulkier than a hydrogen atom, should be directed away from the inside of the macrocyclic ring16.
The ROE correlations between 15 (δ 7.37) and 13β (δ 3.04) and between H-19 (δ 7.30) and H 13α (δ 2.74) and H-11 (δ 3.31) were observed (fig. 1.13).
Figure 1.13. ROESY spectrum (CD3OD) of giffonin C (3).
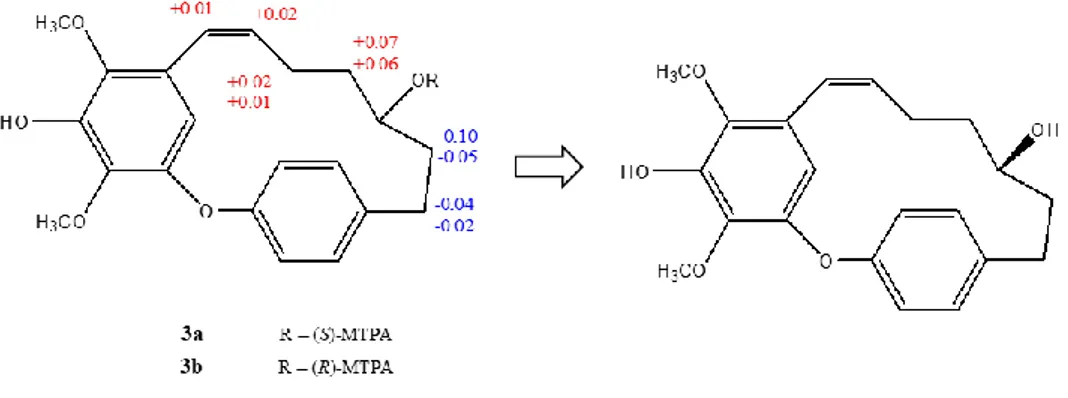
Mosher derivatization was performed on compound 3, which was treated with (R)- and (S)-MTPA chloride to form (S)-MTPA and (R)-MTPA esters, respectively. Analysis of the Δδ (δS− δR) values of the protons close to the oxygenated methane according to the Mosher model12 allowed the assignment of the 11R absolute configuration of 3 (fig. 1.14). Thus, the structure of compound 3, named giffonin C, was elucidated as depicted.
27
Figure 1.14. giffonin C.
The 13C NMR and ESI/LTQORBITRAP/MS data of 4 (m/z 377.1367 [M+Na]+, calcd for C21H22O5Na, 377.1365) supported a molecular formula of C21H22O5. The
IR spectrum showed a band at 1713 cm−1 for the presence of a ketocarbonyl group. The NMR data of compound 4 were comparable to those of giffonin C (3) except for the presence of a carbonyl group replacing the secondary hydroxy group in 3. Analyses of HMBC and COSY experiments confirmed the presence of a carbonyl group at C-11 (δ 213.9). Notably, the absence of the hydroxy group on the heptanoid chain induced similar chemical shifts of H-15 and H-19 (each, δ 7.26, d, J = 8.3 Hz) and H-16 and H-18 (each, δ 7.06, d, J = 8.3 Hz) (table 1.1). On the basis of the reported data the structure of 4, named giffonin D, was deduced as depicted (fig. 1.15).
Figure 1.15. giffonin D. O H3CO HO H3CO O
28
Table 1.1. 13C and 1H NMR Data (J in Hz) of compounds 1-4 (600 MHz, ppm, in MeOH-d4).
1 2 3 4 C H (J in Hz) C H (J in Hz) C H (J in Hz) C H (J in Hz) 1 152.7 - 152.7 - 151.8 - 151.8 - 2 136.9 - 137.0 - 137.5 - 137.6 - 3 144.3 - 144.1 - 144.7 - 145.0 - 4 140.4 - 140.6 - 141.6 - 141.9 - 5 127.8 - 128.0 - 124.7 - 125.7 - 6 109.0 4.41, s 109.2 4.39, s 108.3 5.34, s 108.0 5.18, s 7 125.5 6.34, d (15.7) 125.6 6.36, d (15.7) 124.6 6.35, d (11.4) 125.9 6.40, d (11.4) 8 135.5 5.20, dt (8.0, 15.7) 135.5 5.14, ddd (15.7, 10.8, 4.0) 132.5 5.51, ddd (11.4, 7.3, 7.3) 131.0 5.48, dt (11.4, 8.0) 9 26.7 2.32, (2H) m 26.1 2.52, m 2.00, m 27.0 1.90, m 1.78, m 23.0 1.94, (2H) m 10 44.3 2.44, (2H) t (5.5) 45.2 2.57, dt (17.0, 3.0) 2.29, ddd (3.0, 11.0, 12.0) 40.1 1.05, m 0.43, m 46.5 1.94, (2H) m 11 211.1 - 209.5 - 72.6 3.31, overlapped 213.9 - 12 46.2 2.86, (2H) t (5.5) 54.2 3.04, (2H) t (5.5) 40.9 1.96, m 1.72, m 45.0 2.66, (2H) t (6.8) 13 29.8 3.03, (2H) t (5.5) 71.2 5.23, dd (5.4, 8.9) 34.2 3.04, dt (12.8, 3.7) 2.74, td (12.8, 5.0) 33.6 3.03, (2H) t (6.8) 14 141.0 - 143.4 - 140.0 - 138.6 - 15 132.2 7.41, d (8.3) 131.4 7.45, dd (8.3, 1.9) 130.8 7.37, dd (8.3, 1.9) 131.8 7.26, d (8.3) 16 125.2 7.01, d (8.3) 124.4 7.00, dd (8.3, 1.9) 124.9 7.17, dd (8.3, 1.9) 124.5 7.06, d (8.3) 17 155.8 - 158.5 - 156.3 - 157.0 - 18 125.2 7.01, d (8.3) 125.8 7.16, dd (8.3, 1.9) 123.8 6.98, dd (8.3, 1.9) 124.5 7.06, d (8.3) 19 132.2 7.41, d (8.3) 128.4 7.70, dd (8.3, 1.9) 132.8 7.30, dd (8.3, 1.9) 131.8 7.26, d (8.3) 2-OCH3 61.7 4.00, s 61.6 4.00, s 61.3 4.03, s 61.4 4.02, s 4-OCH3 61.2 3.67, s 61.0 3.66, s 61.0 3.68, s 61.2 3.69, s
29
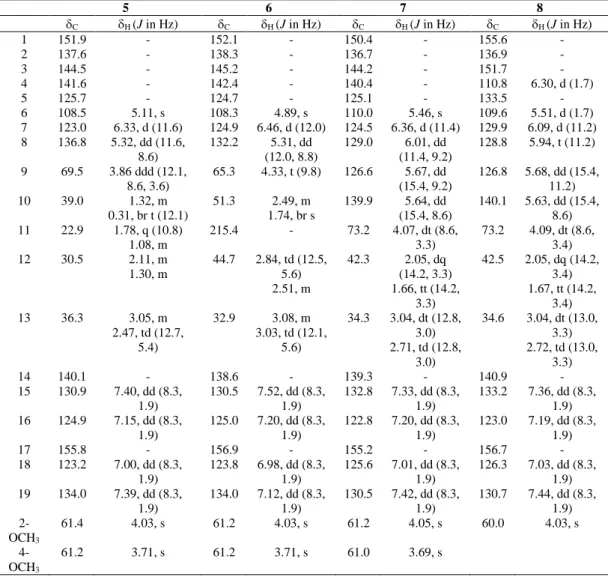
Table 1.2.13C and 1H NMR Data (J in Hz) of compounds 5-8 (600 MHz, ppm, in MeOH-d4).
5 6 7 8 C H (J in Hz) C H (J in Hz) C H (J in Hz) C H (J in Hz) 1 151.9 - 152.1 - 150.4 - 155.6 - 2 137.6 - 138.3 - 136.7 - 136.9 - 3 144.5 - 145.2 - 144.2 - 151.7 - 4 141.6 - 142.4 - 140.4 - 110.8 6.30, d (1.7) 5 125.7 - 124.7 - 125.1 - 133.5 - 6 108.5 5.11, s 108.3 4.89, s 110.0 5.46, s 109.6 5.51, d (1.7) 7 123.0 6.33, d (11.6) 124.9 6.46, d (12.0) 124.5 6.36, d (11.4) 129.9 6.09, d (11.2) 8 136.8 5.32, dd (11.6, 8.6) 132.2 5.31, dd (12.0, 8.8) 129.0 6.01, dd (11.4, 9.2) 128.8 5.94, t (11.2) 9 69.5 3.86 ddd (12.1, 8.6, 3.6) 65.3 4.33, t (9.8) 126.6 5.67, dd (15.4, 9.2) 126.8 5.68, dd (15.4, 11.2) 10 39.0 1.32, m 0.31, br t (12.1) 51.3 2.49, m 1.74, br s 139.9 5.64, dd (15.4, 8.6) 140.1 5.63, dd (15.4, 8.6) 11 22.9 1.78, q (10.8) 1.08, m 215.4 - 73.2 4.07, dt (8.6, 3.3) 73.2 4.09, dt (8.6, 3.4) 12 30.5 2.11, m 1.30, m 44.7 2.84, td (12.5, 5.6) 2.51, m 42.3 2.05, dq (14.2, 3.3) 1.66, tt (14.2, 3.3) 42.5 2.05, dq (14.2, 3.4) 1.67, tt (14.2, 3.4) 13 36.3 3.05, m 2.47, td (12.7, 5.4) 32.9 3.08, m 3.03, td (12.1, 5.6) 34.3 3.04, dt (12.8, 3.0) 2.71, td (12.8, 3.0) 34.6 3.04, dt (13.0, 3.3) 2.72, td (13.0, 3.3) 14 140.1 - 138.6 - 139.3 - 140.9 - 15 130.9 7.40, dd (8.3, 1.9) 130.5 7.52, dd (8.3, 1.9) 132.8 7.33, dd (8.3, 1.9) 133.2 7.36, dd (8.3, 1.9) 16 124.9 7.15, dd (8.3, 1.9) 125.0 7.20, dd (8.3, 1.9) 122.8 7.20, dd (8.3, 1.9) 123.0 7.19, dd (8.3, 1.9) 17 155.8 - 156.9 - 155.2 - 156.7 - 18 123.2 7.00, dd (8.3, 1.9) 123.8 6.98, dd (8.3, 1.9) 125.6 7.01, dd (8.3, 1.9) 126.3 7.03, dd (8.3, 1.9) 19 134.0 7.39, dd (8.3, 1.9) 134.0 7.12, dd (8.3, 1.9) 130.5 7.42, dd (8.3, 1.9) 130.7 7.44, dd (8.3, 1.9) 2-OCH3 61.4 4.03, s 61.2 4.03, s 61.2 4.05, s 60.0 4.03, s 4-OCH3 61.2 3.71, s 61.2 3.71, s 61.0 3.69, s
The molecular formula of 5 was established as C21H24O5 by
ESI/LTQORBITRAP/MS (m/z 379.1526 [M+Na]+, calcd for C21H24O5Na,
379.1521) and 13C NMR data. The 1H NMR spectrum of 5 displayed signals at δ 7.40 (dd, J = 8.3, 1.9 Hz), 7.39 (dd, J = 8.3, 1.9 Hz), 7.15 (dd, J = 8.3, 1.9 Hz), 7.00 (dd, J = 8.3, 1.9 Hz), 5.11 (s), 4.03 (s), and 3.71 (s), ascribable to the two aryl
30
moieties with the same substitution pattern as in 3 (table 1.2). Further signals of a disubstituted cis-olefinic function at δ 6.33 (d, J = 11.6 Hz) and 5.32 (dd, J = 11.6, 8.6 Hz) and of a proton linked to an oxymethine carbon at δ 3.86 (ddd, J = 12.1, 8.6, 3.6 Hz) (table 1.2) were observed. The position of the hydroxy group was determined by COSY and HMBC correlations. In the HMBC spectrum, correlations between the proton signals at δ 6.33 (H-7) and the 13
C NMR resonances at δ 141.6 (C-4), 125.7 (C-5), 108.5 (C-6), 136.8 (C-8), and 69.5 (C-9) were observed. In the COSY spectrum the correlation between the proton at δ 6.33 (H-7) and the proton at δ 5.32 (H-8), which in turn correlated with the proton at δ 3.86 (H-9), allowed the hydroxy group to be located at C-9. The 1
H and 13C NMR chemical shifts of the heptene moiety and the coupling constant of the proton of the secondary hydroxy function (δ 3.86, ddd, J = 12.1, 8.6, 3.6 Hz) of compound 5 were almost superimposable to those of 3,5′- dihydroxy-4′-methoxy-3′,4″-oxy-1,7-diphenyl-1-heptene, isolated from Betula platyphylla var. japonica17.
The absolute configuration of compound 5 was determined through the application of the Mosher methodology18. The Δδ (δS − δR) values observed for signals of the protons close to C-9 in compounds 5a and 5b revealed a 9S configuration for 5. On the basis of these observation, the structure of 5, named giffonin E, was determined as depicted (fig. 1.16).
31
The 13C NMR and ESI/LTQORBITRAP/MS data of 6 (m/z 393.1319 [M+Na]+, calcd for C21H22O6Na, 393.1314) supported a molecular formula of C21H22O6. The
IR spectrum showed a band at 1710 cm−1 for the presence of a carbonyl group. The NMR data of compound 6 were similar to those of giffonin E (5) except for the presence of the resonance of a carbonyl group (δ 215.4). The location of the carbonyl group at C-11 was confirmed by the HMBC correlations of the proton signals at δ 3.08 and 3.03 (H-13) and δ 4.33 (H-9) with the carbon resonance at δ 215.4.
Mosher derivatization was performed on compound 6, which was treated with (R)- and (S)-MTPA chloride to form (S)-MTPA and (R)-MTPA esters, respectively. Analysis of the Δδ (δS − δR) values of the protons neighboring the oxygenated methine according to the Mosher model18 allowed the assignment of the 9S configuration of 6. (fig. 1. 17). Accordingly, the structure of compound 6, named giffonin F, was determined as shown.
Figure 1.17. giffonin F.
The molecular formula of 7 was established as C21H22O5 by
ESI/LTQORBITRAP/MS (m/z 377.1367 [M+Na]+, calcd for C21H22O5Na,
377.1365) and the 13C NMR data. Comparison of the 1H NMR spectrum of 7 with those of 1−6 suggested that they share the same aromatic substitution patterns.
32
Furthermore, the 1H NMR spectrum displayed four signals at δ 6.36 (d, J = 11.4 Hz), 6.01 (dd, J = 11.4, 9.2 Hz), 5.67 (dd, J = 15.4, 9.2 Hz), and 5.64 (dd, J = 15.4, 8.6 Hz), ascribable to Z- and E olefinic protons, respectively, and a signal at δ 4.07 (dt, J = 8.6, 3.3 Hz), corresponding to a proton linked to an oxymethine carbon (table 1.2). The COSY experiment showed the connectivity from H-7 to H-10, allowing a conjugated diene system (C-7/C-10) flanked by a hydroxy group at C-11 (δ 4.07) to be identified. ROESY experiment showed correlations of H-15 (δ 7.33) with H-13β (δ 3.04) and of H-19 (δ 7.42) with H-13α (δ 2.71) and H-11 (δ 4.07).
To determine the absolute configuration of C-11 in 7, (S)- and (R)-MTPA esters of 7 were synthesized. The Δδ (δS − δR) values observed for signals of the protons close to C-11 revealed an 11S configuration for 7. On the basis of the reported data, the structure of compound 7, named giffonin G, was determined as depicted (fig. 1.18).
Figure 1.18. giffonin G.
The 13C NMR and ESI/LTQORBITRAP/MS data of 8 (m/z 347.1261 [M+Na]+, calcd for C20H20O4Na, 347.1259) supported a molecular formula of C20H20O4. The 1
H NMR data for the heptadiene moiety were comparable to those of 7, while differences were observed for signals due to an aryl moiety. In particular, the 1H NMR spectrum showed aromatic signals at δ 7.44 (dd, J = 8.3, 1.9 Hz, H-19),
33
7.36 (dd, J = 8.3, 1.9 Hz, H-15), 7.19 (dd, J = 8.3, 1.9 Hz, H-16), and 7.03 (dd, J = 8.3, 1.9 Hz, H-18), corresponding to the 1,4-disubstituted aromatic ring, and at δ 6.30 (d, J = 1.7 Hz, H-4) and 5.51 (d, J = 1.7 Hz, H-6), corresponding to a 1,2,3,5-tetrasubstituted aromatic ring (table 1.2). Moreover, a signal at δ 4.03 (s), typical of a methoxy group, was observed. The HMBC correlation between the proton signal at δ 4.03 and the carbon resonance at δ 136.9 allowed the methoxy group to be placed at C-2.
Mosher derivatization was performed on compound 8, which was treated with (R)- and (S)-MTPA chloride to form (S)-MTPA and (R)-MTPA esters, respectively. Analysis of the Δδ (δS − δR) values of the protons neighboring the oxygenated methine according to the Mosher model18 allowed the assignment of an 11S configuration of 8. Therefore, the structure of compound 8, named giffonin H, was defined as shown (fig. 1.19).
Figure 1.19. giffonin H.
The 13C NMR and ESI/LTQORBITRAP/MS data of 9 (m/z 611.2107 [M+Na]+, calcd for C30H36O12Na, 611.2104) supported a molecular formula of C30H36O12.
The 13C NMR spectrum of 9 showed 30 carbon signals, of which 19 were assigned to a diaryl heptanoid moiety17 and 11 to two sugar units (table 1.3).
34
Table 1.3.13C and 1H NMR Data (J in Hz) of compound 9 (600 MHz, ppm, in MeOH-d4).
9 C H (J in Hz) 1 127.4 - 2 127.5 - 3 152.4 - 4 117.6 6.83, d (8.0) 5 128.9 7.04, dd (8.0, 2.2) 6 137.6 - 7 30.4 3.17, (2H) m 8 40.6 2.83, (2H) m 9 203.0 - 10 134.6 6.62, d (15.6) 11 150.4 7.10, dt (15.6, 7.6) 12 36.2 2.62, (2H) m 13 33.8 2.93, (2H) br t (5.5) 14 133.4 - 15 129.3 7.03, dd (8.0, 2.2) 16 116.4 6.76, d (8.0) 17 153.2 - 18 136.0 6.92, d (2.2) 19 134.2 7.02, d (2.2) α-Ara (at C-3) 1 93.5 5.14, d (3.7) 2 73.7 3.38, dd (8.0, 3.7) 3 74.5 3.69, dd (8.0, 3.0) 4 72.7 3.81, m 5 62.7 3.87, dd (12.5, 3.0) 3.67, dd (12.5, 2.6) β-Glc (at C-17) 1 97.9 4.51, d (7.8) 2 76.0 3.15, dd (9.0, 7.8) 3 77.7 3.37, dd (9.0, 9.0) 4 71.6 3.31, dd (9.0, 9.0) 5 77.7 3.31, m 6 62.5 3.80, dd (12.0, 2.5) 3.70, dd (12.0, 4.5)
The 1H NMR spectrum (fig. 1.20) showed signals ascribable to two 1,2,4 trisubstituted aromatic rings at δ 7.04 (dd, J = 8.0, 2.2 Hz), 7.03 (dd, J = 8.0, 2.2 Hz), 7.02 (d, J = 2.2 Hz), 6.92 (d, J = 2.2 Hz), 6.83 (d, J = 8.0 Hz), 6.76 (d, J = 8.0 Hz), and signals due to a disubstituted trans-olefinic function at δ 6.62 (d, J = 15.6 Hz) and 7.10 (dt, J = 7.6, 15.6 Hz).
35
Figure 1.20. 1H NMR spectrum (600 MHz, CD3OD) of giffonin I (9).
The structure of the heptanoid moiety was readily deduced from HSQC, HMBC and COSY correlations (fig. 1.21, 1.22 and 1.23). Thus, the aglycone of 9 was established as alnusone, a natural compound previously isolated from Alnus
japonica and also available via total synthesis14,15. The 1H NMR spectrum displayed in the sugar region signals corresponding to two anomeric protons at δ 5.14 (d, J = 3.7 Hz) and 4.51 (d, J = 7.8 Hz). The NMR data (HSQC, HMBC, COSY, and 1D-TOCSY) indicated the presence of an α-arabinopyranosyl unit (δ 5.14) and a β- glucopyranosyl unit (δ 4.51).
36
Figure 1.21. HSQC spectrum (CD3OD) of giffonin I (9).
37
Figure 1.23. COSY spectrum (CD3OD) of giffonin I (9).
The configurations of the arabinose and glucose units were established as L and D,
respectively, after hydrolysis of 9 with 1 N HCI, trimethylsilation and GC analysis16. The linkage sites of the sugar units on the diaryl heptanoid moiety were obtained from the HMBC spectrum, which showed correlations between H-1ara (δ
5.14) and the 13C NMR resonance of C-3 (δ 152.4), and between H-1glc (δ 4.51)
and C-17(δ 153.2). On the basis of the reported data, the structure of compound 9, named giffonin I, was established as shown (fig. 1.24).
38
Figure 1.24. giffonin I.
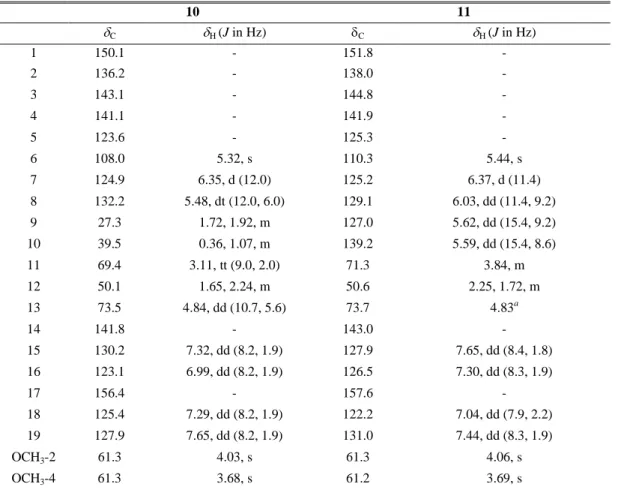
Moreover, the isolation and the structural elucidation of giffonins J-P, possessing at least two stereogenic centres on the heptyl unit was carried out. These data resembled those reported for giffonins A-H, as characterized by the signal of H-6 being considerably upfield shifted, due to the anisotropic effect of the A-ring in diaryletherheptanoids. In particular, the ESI/LTQORBITRAP/MS of 10 (m/z 395.1475 [M+Na]+, calcd for C21H24O6Na, 395.1471) and the 13C NMR data
supported a molecular formula of C21H24O6. The 1H NMR spectrum displayed
signals for five aromatic protons ascribable to two aromatic rings: a signal at δ 5.32 (s), typical of the proton of a pentasubstituted aromatic ring and signals at δ 7.65 (dd, J = 8.2, 1.9 Hz), 7.32 (dd, J = 8.2, 1.9 Hz), 7.29 (dd, J = 8.2, 1.9 Hz), 6.99 (dd, J = 8.2, 1.9 Hz) (fig. 1.25 and table 1.4), due to the protons of a 1,4-disubstituted aromatic ring.
39
Figure 1.25. 1H NMR spectrum (600 MHz, CD3OD) of giffonin J (10).
The 1H NMR data displayed further signals due to a disubstituted cis-olefinic group at δ 6.35 (d, J = 12.0 Hz) and 5.48 (dt, J = 12.0, 6.0 Hz), and for two protons linked to an oxymethine carbon at δ 4.84 (dd, J = 10.7, 5.6 Hz) and 3.11 (tt, J = 9.0, 2.0 Hz) (table 1.4). Moreover, two signals for two methoxy groups at δ 4.03 and 3.68 were evident. The 13C NMR spectrum of 10 showed 21 carbon signals (table 1.4), typical of a diaryletherheptanoid derivative.
40
Table 1.4. 13C (150 MHz) and 1H NMR Data (600 MHz, CD3OD, ppm, J in Hz) of compounds
10 and 11. 10 11 C H (J in Hz) C H (J in Hz) 1 150.1 - 151.8 - 2 136.2 - 138.0 - 3 143.1 - 144.8 - 4 141.1 - 141.9 - 5 123.6 - 125.3 - 6 108.0 5.32, s 110.3 5.44, s 7 124.9 6.35, d (12.0) 125.2 6.37, d (11.4) 8 132.2 5.48, dt (12.0, 6.0) 129.1 6.03, dd (11.4, 9.2) 9 27.3 1.72, 1.92, m 127.0 5.62, dd (15.4, 9.2) 10 39.5 0.36, 1.07, m 139.2 5.59, dd (15.4, 8.6) 11 69.4 3.11, tt (9.0, 2.0) 71.3 3.84, m 12 50.1 1.65, 2.24, m 50.6 2.25, 1.72, m 13 73.5 4.84, dd (10.7, 5.6) 73.7 4.83a 14 141.8 - 143.0 - 15 130.2 7.32, dd (8.2, 1.9) 127.9 7.65, dd (8.4, 1.8) 16 123.1 6.99, dd (8.2, 1.9) 126.5 7.30, dd (8.3, 1.9) 17 156.4 - 157.6 - 18 125.4 7.29, dd (8.2, 1.9) 122.2 7.04, dd (7.9, 2.2) 19 127.9 7.65, dd (8.2, 1.9) 131.0 7.44, dd (8.3, 1.9) OCH3-2 61.3 4.03, s 61.3 4.06, s OCH3-4 61.3 3.68, s 61.2 3.69, s
41
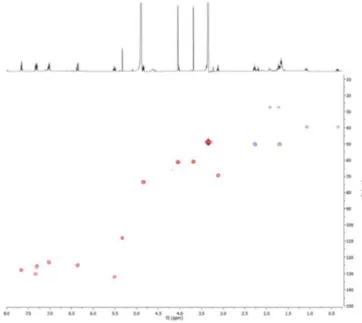
The HMBC correlations of H-6 (δ 5.32) with the 13C NMR resonances at δ 150.1 (C-1), 136.2 (C-2), 141.1 (C-4), 123.6 (C-5) and 124.9 (C-7), suggested the 1,2,3,4 tetrahydroxylation of the A-ring (fig. 1.26 and 1.27).
Figure 1.26. HSQC spectrum (CD3OD) of giffonin J (10).
42
A secondary hydroxy group was assigned to C-13 on the basis of the correlations of the proton signal at δ 4.84 with the 13C NMR resonances at δ 130.2 (C-15), 127.9 (C-19), and 141.8 (C-14). The HMBC correlations of the proton at δ 6.35 (H-7) with the 13C NMR resonances of the B ring at δ 141.1 (C-4), 123.6 (C-5) and 108.0 (C-6), and the linear connectivity observed in the COSY spectrum (fig. 1.28) from H-7 to H-13 were used to assign the heptanoid chain allowing the further secondary hydroxy group to be located at C-11 (69.4).
Figure 1.28. COSY spectrum (CD3OD) of giffonin J (10).
Finally, the HMBC correlations between the protons at δ 4.03 and 3.68 with the
13
C NMR resonances at δ 136.2 (C-2) and 141.1 (C-4), respectively, suggested that the methoxy groups are located at C-2 and C-4 of the B ring. Thus, on the basis of the above data, the planar structure of 10, named giffonin J, was determined as shown (fig. 1.29).
43 O H3CO OH OCH3 OH HO 1 2 3 4 5 6 8 9 10 11 12 13 7 14 15 16 17 18 19
Figure 1.29. planar structure of giffonin J.
The molecular formula of 11 was established as C21H22O6 by
ESI/LTQORBITRAP/MS and the 13C NMR data. HSQC data confirmed the same aromatic substitution patterns as in 10 (table 1.4). Furthermore, the 1H NMR spectrum displayed four signals at δ 6.37 (d, J = 11.4 Hz), 6.03 (dd, J = 11.4, 9.2 Hz), 5.62 (dd, J = 15.4, 9.2 Hz), 5.59 (dd, J = 15.4, 8.6 Hz), ascribable to Z- and
E- olefinic protons, respectively, and two signals at δ 4.83 (overlapped) and 3.84
(m), corresponding to protons linked to oxymethine carbons (table 1.4). The NMR data revealed that compound 11 differed from 10 for the presence of an additional double bond. The COSY, HSQC, and HMBC experiments supported a conjugated diene system (C-7/C-10) and the two hydroxy groups at C-11 (δ 71.3) and C-13 (δ 73.7). The foregoing spectroscopic data allowed the planar structure of compound
44
Figure 1.30. planar structure of giffonin K.
The 1H and 13C NMR spectra of compounds 12-16 showed signals ascribable to a diaryl heptanoid moiety. In particular, for compound 12, the 1H NMR spectrum showed signals attributable to two 1,2,4 trisubstituted aromatic rings at δ 7.04 (dd,
J = 8.2, 1.8 Hz), 7.01 (dd, J = 8.2, 1.8 Hz), 6.94 (d, J = 1.8 Hz), 6.81 (d, J = 8.2
Hz), 6.80 (d, J = 8.2 Hz), and 6.77 (d, J = 1.8 Hz) (table 1.5).
A detailed analysis of their NMR data showed that compounds 12-16 differed in terms of the occurrence of secondary hydroxy groups and carbonyl functions at various positions on the heptanoid chain (tables 1.5 and 1.6). A combination of HSQC, HMBC and COSY experiments permitted the determination of the linear connectivity from H-7/C-7 to H-13/C-13 of the heptanoid chain in compounds
12-16. O H3CO OH OCH3 OH HO
45
Table 1.5. 1H NMR Data (600 MHz, CD3OD, ppm, J in Hz) of compounds 12-16.
12 13 14 15 16 1 - - - - - 2 - - - - - 3 - - - - - 4 6.81, d (8.2) 6.78, d (8.1) 6.77, d (8.2) 6.84, d (8.2) 6.84, d (8.2) 5 7.01, dd (8.2, 1.8) 7.00, dd (8.1, 2.1) 7.02, dd (8.2, 1.8) 7.07 dd (8.2, 1.8) 7.08, dd (8.2, 1.8) 6 - - - - - 7 2.70, dd (15.9, 11.2) 3.13, dd (15.9, 2.8) 3.19, dd (15.4, 3.6) 2.56, dd (15.4, 11.4), 3.32, dd (15.2, 3.5) 2.63, dd (15.2, 11.4), 3.02, dd (16.0, 11.2) 3.08, dd (16.0, 3.8) 2.97, dd (16.4, 3.2) 3.04, m 8 4.21, td (11.2, 2.8) 4.63, m 4.69, m 4.73, dd (11.2, 3.8) 4.77, dd (11.3, 3.2) 9 2.59, dd (15.2, 11.2) 1.56, dd (15.2, 10.8), 2.46, dd (14.5, 11.6) 1.60, td (11.6, 3.4) 2.47, dd (14.6, 11.6) 1.77, td (11.6, 3.2) 4.83a 4.09, brs 10 4.40, brd (10.8) 4.43, dd (11.9, 3.4) 4.64, m - 4.19, d (10.1) 11 4.12, brs - - 2.35, dd (13.3, 9.4) 3.65, d (13.3) 4.04, d (10.1) 12 4.80, dd (11.4, 3.5) 2.91, 3.50, m 2.95, 3.53, m 4.52, m 4.27, brdd (9.9, 6.1) 13 3.02, dd (16.6, 11.4) 2-.97, dd (16.6, 3.5), 2.89, 3.16, m 2.85, dd (16.4, 3.6) 3.16, m 2.79, dd (16.6, 11.2) 3.18, dd (16.6, 2.5) 3.05, m 14 - - - - - 15 7.04, dd (8.2, 1.8) 7.08, dd (8.1, 2.1) 7.06, dd (8.2, 1.8) 7.07, dd (8.2, 1.8) 7.07, dd (8.2, 1.8) 16 6.80, d (8.2) 6.82, d (8.1) 6.80, d (8.2) 6.84, d (8.2) 6.80, d (8.2) 17 - - - - - 18 6.94, d (1.8) 6.56, d (1.8) 6.57, d (1.8) 6.90, d (1.8) 6.76, d (1.8) 19 6.77, d (1.8) 6.71, d (1.8) 6.68, d (1.8) 7.07, d (1.8) 6.82, d (1.8) - β-Glc (at C-8) - - 1 - - 4.46, d (8.0) - - 2 - - 3.26, dd (9.0, 8.0) - - 3 - - 3.42, dd (9.0, 9.0) - - 4 - - 3.24, dd (9.0, 9.0) - - 5 - - 3.39, m - -
46 6 - - 3.87, dd (12.0, 2.5) 3.62, dd (12.0, 4.5) - -
aOverlapped with the H
2O peak in CD3OD.
47
Table 1.6. 13C NMR Data (150 MHz, CD3OD, ppm) of compounds 12-16.
12 13 14 15 16 1 127.6 127.0 128.0 128.9, 128.7 2 128.0 127.7 127.0 128.7 128.7 3 153.8 153.8 154.0 153.9 152.8 4 117.3 117.0 117.2 117.2 116.8 5 129.8 130.0 130.2 130.3 130.3 6 131.4 130.1 134.0 130.1 130.3 7 40.4 40.9 37.0 36.7 34.7 8 68.9 67.6 75.2 69.5 70.0 9 42.8 42.1 40.3 76.1 68.8 10 78.7 76.1 75.2 210.3 79.2 11 70.9 217.4 219.3 46.5 68.8 12 69.7 36.6 36.7 68.0 69.7 13 35.3 24.8 24.7 40.7 36.2 14 130.6 130.8 130.6 129.3 131.4 15 129.8 129.3 129.3 130.3 130.3 16 117.3 117.1 117.2 117.2 116.8 17 153.9 153.1 153.1 153.7 152.8 18 134.5 134.3 134.2 135.1 135.4 19 134.8 134.3 134.2 135.1 135.2 - - β-Glc (at C-8) - - 1 - - 102.3 - - 2 - - 74.9 - - 3 - - 77.9 - - 4 - - 72.2, - - 5 - - 77.7 - - 6 - - 63.6 - -
48
The 13C NMR and ESI/LTQORBITRAP/MS data of 12 supported a molecular formula of C19H22O6. The 1H NMR spectrum of this compound showed signals
corresponding to four protons linked to oxymethine carbons at δ 4.80, 4.40, 4.21, and 4.12, which were assigned to C-12 (δ 69.7), C-10 (δ 78.7), C-8 (δ 68.9) and C-11 (δ 70.9), respectively, as supported by HMBC and COSY correlations. Thus, the planar structure of compound 12 (giffonin L) was elucidated as depicted (fig. 1.31). OH HO OH OH OH HO 2 3 4 5 6 7 8 9 10 11 12 13 14 15 16 17 1 18 19
Figure 1.31. planar structure of giffonin L.
The ESI/LTQORBITRAP/MS data of 13 in combination with the 13C NMR data supported a molecular formula of C19H20O5. The IR spectrum showed a band at
1720 cm-1 for the presence of a ketocarbonyl group. As with 12, HSQC data confirmed a diarylheptanoid core structure with oxymethine (δ 4.63, 4.43) proton resonances correlating with carbons at δ67.6 (C-8) and 76.1 (C-10), respectively. The carbonyl group could be located at C-11 (δ 217.4), on the basis of the HMBC correlations between H-10 (δ 4.43), H2-12 (δ 3.50, 2.91), H2-13 (δ 3.16, 2.89), and
H2-9 (δ 2.46, 1.60) with the carbon resonance at δ 217.4. Accordingly, the planar
49 OH HO OH OH O
Figure 1.32. planar structure of giffonin M.
The molecular formula of 14 was established as C25H30O10 by
ESI/LTQORBITRAP/MS and the 13C NMR data. The NMR data of 14 revealed that it differed from 13 by the presence of a β-glucopyranosyl unit (H-1glc = δ
4.46) (fig. 1.33 and tables 1.5 and 1.6).
50
The configuration of the glucose unit was established as D,after hydrolysis of 14 with 1 N HCI, trimethylsilation and GC analysis19. The sugar unit was located at C-8 on the basis of the HMBC correlation (fig. 1.34) between H-1glc (δ 4.46) and
C-8(δ 75.2), downfield shifted if compared with compound 13 (δ 67.6, C-8).
Figure 1.34. HMBC spectrum (CD3OD) of giffonin N (14).
On the basis of the data measured, the planar structure of compound 14 (giffonin N) was established as shown (fig. 1.35).
51 OH HO OGlc OH O
Figure 1.35. planar structure of giffonin N.
The molecular formula of 15 was established as C19H20O6 by
ESI/LTQORBITRAP/MS and the 13C NMR data. For the heptanoid chain, the NMR data showed the presence of three secondary hydroxy groups at C-8 (δH
4.73/δC 69.5), C-9 (δH 4.83/δC 76.1), and C-12 (δH 4.52/δC 68.0). Similar to 13, the
heptanoid chain contained a carbonyl group (δC 210.3), as suggested by an
absorption peak at 1725 cm-1 in the IR spectrum. This was assigned at C-10 on the basis of the HMBC correlations between H-9 (δ 4.83), H-8 (δ 4.73), H-12 (δ 4.52), and H2-11 (δ 3.65, 2.35) with the carbon resonance at δ 210.3. Therefore,
the planar structure of compound 15 (giffonin O) was defined as shown (fig. 1.36). OH O OH OH OH HO giffonin O
52
The 13C NMR and ESI/LTQORBITRAP/MS data of 16 allowed a molecular formula of C19H22O7 to be established. The proton sequence (δ 4.77, 4.09, 4.19,
4.04, and 4.27), as deduced from the COSY experiment was located at C-8 (δ 70.0), C-9 (δ 68.8), C-10 (δ 79.2), C-11 (δ 68.8) and C-12 (δ 69.7), on the basis of HSQC and HMBC experiments, revealing the presence of a highly hydroxylated heptanoid chain. Thus, on the basis of the above performed data the planar structure of 16 (giffonin P) was determined as reported (fig. 1.37).
Figure 1.37. planar structure of giffonin P.
In addition, four known flavonoid derivatives, myricetin 3-O-α-L-rhamnpyranoside20 (17), quercetin 3-O-α-L-rhamnopyranoside20 (18), kaempferol 3-O-α-L-rhamnopyranoside20 (19), and kaempferol 3-O-(4''-trans-p-coumaroyl)-α-L-rhamnopyranoside21 (20) were also isolated from the leaves of C. avellana in the present investigation.
Relative configurations of the diarylheptanoids 10-16
In collaboration with Prof. Giuseppe Bifulco (Department of Pharmacy, University of Salerno), the relative configurations of the reported compounds
10-16 were assigned. In particular, a combined QM/NMR approach, comparing the
experimental 13C/1H NMR chemical shift data and the related predicted values was used. This procedure was employed, since the chemical shifts are the most diagnostic parameters of the local chemical and magnetic environment and the most reliably addressable by quantum chemical calculations22.
OH HO OH OH OH HO HO giffonin P
53
For each compound considered, a proper sampling of the conformations was performed in order to attain a close agreement between calculated and experimental NMR parameters. For these reasons, an extensive conformational search at the empirical level (molecular mechanics, MM) for all the possible diastereoisomers of each investigated compound was carried out, combining Monte Carlo Molecular Mechanics (MCMM), Low-Mode Conformational Sampling (LMCS), and Molecular Dynamics (MD). Subsequently, the selected non-redundant conformers were submitted further to a geometry and energy optimization step at the density functional level (DFT). After the optimization of the geometries at the QM level, the newly selected conformers were used for the subsequent computation of the 13C and 1H NMR chemical shifts.
In detail, the conformational analysis revealed many degrees of freedom in the heptanoid chains connecting the two phenyl moieties, determining different geometries to be accounted in the final Boltzmann distribution. Furthermore, similar conformers differing in the presence/absence of intramolecular H-bonds between the hydroxy groups placed on adjacent carbons on the heptanoid chains were weighted energetically in the Boltzmann distribution according to the protic solvent (MeOH) “continuum model” considered in the QM calculations. The diaryl moieties also affected the conformational sampling, leading to various conformers specifically differing for the dihedral angles between the two aromatic groups and their final arrangements on the heptanoid chain.
Starting from the selected conformers, the 13C and 1H NMR chemical shifts for each investigated diastereoisomer were computed at the density functional level (DFT). Afterwards, for each atom of the investigated molecules, a comparison of the experimental and calculated 13C and 1H NMR chemical shifts was performed by computing the Δδ parameter. Finally, the relative configuration of each investigated compound was determined by calculating and comparing the mean absolute errors (MAEs) for all the possible diastereoisomers (table 1.7).
54
Table 1.7. 13C/1H MAE (ppm) Values Reported for all the Possible Relative Stereoisomers for Compounds 10-16. a # of ster eog enic cent ers # of possible relative stereoisom er stereoi somer relative configurati on # of sampled conformers 13 C MAE (ppm ) 1 H MAE (ppm) proposed structure 10 2 2 10a 12S*,14S* 24 1.63 0.22 O H3CO OH OCH3 OH HO 10b 12R*,14S* 25 1.73 0.28 11 2 2 11a 12S*,14S* 19 1.85 0.25 O H3CO OH OCH3 OH HO 11b 12R*,14S* 18 1.71 0.17 12 4 8 12a 8S*,10R*,1 1R*,12R* 16 4.37 0.36 OH HO OH OH OH HO 12b 8S*,10R*,1 1R*,12S* 17 2.77 0.34 12c 8S*,10R*,1 1S*,12R* 15 2.25 0.23 12d 8S*,10R*,1 1S*,12S* 17 2.05 0.34 12e 8S*,10S*,1 1R*,12R* 18 1.70 0.25 12f 8S*,10S*,1 1R*,12S* 15 1.37 0.16 12g 8S*,10S*,1 1S*,12R* 17 3.00 0.28 12h 8S*,10S*,1 1S*,12S* 18 3.07 0.21 13 2 2 13a 8S*,10S* 27 2.62 0.30 OH HO OH OH O 13b 8S*,10R* 28 2.08 0.19
55 14 2 2 14a 8S*,10S* 35 2.79 0.16 OH OGlc OH O HO 14b 8S*,10R* 34 2.50 0.14 15 3 4 15a 8S*,9R*,12 S* 18 3.21 0.31 HO OH O OH OH OH 15b 8S*,9R*,12 R* 20 1.50 0.18 15c 8S*,9S*,12 S* 18 2.06 0.23 15d 8S*,9S*,12 R* 20 2.61 0.35 16 4 8 16a 8S*,9R*,11 R*,12R* 19 3.56 0.34 HO OH OH OH OH OH HO 16b 8S*,9R*,11 R*,12S* 22 2.40 0.31 16c 8S*,9R*,11 S*,12R* 21 3.67 0.23 16d 8S*,9R*,11 S*,12S* 22 3.57 0.24 16e 8S*,9S*,11 R*,12R* 20 2.80 0.29 16f 8S*,9S*,11 R*,12S* 21 2.98 0.23 16g 8S*,9S*,11 S*,12R* 19 2.28 0.18 16h 8S*,9S*,11 S*,12S* 21 3.04 0.37 584 total sampled conformers aMAE = Σ[|(δ
exp – δcalcd)|]/n, summation through n of the absolute error values (difference of the
absolute values between corresponding experimental and 13C/1H chemical shifts), normalized to the number of the chemical shifts. The predicted relative configurations are highlighted in green.
56
In this way, the relative configurations of compounds 10-16, shown in figure 1.38, were assigned selecting the related diastereoisomers showing the lowest 13C/1H MAE errors (table 1.7).
O H3CO OH OCH3 OH HO O H3CO OH OCH3 OH HO 10 11 1 2 3 4 5 6 8 9 10 11 12 13 7 14 15 16 17 18 19 OH R3 OR1 OH R5 R4 2 3 4 5 6 7 8 9 10 11 12 13 14 15 16 17 1 18 19 R2 R1 R2 R3 R4 12 H OH OH OH 13 H OH O H 14 H OH O H 15 OH O H OH 16 OH OH OH OH R5 H H H H Glc