R E S E A R C H
Open Access
Neurocognitive impact of metal exposure
and social stressors among schoolchildren
in Taranto, Italy
Roberto G. Lucchini
1,2, Stefano Guazzetti
2,3, Stefano Renzetti
2*, Michele Conversano
4, Giuseppa Cagna
2,
Chiara Fedrighi
2, Augusto Giorgino
4, Marco Peli
2, Donatella Placidi
2, Silvia Zoni
2, Giovanni Forte
5,
Costanza Majorani
5, Anna Pino
5, Oreste Senofonte
5, Francesco Petrucci
5and Alessandro Alimonti
5Abstract
Background: Metal exposure is a public health hazard due to neurocognitive effects starting in early life. Poor socio-economic status, adverse home and family environment can enhance the neurodevelopmental toxicity due to chemical exposure. Disadvantaged socio-economic conditions are generally higher in environmentally impacted areas although the combined effect of these two factors has not been sufficiently studied.
Methods: The effect of co-exposure to neurotoxic metals including arsenic, cadmium, manganese, mercury, lead, selenium, and to socio-economic stressors was assessed in a group of 299 children aged 6–12 years, residing at incremental distance from industrial emissions in Taranto, Italy. Exposure was assessed with biological monitoring and the distance between the home address and the exposure point source. Children’s cognitive functions were examined using the Wechsler Intelligence Scale for Children (WISC) and the Cambridge Neuropsychological Test Automated Battery (CANTAB). Linear mixed models were chosen to assess the association between metal exposure, socio-economic status and neurocognitive outcomes.
Results: Urinary arsenic, cadmium and hair manganese resulted inversely related to the distance from the industrial emission source (β − 0.04; 95% CI -0.06, − 0.01; β − 0.02; 95% CI -0.05, − 0.001; β − 0.02 95% CI -0.05, − 0.003) while the WISC intellectual quotient and its sub-scores (except processing speed index) showed a positive association with distance. Blood lead and urinary cadmium were negatively associated with the IQ total score and all sub-scores, although not reaching the significance level. Hair manganese and blood lead was positively associated with the CANTAB between errors of spatial working memory (β 2.2; 95% CI 0.3, 3.9) and the reaction time of stop signal task (β 0.05; 95% CI 0.02, 0.1) respectively. All the other CANTAB neurocognitive tests did not show to be
significantly influenced by metal exposure. The highest socio-economic status showed about five points intellectual quotient more than the lowest level on average (β 4.8; 95% CI 0.3, 9.6); the interaction term between blood lead and the socio-economic status showed a significant negative impact of lead on working memory at the lowest socio-economic status level (β − 4.0; 95% CI -6.9, − 1.1).
Conclusions: Metal exposure and the distance from industrial emission was associated with negative cognitive impacts in these children. Lead exposure had neurocognitive effect even at very low levels of blood lead concentration when socio-economic status is low, and this should further address the importance and prioritize preventive and regulatory interventions.
Keywords: Metals, Neurotoxicity, Neurocognitive functions, Intellectual quotient, Social stressors, Schoolchildren
© The Author(s). 2019 Open Access This article is distributed under the terms of the Creative Commons Attribution 4.0 International License (http://creativecommons.org/licenses/by/4.0/), which permits unrestricted use, distribution, and reproduction in any medium, provided you give appropriate credit to the original author(s) and the source, provide a link to the Creative Commons license, and indicate if changes were made. The Creative Commons Public Domain Dedication waiver
(http://creativecommons.org/publicdomain/zero/1.0/) applies to the data made available in this article, unless otherwise stated.
* Correspondence:[email protected]
2Department of Occupational Health, University of Brescia, Piazzale Spedali
Civili, 1, 25123 Brescia, Italy
Background
The role of metals as potential determinants of neuro-logical diseases such as autism, attention deficit disorders and Alzheimer’s Dementia and Parkinson’s Disease is an emerging focus of human and public health research [1]. About 3% of developmental disabilities may be a conse-quence of environmental exposure to neurotoxicants and 25% of the interaction between environmental hazards and individual genetic predisposition [2, 3]. Extensive re-view of the current medical databases for chemicals that can be listed as developmental neurotoxicants [4], has shown about 100 molecules or elements, including six in-organic elements: aluminum (Al), manganese (Mn), ar-senic (As), lead (Pb), mercury (Hg), and cadmium (Cd). In the priority list of the USA Agency for Toxic Substances and Disease Registry (ATSDR), As, Pb, Hg, Cd, are re-spectively ranked as first, second, third, and seventh, based on their frequency, toxicity and potential for human ex-posure [5]. All these metals can cross the placenta and the blood-brain barrier [6,7], causing neurological impacts on general neurodevelopment [8–18], and more specifically on the Intellectual Quotient (IQ) [19], executive functions [20–22], memory [10, 21, 23], perceptual reasoning [23], and school performance [24,25]. Although with a narrow homeostatic margin of safety [26, 27], selenium (Se) is both a potential neurotoxic element [27], and a chelating antioxidant that can eliminate neurotoxic metals through 26 Se-proteins including glutathione peroxidase [28].
Similarly to metals, socio-economic status (SES), home and family environments, psychosocial stressors including social violence act as developmental toxicant [29–31]. Social stressors impact neuroendocrine, immunological and auto-nomic nervous system and trigger dysfunctional and toxic behaviors within the family (such as inadequate parenting and smoking habits) [32]. While mechanisms involved in neurotoxicity of metals and social/maternal stressors are complex, epidemiological and biological evidence suggest both exposures may impact cellular response and oxidative damage [33, 34], with joint exposure especially targeting mitochondrial response and dysfunction [35].
The objective of this study was to assess the effect of co-exposure to As, Pb, Hg, Cd, Mn, Se and socio-economic stressors on the intellectual abilities including the IQ and its sub-scores and the executive functions among 6–12 years old children characterized by a variety of levels of exposure including subjects residing in the heavily polluted and so-cially disadvantaged areas of Taranto, in southern Italy. Material and methods
Study area
Since 1964 the city of Taranto, in the Puglia region of south-ern Italy has been a highly industrial area that includes the largest iron- and steel-making operation in Europe and an oil refinery and a cement factory. The steel plant uses iron
mineral, limestone and coal which are melted at tempera-tures over 1000 °C causing the iron compounds to release ex-cess oxygen and turning into melted iron for steel production. This process causes airborne emission of metals, nitrogen oxides, sulphides, arsenide, carbon dioxide, organic compounds, and naturally occurring radionuclides, with po-tential contamination of water, soil and sediments. In 2002, the steel plant released the 30.6% of total dioxin emissions of Italy and in 2005 the estimated annual emission of Hg was over 2 tons [36]. Excess mortality, increased cancer incidence and hospital admission have been observed in this area com-pared to the local expected values [37], and biomonitoring measurements have shown increased levels of various toxic elements [38,39].
Sample selection and recruitment strategies
Five different sub-areas of Tamburi, Statte, Paolo VI, Taranto, Talsano, were identified at incremental distance from the industrial site, based on the average annual air monitoring data and particles deposition of urban pol-lutants measured in 2010 by the Environmental Agency (ARPA) of the Puglia Region [40]. Our power calculation estimated the total number of 300 children (aged 6–12, 50% males/females) were enrolled in the 12 primary schools located in the 5 sub-areas. Enrollment was ob-tained by informative meetings with children, their par-ents and teachers in each school and at a convenient schedule. Participation was voluntary and consented by the parents, as approved by the local Ethical Committee.
Overall 700 subjects were invited to participate to the study; 432 decided to adhere, yielding a participation rate of 62%, with no substantial differences among the study areas. Out of the 432 subjects 133 were excluded either because they did not meet the inclusion criteria of being born and raised in the target study areas, and having carried the en-tire pregnancy period of the mother in the same area at the time of recruitment or because of the exclusion criteria in-cluding familiarity of neurodegenerative diseases, diagnosis/ treatments for neurological and psychiatric illnesses, hep-atic or biliary diseases, dysmetabolic diseases, endocrine disorders, kidney disorders, previous total parenteral nutri-tion and uncorrected visual defects. In particular 21 sub-jects were excluded because they resulted as non-residents in the target areas, 16 because affected by clinical condi-tions, 2 for disagreement between the parents, 23 for refusal to participate after being enrolled, and 78 were recruited but not examined because the target population size of 300 subjects based on budgetary limitation was already reached, resulting in a final group of 299 participants.
Biomonitoring of metal exposure
Whole blood, urine and hair were collected in the schools 1 day before the neuropsychological testing. Measures of
Pb and Se in whole blood, As and Cd in urine, and Hg and Mn in hair were obtained with High Resolution-Inductively Coupled Plasma Mass Spectrometry (HR-ICP-MS) (ElementII, Thermo Scientific, Bremen, Germany). The analytical details are reported elsewhere [41,42]. Hair Hg was determined with Direct Mercury Analyzer (DMA-80 Tricell, FKV, Bergamo, Italy) [43] and hair Mn with ICP-MS. For each matrix, blanks and appropriate certified reference materials were included for all analytical runs; all analytical methods were accredited by the Italian Accreditation Institute (ACCREDIA). Limit of detection (LOD) was determined applying the 3σ criteria.
Sociodemographic and neuropsychological assessment
Quiet rooms were made available in each school for in-dividual assessment of sociodemographic and lifestyle data through the administration of questionnaires to parents. The SES was calculated according to Cesana et
al. [44] where parental education and occupation were classified based on age, level of education, occupational level and work-related stress perception, and then used to determine the three SES categories: low, medium and high. The distance from the point source was calculated for each participant as the distance between the home address and the closest point of the polygon delimiting the area of the steel plant (Fig.1).
Information about the home environment, especially cognitive stimulation was collected through the Home Observation for Measurement of the Environment (HOME) questionnaire [45]. The neuropsychological as-sessment was conducted by four trained neuropsycholo-gists who performed periodical inter-calibration of testing procedure and scoring. The testing protocol in-cluded the Italian version of the Wechsler Intelligence Scale for Children edition IV (WISC-IV) [46] (the Italian version of the most recent WISC-V is not yet available)
Fig. 1 Distance from the point source. A map of the spatial distribution of the residence of the subjects enrolled in the study is shown, highlighting the distance from the source of the exposure. The localization of the city of Taranto is also provided
for children’s cognitive assessment. The WISC-IV gener-ates a full-scale IQ and also four composite standard scores: Verbal Comprehension Index (VCI), Visual-Perceptual Reasoning Index (PRI), Working Memory Index (WMI) and Processing Speed Index (PSI). These indices then can be grouped in two other scores: VCI and PRI as part of the General Ability Index (GAI) and WMI and PSI as part of the Cognitive Proficiency Index (CPI). The GAI index represents the estimate of general intellectual ability while the CPI is an estimate of the ef-ficiency with which the information is processed in learning, problem solving and higher order reasoning. The executive functions were tested with the Rapid Visual Information Processing (RVP) to measure the sustained attention, Stop Signal Task (SST) for response inhibition, Spatial Working Memory (SWM) to provide measure of strategy and working memory errors and Stockings of Cambridge (SOC) to test spatial planning using problem-solving strategies, selected from the Cam-bridge Neuropsychological Test Automated Battery (CANTAB) [47]. The specific selected tests were the probability of hit and the total false alarms for the RVP, the between errors and the strategy for the SWM, the errors on stop and go trials, proportion of successful stops, mean correct reaction time, stop signal delay, stop signal reaction time and the total correct on stop and go trials for the SST and the problems solved in minimum moves for the SOC. The Raven’s progressive matrices (Standard Progressive Matrices, SPM) was utilized to as-sess the maternal non-verbal intellectual efficiency [48].
Statistical analysis
Descriptive statistics were analyzed globally and strati-fied by categorized distance from the source of emission (0–1 km, 1–5 km, 5–10 km, 10–15 km). Median, 1st and 3rd quartiles were chosen as summary statistics for the biomarkers, as they exhibited strongly asymmetrical dis-tributions. Preliminary comparison of the neurocognitive scores among the distance categories was performed with non-parametric Kruskal Wallis rank-sum test.
CANTAB RVP probability of hit was area hyperbolic sine transformed and SST mean correct reaction time on go trials and stop signal reaction time were log-transformed to gain a normal distribution. A logarithmic transformation was applied to the concentration of metal to allow linearization and mitigate the effect of ex-treme values. Biomarkers values were also standardized to have a better interpretability when the interaction term with the SES was applied. The relationship between exposure biomarkers, SES and neuropsychological out-comes was tested with mixed effects linear regression models to consider the nested structure of the data where the levels from the lower to the upper were class, school and area of residence. Bootstrap confidence
intervals (CI) were used to test for significance of the pa-rameters estimated in the models. To avoid a sample size reduction in multivariate analysis, we included the values <LOD in the dataset since they represent a pro-portion of observations lying within the distribution’s quantiles, and therefore can be considered informative.
The assessment of linearity between the independent variables and the outcomes was conducted preliminarily (not shown here) by using generalized additive models (GAMs) [49].
In addition to the effect of the exposure biomarkers and SES all regression models were adjusted for the co-variates that we hypothesize to influence cognitive func-tions like sex, age, maternal non-verbal intelligence and cognitive stimulation besides the confounder distance from the point source. All statistical analyses, tables and graphs were performed with R 3.5.2 [50].
Results
The socio-demographic data for the entire population which was also divided into four groups representing categorized increasing distance from the point source, are reported in Table1.
Subjects were similarly distributed for age and sex, but not for SES, which was significantly lower in the areas closer to the emission sources (only 2%, Chi-squared p-value < 0.001) compared to those living at greater distance (34.7 and 26.7% of subjects with high SES at 5–10 km and 10–15 km respectively). Maternal SPM
(Kruskall-Wallis rank sum test p-value = 0.005) and
the HOME total score (Kruskall-Wallis rank sum test p-value < 0.001) showed a significant increase with the distance where the subjects at closer distance from the source had minor cognitive stimulation from the home environment. A much higher percentage of females characterized the subjects at closer distance while the proportion of gender at other distances was well balanced.
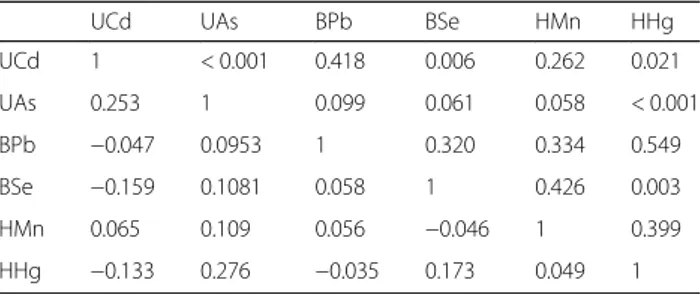
Descriptive statistics of biomonitoring data and their association with the distance from the source are shown in Table 2. Apart from BSe and HHg, all metal concen-trations show a significant decrease at increasing dis-tance, while BPb shows a non-significant decreasing trend. Table 3presents the Spearman correlation matrix showing a moderate correlation among biomonitoring values: the highest correlation coefficient is between UAs and HHg of 0.276.
Table 4 shows the values of the IQ total score and sub-scores and the CANTAB tests in the total group and grouped by the categorized distance from the point source. The IQ total score and all the subtests, except PSI, showed significantly lower values at closer distance from the point source. Remarkably, the subjects residing at closer distance (0–1 km) from the emission sources
showed a total IQ score of 15 points lower compared to those residing at greater distance (10–15 km).
The CANTAB tests showed a similar trend, but only SWM between errors and strategy showed a statistically significant difference among the categorized distance (between errors: 60.0, 56.0, 51.0, 54.0 at 0–1, 1–5, 5–10 and 10–15 km respectively; strategy: 39.0, 38.0, 37.5, 38.0 at 0–1, 1–5, 5–10 and 10–15 km respectively).
We assessed the independent association of metal ex-posure and SES with the IQ total score and sub-scores and the CANTAB tests using a linear mixed model to consider the non-independence related to the school, the school class and the area of residence of each sub-jects, through nested random effects, adjusting for age, sex, maternal SPM, HOME total score, and distance from the point source (Table5). None of the metals was individually associated with the IQ total and sub-scores, but considering the 95% CI of those parameters that showed a negative trend, BPb showed an upper limit close to zero in the association with IQ, GAI, CPI and VCI, similarly to UCd with IQ, GAI, CPI, WMI and VCI. The SES resulted associated with the IQ score, with highest levels showing IQ, GAI and WMI of about 5
points higher than the lowest SES level, and VCI around 7 points higher than the lowest SES level (IQ: βhigh SES 4.8; GAI:βhigh SES5.6; WMI:βhigh SES5.3; VCI:βhigh SES 7.1) which means a relative percentage change of about 6, 7 and 9% respectively, considering the ranges of the three cognitive outcomes ((64, 143), (61, 139), (64, 144) respectively).
In the mixed effect models the distance from the ex-posure source showed a positive significant association with the IQ total score and the IQ sub-scores WMI, PRI and VCI. The HOME total score was positively associ-ated with the IQ, GAI and CPI. Maternal SPM was posi-tively associated with the IQ and VCI (data not shown).
Considering the CANTAB scores, we noticed add-itional associations between executive functions and some of the biomarkers. After adjusting for all the covar-iates, HMn and BPb was associated with higher number of errors in SWM and higher reaction time in SST. Al-though not significant, a negative association was also observed between BPb and proportion of successful stops at SST. The SES and the distance from the point source were not found to be associated with the CAN-TAB scores.
Table 1 Socio-demographic characteristics
TotalN = 299 0–1 km N = 51 1–5 km N = 55 5–10 km N = 118 10–15 km N = 75 N (%) Sex Female 161 (53.8) 39 (76.5) 29 (52.7) 55 (46.6) 38 (50.7) SES Low 124 (41.5) 35 (68.6) 26 (47.3) 38 (32.2) 25 (33.3) Medium 103 (34.4) 15 (29.4) 19 (34.5) 39 (33.1) 30 (40.0) High 72 (24.1) 1 (2.0) 10 (18.2) 41 (34.7) 20 (26.7) Mean (SD) Age (yrs) 8.6 (1.5) 8.9 (1.6) 8.6 (1.4) 8.3 (1.4) 9.0 (1.5) Maternal SPM 65.7 (23.8) 55.3 (24.9) 63.5 (8.1) 67.6 (21.7) 71.2 (20.9) Distance (km) 6.3 (4.1) 0.7 (0.2) 2.7 (1.5) 7.2 (1.7) 11.5 (0.9) HOME 5.5 (1.8) 4.7 (1.6) 5.6 (1.7) 5.8 (1.6) 5.8 (1.7)
Notes: Socio-demographic characteristics of the total population sample and divided by area of residence SPM Standard Progressive Matrices, HOME Home Observation for Measurement of the Environment
Table 2 Biomarkers summary statistics
Min Q1st Median Q3rd Max β coeff 95% CI
UAs (ng/mL) 1.1 5.1 8.3 15.1 797.3 −0.04 − 0.06, − 0.01 UCd (ng/mL) 0.0 0.3 0.4 0.7 1.8 −0.02 −0.05, − 0.001 HHg (ng/g) 21.2 271.1 476.6 744.7 4,357.0 0.04 0.02, 0.07 HMn (ng/g) 12.0 87.9 135.3 202.4 2,597.0 −0.02 −0.05, − 0.003 BPb (ng/mL) 2.6 6.4 8.4 11.0 35.9 −0.001 −0.01, 0.01 BSe (ng/mL) 82.2 126.8 142.7 161.0 263.0 0.01 0.001, 0.01
Notes: Biomarkers descriptive statistics andβ coefficients and 95% confidence intervals (CI) of the association with the distance from the source (km)
Further analysis was performed adding in the model the interaction term between the SES and each bio-marker, and adjusting for all the covariates age, sex, ma-ternal SPM, HOME total score, and distance from the point source. The relationship between the SES and the neurocognitive score remained similar, while we ob-served different relations between the BPb concentration and the IQ scores, depending on the SES levels: BPb showed a negative significant association with WMI in the lowest SES level (Table6).
A sensitivity analysis was performed to test the influence of the extreme metal concentrations and no differences were found among the statistically significant associations between metal concentrations and the outcomes.
To provide a better understanding of the role of the interaction between SES and BPb on cognitive out-comes, Fig.2 illustrates the heatmaps for IQ and WMI. For each plot, the predicted values of the model were represented by SES, with BPb concentration varying among the quintiles while the other covariates (age, ma-ternal SPM, HOME total score, and distance from the point source) were fixed at their mean values, and choosing sex equal to female (results for males are simi-lar). Both heatmaps show decreasing levels of the IQ and WMI at increasing quintiles of BPb concentration for the lower level of SES, whereas no variation of the IQ and WMI is notable at medium and high SES levels. Discussion
This study revealed that subjects with higher SES showed better neurocognitive scores compared to those with lower SES. A significant interaction of metal expos-ure with SES was also observed: a higher BPb level for subjects in the lower SES was associated with a statisti-cally significant lower WMI.
The exposure was measured through the biomonitor-ing measurement of metals known for their neurotoxic properties, and the results showed increasing levels at lower distance from the point source for most metals. To interpret the biomonitoring data, we considered
results from other available references. Urinary As re-sulted higher than the median of 4.5 ng/mL measured by the German Environmental Survey (GerES IV) in 1,734 children, also considering fish eaters (6.2 ng/mL) [51]. It is also higher than the US National Health and Nutrition Examination Survey (NHANES) that showed a median value of 4.8 ng/mL for the 6–11 years age group in the
2013–14 survey [52] and compared to both non-rice
eaters (5.3 ng/mL) and rice eaters (8.6 ng/mL) of the same age class [53]. Speciation analysis of As was con-ducted on 21 urine samples exceeding the value of 50 ng/mL, which is the German biological tolerance value (BAT) for As [54]. The analysis (data not shown) identi-fied six species: As+ 3, As+ 5, As-Choline,
mono-methylaronic acid (MMA), dimethyl-arsenic acid
(DMA), and mostly As-Betaine, which is introduced in
human body by seafood consumption [55]. The total
concentration of the most toxic species As+ 3, As+ 5 was about 1 ng/mL, which is below the level of potential clinical health hazards.
Urinary Cd was overall (0.4 ng/mL) higher than the median from the NHANES for the 6–11 age group, which was 0.06 ng/mL in the 2009–10 survey [56] and below limit of detection (<LOD) (0.036 ng/mL) in the 2013–14 survey [52], and to the GerES IV (0.08 ng/mL) [51]. A total of 174 (42%) measurements exceeded the human biomonitoring values (HBM-I) of 0.5 ng/mL [57]. The overall median of 477 ng/g for HHg was higher than the values reported from other studies in Brazil (70 ng/g) [58], Czech Republic (190 ng/g) [59]; and in 17 EU Coun-tries, where a geometric mean (GM) of 150 ng/g was mea-sured in a 2010–2012 survey on 120 children 6–11 years [60]. A similar concentration was reported in South West Spain (GM: 407 ng/g, 220 children 6–9 years) [61], France (GM: 370 ng/g, 1364 children 3–17 years [62] and China (GM: 569.8 ng/g, 581 children 0–6-years) [63]. Our values are instead lower compared to those observed in Japan in 335 children of 7 years [64]. Median BPb (8.4 ng/mL) was lower than the median of other Italian studies: 15 ng/mL, measured by our group in a cohort of 11–14 years old chil-dren residing in Brescia [16], but similar (9.1 ng/mL) to the PROBE-Adolescent cohort from Latium [65]. It was also lower compared to the GerES IV median of 16.9 ng/mL [51], and higher than the NHANES median value of 7.0 measured in the 2013–14 survey [52]. The median Hair Mn (HMn) value of 135 ng/g measured in this study is higher than the median value of 73 ng/g, obtained from ad-olescents residing in Brescia after a rigorous preanalytical cleaning methodology [66]. The median of blood Se (BSe) (142 ng/mL) was lower than the NHANES value for the 2013–14 survey of 180 ng/mL.
The SES and maternal educational levels resulted also significantly lower at closer distance from the point source compared to the other study areas; especially when
Table 3 Spearman correlation among biomarkers
UCd UAs BPb BSe HMn HHg
UCd 1 < 0.001 0.418 0.006 0.262 0.021 UAs 0.253 1 0.099 0.061 0.058 < 0.001 BPb −0.047 0.0953 1 0.320 0.334 0.549 BSe −0.159 0.1081 0.058 1 0.426 0.003 HMn 0.065 0.109 0.056 −0.046 1 0.399 HHg −0.133 0.276 −0.035 0.173 0.049 1
Notes: The lower triangle of the matrix shows the Spearman’s correlation
coefficients; the upper triangle shows the p-values related to the null
hypothesisρ = 0
UAs Urinary arsenic, UCd Urinary cadmium, UHg Urinary mercury, HHg Hair mercury, BPb Blood lead, HMn Hair manganese, BSe Blood selenium
looking at 0–1 km distance we found a striking lower per-centage of subjects with high SES. For instance, SES was positively associated with the IQ sub-scores VCI and WMI, which may reflect a specific socio-economic impact on these two cognitive abilities, whereas the PSI sub-score resulted affected by maternal SPM, potentially reflecting a genetic influence.
Significant associations resulted between some of the CANTAB scores and BPb and HMn levels, with a lower proportion of successful stops and higher stop signal re-action time in the SST tests at increasing BPb levels, and higher between errors in the SWM tests at increasing HMn levels. The CANTAB tests are designed to target more specific executive functions, whereas the WISC-IV examines more general composite scores of neuro-cognitive abilities. This may explain why associations with
the exposure biomarkers were more evident for the CAN-TAB tests than for the IQ total and sub-scores, for which the effect of metal exposure may be mitigated by other factors like verbal intelligence or perceptual reasoning.
In fact, by adding an interaction term between the SES and the exposure biomarkers we were able to observe that BPb had a significant negative effect on IQ and WMI for subjects at the lowest SES level. Different studies have highlighted the neurotoxic effects of Pb [8, 67–72], but not assessing the interaction with the SES to test a pos-sible enhancement of the effect. Through the interaction term we were able to find an association between the con-centration of BPb and the cognitive abilities among the subjects with a lower SES level that was masked by the higher levels of SES when analyzing the association with-out including the interaction term in the model.
Table 4 Neurocognitive outcomes summary statistics
Total 0–1 km 1–5 km 5–10 km 10–15 km P-value† WISC-IV IQ 106.0 (94.0, 115.0) 94.0 (87.0, 107.0) 98.0 (90.5, 110.0) 108.0 (97.5, 118.0) 110.0 (99.5, 118.0) < 0.001 GAI 108.0 (96.0, 116.0) 99.0 (88.0, 110.5) 102.0 (91.5, 114.0) 109.5 (101.0, 119.0) 112.0 (101.5, 122.5) < 0.001 CPI 100.0 (91.0, 109.0) 94.0 (85.0, 102.5) 98.0 (87.0, 104.0) 104.0 (92.0, 111.0) 104.0 (94.0, 111.5) < 0.001 WMI 100.0 (88.0, 109.0) 88.0 (82.0, 100.0) 94.0 (88.0, 100.0) 100.0 (94.0, 109.0) 106.0 (91.0, 109.0) < 0.001 PSI 103.0 (94.0, 112.0) 103.0 (91.7, 111.2) 100.0 (91.0, 109.0) 103.0 (94.0, 112.0) 103.0 (93.2, 109.0) 0.379 PRI 106.0 (95.0, 117.0) 98.0 (90.5, 111.0) 99.0 (89.0, 111.0) 108.0 (100.0, 117.0) 109.5 (98.5, 119.0) < 0.001 VCI 108.0 (98.0, 118.0) 98.0 (88.0, 108.5) 104.0 (92.0, 112.5) 110.0 (102.0, 118.0) 112.0 (105.5, 122.0) < 0.001 CANTAB RVP Probability of hit 0.8 (0.7, 0.9) 0.750 (0.667, 0.896) 0.8 (0.6, 0.9) 0.8 (0.7, 0.9) 0.8 (0.7, 0.9) 0.170
Total false alarms 2.0 (1.0, 3.5) 2.0 (0.5, 3.0) 2.0 (1.0, 4.0) 2.0 (1.0, 3.0) 1.0 (1.0, 3.5) 0.055
SWM
Between errors 54.0 (41.5, 63.0) 60.0 (43.0, 68.0) 56.0 (41.0, 64.0) 51.0 (39.0, 60.0) 54.0 (42.5, 61.5) 0.025
Strategy 38.0 (36.0, 40.0) 39.0 (37.0, 42.0) 38.0 (36.0, 40.0) 37.5 (35.0, 39.0) 38.0 (36.0, 40.5) 0.026
SST
Direction errors on stop and go trials
3.0 (1.0, 7.0) 2.0 (0.5, 3.0) 3.0 (1.0, 6.5) 3.0 (1.0, 7.0) 3.0 (1.0, 8.5) 0.091
Proportion of successful stops 0.5 (0.4, 0.6) 0.5 (0.5, 0.6) 0.5 (0.4, 0.6) 0.5 (0.4, 0.6) 0.5 (0.4, 0.6) 0.662
Mean correct reaction time on go trials
722.0 (625.8, 878.4) 725.7 (655.6, 938.8) 703.8 (609.3, 884.9) 742.8 (633.6, 889.9) 691.5 (616.0, 803.7) 0.187
Stop signal delay 384.8 (286.5, 496.5) 404.4 (337.7, 478.8) 384.8 (271.7, 502.9) 398.1 (265.8, 526.7) 356.7 (283.4, 440.2) 0.219
Stop signal reaction time 282.1 (234.0, 344.8) 274.2 (236.8, 355.5) 285.8 (233.4, 341.8) 294.1 (240.6, 345.2) 271.5 (224.1, 334.4) 0.578
Total correct on stop and go trials
282.0 (275.0, 288.0) 283.0 (280.0, 289.0) 281.0 (275.0, 289.5) 282.0 (275.0, 289.0) 280.0 (273.0, 286.0) 0.188 SOC
Problems solved in minimum moves
6.0 (5.0, 7.0) 7.0 (5.0, 8.0) 6.0 (5.0, 6.5) 6.0 (5.0, 7.0) 6.0 (5.0, 7.0) 0.071
Notes: Neurocognitive outcomes from the WISC-IV and CANTAB by distance from the source - Median (Q1, Q3)
WISC-IV Wechsler Intelligence Scale for Children edition IV, IQ Intellectual Quotient, VCI Verbal Comprehension Index, PRI Visual-Perceptual Reasoning Index, WMI Working Memory Index, PSI Processing Speed Index, GAI General Ability Index, CPI Cognitive Proficiency Index, CANTAB Cambridge Neuropsychological Test Automated Battery, RVP Rapid Visual Information Processing, SST Stop Signal Task, SWM Spatial Working Memory, SOC Stockings of Cambridge
Table 5 Linear mixed effect model testing metals and SES association with neurocognitive ou tcomes SES Mid vs Low SES Hig h vs Lo w log (BPb ) log (HMn ) log (HHg) log (UAs) log (UCd) log (BSe) WISC IV IQ 1.3 (− 2.3, 5.2) 4.8 a (0.3, 9.6) − 1. 1 (− 2.7, 0.6) 0.2 (− 1.6, 1.7) − 0.03 (− 1.9, 1.8) 0.9 (− 1.0, 2.7) − 1.2 (− 3.0, 0.6) 0.1 (− 1.6, 1.9) GA I 1.3 (− 2.5, 5.6) 5.6 a (0.6, 11.1) − 1.5 (− 3.3, 0.2) 1.1 (− 0.6, 2.9) − 0.9 (− 2.9, 1. 1) 1.7 (− 0.2, 3.6) − 1.2 (− 2.9, 0.7) 0.3 (− 1.5, 2.4) CPI 0.6 (− 3.1, 4.5) 2.1 (− 2.8, 7.0) − 1.2 (− 2.8, 0.5) − 1.1 (− 2.8, 0.6) 0. 5 (− 1.2, 2.2) − 0.1 (− 2. 0, 1. 8) − 1.4 (− 3.1, 0.3) − 0.1 (− 1.8, 1.5) WM I 1.9 (− 2.1, 6.1) 5.3 a (0.6, 10.0) − 0. 6 (− 2.3, 1.2) 0.9 (− 1.0, 2.6) − 0.4 (− 2.2, 1. 4) 0.8 (− 1.1, 2.3) − 1.0 (− 2.8, 0.6) − 0.1 (− 1.9, 1.6) PSI 1.9 (− 1.7, 5.6) − 1.2 (− 6.2, 3.1) 0.1 (− 1.6, 1.6) − 0. 1 (− 1.6, 1.6) − 0.3 (− 2.1, 1.5) − 0.6 (− 2. 3, 1. 2) − 0.6 (− 2.2, 1.1) − 0.2 (− 1.9, 1.6) PR I − 0. 4 (− 4.1, 3.3) 1.3 (− 3.3, 6.4) − 0. 2 (− 1.9, 1.5) 0.9 (− 0.7, 2.6) − 1.4 (− 3.3, 0.5) 0.7 (− 1.1, 2.5) − 0.7 (− 2.3, 1.1) 0.1 (− 1.7, 1.8) VCI 2.4 (− 1.6, 6.5) 7.1 a (1.4, 12.7) − 1. 5 (− 3.3, 0.2) 0.7 (− 1.2, 2.6) 0. 3 (− 1.6, 2.2) 1.4 (− 0.4, 3.3) − 1.2 (− 2.9, 0.8) 1.0 (− 0.7, 3.0) CANT AB Betw een errors 3.0 (− 1.1, 7.1) − 1.1 (− 6.5, 4.2) − 0. 5 (− 2.1, 1.4) 2.2 a (0.3, 3.9) 0. 3 (− 1.5, 2.2) − 1.6 (− 3. 4, 0. 4) − 0.1 (− 2, 1.6) − 0.6 (− 2.5, 1.2) Prop ortio n of successful stops 0.02 (− 0.01, 0. 05) − 0.001 (− 0. 04, 0.04) − 0. 01 . (− 0.02, 0. 001) − 0.01 (− 0. 02, 0.002) 0. 002 (− 0.01, 0.02) − 0.003 (− 0.02, 0.01 ) 0.01 (− 0.002, 0.02 ) 0.01 (− 0.001, 0.03) Sto p signal reaction time − 0.05 (− 0.1, 0.02 ) − 0.03 (− 0.1, 0.1) 0.05 a(0.02, 0.1) 0.02 (− 0.02, 0. 04) 0. 03 (− 0. 003, 0.1) − 0.02 (− 0.05, 0.01) − 0.003 (− 0.03 , 0.03) − 0.01 (− 0.04 , 0.02) Notes: Linear mixed effect model β coefficients and 95% confidence intervals for SES and all biomarkers for the association with IQ and its sub-scores. All the models were adjusted for a ge, sex, maternal SPM, HOME total score, and distance from the point source SES Socio-econom ic status, UAs Urinary arsenic, UCd Urinary cadmium, UHg Urinary mercury, HHg Hair mercury, BPb Blood lead, HMn Hair manganese, BSe Blood selenium, WISC-IV Wechsler Intelligence Scale for Children edition IV, IQ Intellectual Quotient, VCI Verbal Comprehension Index, PRI Visual-Perceptual Reasoning Index, WMI Working Memory Index, PSI Processing Speed Index, GAI General Ability Index, CPI Cognitive Proficiency Index, CANTAB Cambridge Neuropsycho logical Test Automated Battery .Nearly significant difference from 0 aStatistically significant difference from 0
Due to the cross-sectional nature of the design, it is not possible to infer a causative role of neurotoxic agents on cognitive alterations, and considering the lack of environmental monitoring data, it is not possible to identify the exact exposure sources. Nevertheless, this first assessment yielded relevant initial results although
with some limitations that can be addressed in future studies: i) the study power was probably insufficient to fully capture the association between the biomarkers and the IQ scores, therefore a study extension to a larger population is warranted; ii) the exposure assessment lacked environmental measurement and also assessment of
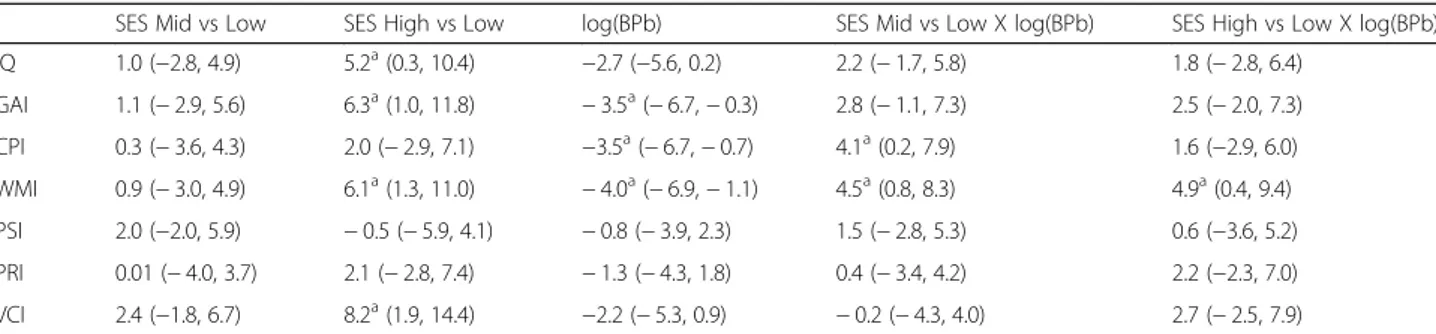
Table 6 Linear mixed effect model testing SES and biomarkers interaction term association with neurocognitive outcomes
SES Mid vs Low SES High vs Low log(BPb) SES Mid vs Low X log(BPb) SES High vs Low X log(BPb)
IQ 1.0 (−2.8, 4.9) 5.2a(0.3, 10.4) −2.7 (−5.6, 0.2) 2.2 (− 1.7, 5.8) 1.8 (− 2.8, 6.4) GAI 1.1 (− 2.9, 5.6) 6.3a(1.0, 11.8) − 3.5a(− 6.7, − 0.3) 2.8 (− 1.1, 7.3) 2.5 (− 2.0, 7.3) CPI 0.3 (− 3.6, 4.3) 2.0 (− 2.9, 7.1) −3.5a(− 6.7, − 0.7) 4.1a(0.2, 7.9) 1.6 (−2.9, 6.0) WMI 0.9 (− 3.0, 4.9) 6.1a(1.3, 11.0) − 4.0a(− 6.9, − 1.1) 4.5a(0.8, 8.3) 4.9a(0.4, 9.4) PSI 2.0 (−2.0, 5.9) − 0.5 (− 5.9, 4.1) − 0.8 (− 3.9, 2.3) 1.5 (− 2.8, 5.3) 0.6 (−3.6, 5.2) PRI 0.01 (− 4.0, 3.7) 2.1 (− 2.8, 7.4) − 1.3 (− 4.3, 1.8) 0.4 (− 3.4, 4.2) 2.2 (−2.3, 7.0) VCI 2.4 (−1.8, 6.7) 8.2a(1.9, 14.4) −2.2 (− 5.3, 0.9) − 0.2 (− 4.3, 4.0) 2.7 (− 2.5, 7.9)
Notes: Linear mixed effect modelβ coefficients and 95% confidence intervals (CI) for SES, BPb concentration and the interaction term between SES and BPb for
the association with IQ and its sub-scores. All the models were adjusted for age, sex, maternal SPM, HOME total score, and distance from the point source SES Socio-economic status, BPb blood lead, IQ Intellectual Quotient, VCI Verbal Comprehension Index, PRI Visual-Perceptual Reasoning Index, WMI Working Memory Index, PSI Processing Speed Index, GAI General Ability Index, CPI Cognitive Proficiency Index
a
Statistically significant difference from 0
Fig. 2 SES and BPb interaction effect on IQ and WMI. Heatmaps of IQ and WMI scores by SES and BPb quintiles, fixing all the other variables (age, maternal SPM, HOME total score, and distance from the point source) equal to their mean and looking at females (males have similar results)
organic compounds such as PCBs and dioxins that are also known for neurodevelopmental effects; iii) earlier more vul-nerable exposure windows including prenatal and postnatal periods, which were not assessed by the biomonitoring as-sessment that covered only current exposure.
Moreover, future additional analysis will be needed to address the potential interactions between the different metals within the context of mixed exposure. Finally, the socio-economic factors independently responsible for the impact on the children’s IQ, need to be further in-vestigated and more accurately defined in view of future potential preventive intervention.
Conclusions
This study provides evidence of neurological effects po-tentially due to the environmental exposure to metal ex-posure and their interaction with socio-economical stressors in the area of Taranto, Italy. To the best of our knowledge, this is the first study investigating the impact of metal exposure and socio-economical stressors on neurocognitive outcomes among school age children liv-ing in this highly polluted environment of southern Italy.
Abbreviations
ADHD:Attention Deficit Hyperactivity Disorder; As: Arsenic; BPb: Blood lead;
BSe: Blood selenium; CANTAB: Cambridge Neuropsychological Test Automated Battery; CBCL: Child Behavior Checklist; Cd: Cadmium; CPI: Cognitive Proficiency Index; GAI: General Ability Index; Hg: Mercury; HHg: Hair mercury; HMn: Hair manganese; HOME: Home Observation for Measurement of the Environment; IQ: Intellectual Quotient; LOD: Limit of detection; Mn: Manganese; Pb: Lead; PRI: Visual-Perceptual Reasoning Index; PSI: Processing Speed Index; RVP: Rapid Visual Information Processing; SES: Socio-economic status; SOC: Stockings of Cambridge; SPM: Standard Progressive Matrices; SST: Stop Signal Task; SWM: Spatial Working Memory; UAs: Urinary arsenic; UCd: Urinary cadmium; UHg: Urinary mercury; VCI: Verbal Comprehension Index; WISC-IV: Wechsler Intelligence Scale for Children edition IV; WMI: Working Memory Index
Acknowledgements
We would like to thank all the participating children and their families, the teachers and school authorities of Taranto, for their outstanding contribution to this study.
Authors’ contributions
RGL; study design and coordination, data analysis and interpretation. SG; study design and coordination, data analysis and interpretation. SR; manuscript drafting, data analysis and interpretation. MC; study design and coordination. GC; data acquisition. CF; data acquisition. AG; data acquisition. MP; data acquisition. DP; data analysis and interpretation. SZ; data acquisition. GF; data acquisition. CM; data acquisition. AP; data acquisition. OS; data acquisition. FP; data acquisition. AA; study design and coordination. All authors have read and approved the final manuscript.
Funding
The study presented herein was performed with the support of the project funded by the Italian Ministry of Health: CCM 2013“Biomonitoring and toxicity of pollutants in the territory of Taranto, Italy”. It was also funded by the National Institute of Environmental Health Sciences (NIH/NIEHS) [R01ES019222, R56ES019222].
Availability of data and materials
The datasets used and/or analyzed during the current study are available from the corresponding author on reasonable request.
Ethics approval and consent to participate
This study obtained the approval of the Ethical Committee of Local Public Health (ASL, Azienda Sanitaria Locale) of Brindisi, with the jurisdiction on Taranto province.
Consent for publication Not applicable.
Competing interests
The authors declare that they have no competing interests.
Author details
1Icahn School of Medicine at Mount Sinai, New York, USA.2Department of
Occupational Health, University of Brescia, Piazzale Spedali Civili, 1, 25123
Brescia, Italy.3Department of Public Health, Azienda USL– IRCCS, Reggio
Emilia, Italy.4Department of Public Health, ASL, Taranto, Italy.5Department of
Environment and Health, Italian National Institute of Health, Rome, Italy.
Received: 8 February 2019 Accepted: 10 July 2019
References
1. Schofield K. The metal neurotoxins: an important role in current human neural epidemics? Int J Environ Res Public Health. 2017;14(12). doi:https:// doi.org/10.3390/ijerph14121511.
2. Toxicology NRCCoD. Scientific frontiers in developmental toxicology and risk assessment. Washington (DC): National Academies Press (US); 2000. Copyright 2000 by the National Academy of Sciences. All rights reserved 3. Landrigan PJ, Lambertini L, Birnbaum LS. A research strategy to discover the
environmental causes of autism and neurodevelopmental disabilities. Environ Health Perspect. 2012;120(7):a258–60.
4. Mundy WR, Padilla S, Breier JM, Crofton KM, Gilbert ME, Herr DW, et al. Expanding the test set: chemicals with potential to disrupt mammalian brain development. Neurotoxicol Teratol. 2015;52(Pt A):25–35.
5. ATSDR (Agency for Toxic Substances and Disease Registry). Summary data for 2013 priority list of hazardous substances. Available from:http://www. atsdr.cdc.gov/spl. Accessed 08 Oct 2018
6. Gil F, Pla A. Biomarkers as biological indicators of xenobiotic exposure. J Appl Toxicol. 2001;21(4):245–55.
7. Ruggieri F, Majorani C, Domanico F, Alimonti A. Mercury in children: current state on exposure through human biomonitoring studies. Int J Environ Res Public Health. 2017;14(5). doi:https://doi.org/10.3390/ijerph14050519. 8. Canfield RL, Henderson CR Jr, Cory-Slechta DA, Cox C, Jusko TA, Lanphear
BP. Intellectual impairment in children with blood lead concentrations below 10 microg per deciliter. N Engl J Med. 2003;348(16):1517–26. 9. Wasserman GA, Liu X, Parvez F, Ahsan H, Levy D, Factor-Litvak P, et al. Water
manganese exposure and children's intellectual function in Araihazar, Bangladesh. Environ Health Perspect. 2006;114(1):124–9.
10. Wright RO, Amarasiriwardena C, Woolf AD, Jim R, Bellinger DC. Neuropsychological correlates of hair arsenic, manganese, and cadmium levels in school-age children residing near a hazardous waste site. Neurotoxicology. 2006;27(2):210–6.
11. Kim Y, Kim BN, Hong YC, Shin MS, Yoo HJ, Kim JW, et al. Co-exposure to environmental lead and manganese affects the intelligence of school-aged children. Neurotoxicology. 2009;30(4):564–71.
12. Riojas-Rodriguez H, Solis-Vivanco R, Schilmann A, Montes S, Rodriguez S, Rios C, et al. Intellectual function in Mexican children living in a mining area and environmentally exposed to manganese. Environ Health Perspect. 2010; 118(10):1465–70.
13. Bouchard MF, Sauve S, Barbeau B, Legrand M, Brodeur ME, Bouffard T, et al. Intellectual impairment in school-age children exposed to manganese from drinking water. Environ Health Perspect. 2011;119(1):138–43.
14. Jakubowski M. Low-level environmental lead exposure and intellectual impairment in children--the current concepts of risk assessment. Int J Occup Med Environ Health. 2011;24(1):1–7.
15. Menezes-Filho JA, Novaes Cde O, Moreira JC, Sarcinelli PN, Mergler D. Elevated manganese and cognitive performance in school-aged children and their mothers. Environ Res. 2011;111(1):156–63.
16. Lucchini RG, Zoni S, Guazzetti S, Bontempi E, Micheletti S, Broberg K, et al. Inverse association of intellectual function with very low blood lead but not with manganese exposure in Italian adolescents. Environ Res. 2012;118:65–71.
17. Lucchini RG, Guazzetti S, Zoni S, Donna F, Peter S, Zacco A, et al. Tremor, olfactory and motor changes in Italian adolescents exposed to historical ferro-manganese emission. Neurotoxicology. 2012;33(4):687–96.
18. Skerfving S, Lofmark L, Lundh T, Mikoczy Z, Stromberg U. Late effects of low blood lead concentrations in children on school performance and cognitive functions. Neurotoxicology. 2015;49:114–20.
19. Claus Henn B, Schnaas L, Ettinger AS, Schwartz J, Lamadrid-Figueroa H, Hernandez-Avila M, et al. Associations of early childhood manganese and lead coexposure with neurodevelopment. Environ Health Perspect. 2012; 120(1):126–31.
20. Ericson JE, Crinella FM, Clarke-Stewart KA, Allhusen VD, Chan T, Robertson RT. Prenatal manganese levels linked to childhood behavioral disinhibition. Neurotoxicol Teratol. 2007;29(2):181–7.
21. Carvalho CF, Menezes-Filho JA, de Matos VP, Bessa JR, Coelho-Santos J, Viana GF, et al. Elevated airborne manganese and low executive function in school-aged children in Brazil. Neurotoxicology. 2014;45:301–8.
22. Boucher O, Muckle G, Jacobson JL, Carter RC, Kaplan-Estrin M, Ayotte P, et al. Domain-specific effects of prenatal exposure to PCBs, mercury, and lead on infant cognition: results from the environmental contaminants and child development study in Nunavik. Environ Health Perspect. 2014;122(3):310–6. 23. Wasserman GA, Liu X, Parvez F, Factor-Litvak P, Ahsan H, Levy D, et al.
Arsenic and manganese exposure and children's intellectual function. Neurotoxicology. 2011;32(4):450–7.
24. Khan K, Wasserman GA, Liu X, Ahmed E, Parvez F, Slavkovich V, et al. Manganese exposure from drinking water and children's academic achievement. Neurotoxicology. 2012;33(1):91–7.
25. Bhang SY, Cho SC, Kim JW, Hong YC, Shin MS, Yoo HJ, et al. Relationship between blood manganese levels and children's attention, cognition, behavior, and academic performance--a nationwide cross-sectional study. Environ Res. 2013;126:9–16.
26. Amoros R, Murcia M, Ballester F, Broberg K, Iniguez C, Rebagliato M, et al. Selenium status during pregnancy: Influential factors and effects on neuropsychological development among Spanish infants. Sci Total Environ. 2017;610–611:741–9.
27. Vinceti M, Mandrioli J, Borella P, Michalke B, Tsatsakis A, Finkelstein Y. Selenium neurotoxicity in humans: bridging laboratory and epidemiologic studies. Toxicol Lett. 2014;230(2):295–303.
28. Brigelius-Flohe R, Banning A, Schnurr K. Selenium-dependent enzymes in endothelial cell function. Antioxid Redox Signal. 2003;5(2):205–15. 29. Scheinost D, Sinha R, Cross SN, Kwon SH, Sze G, Constable RT, et al. Does
prenatal stress alter the developing connectome? Pediatr Res. 2017;81(1–2): 214–26.
30. Naess O, Piro FN, Nafstad P, Smith GD, Leyland AH. Air pollution, social deprivation, and mortality: a multilevel cohort study. Epidemiology. 2007; 18(6):686–94.
31. Bellinger DC. Lead neurotoxicity and socioeconomic status: conceptual and analytical issues. Neurotoxicology. 2008;29(5):828–32.
32. Wright RJ. Moving towards making social toxins mainstream in children’s environmental health. Curr Opin Pediatr. 2009;21(2):222–9.
33. Traboulsi H, Guerrina N, Iu M, Maysinger D, Ariya P, Baglole CJ. Inhaled pollutants: the molecular scene behind respiratory and systemic diseases associated with ultrafine particulate matter. Int J Mol Sci. 2017;18(2). doi:
https://doi.org/10.3390/ijms18020243.
34. Jorgensen A. Oxidatively generated DNA/RNA damage in psychological stress states. Dan Med J. 2013;60(7):B4685.
35. Brunst KJ, Sanchez-Guerra M, Chiu YM, Wilson A, Coull BA, Kloog I, et al. Prenatal particulate matter exposure and mitochondrial dysfunction at the maternal-fetal interface: effect modification by maternal lifetime trauma and child sex. Environ Int. 2018;112:49–58.
36. Jia G, Torri G, Centioli D, Magro L. A radiological survey and the impact of the elevated concentrations of (210) Pb and (210) Po released from the iron- and steel-making plant ILVA Taranto (Italy) on the environment and the public. Environ Sci Process Impacts. 2013;15(3):677–89.
37. Pirastu R, Ricci P, Comba P, Bianchi F, Biggeri A, Conti S, et al. SENTIERI project: discussion and conclusions. Epidemiol Prev. 2014;38(2 Suppl 1):125–33. 38. Vimercati L, Baldassarre A, Gatti MF, Gagliardi T, Serinelli M, De Maria L, et al.
Non-occupational exposure to heavy metals of the residents of an industrial area and biomonitoring. Environ Monit Assess. 2016;188(12):673.
39. Vimercati L, Gatti MF, Gagliardi T, Cuccaro F, De Maria L, Caputi A, et al. Environmental exposure to arsenic and chromium in an industrial area. Environ Sci Pollut Res Int. 2017;24(12):11528–35.
40. VDS (Valutazione del Danno Sanitario). Law of the Regione Puglia; 2012. p. 21. 41. Ruggieri F, Alimonti A, Bocca B. Full validation and accreditation of a
method to support human biomonitoring studies for trace and ultra-trace elements. TrAC Trends Anal Chem. 2016;80:471–85.
42. Alimonti A, Bocca B, Ruggieri F. Reference method for the determination of chemical elements in human biological matrices: analytical performances and uncertainty of data; 2015.
43. Domanico F, Forte G, Majorani C, Senofonte O, Petrucci F, Pezzi V, et al. Determination of mercury in hair: comparison between gold amalgamation-atomic absorption spectrometry and mass spectrometry. J Trace Elem Med Biol. 2017;43:3–8.
44. Cesana GC, de Vito G, Ferrario M, Sega R, Mocarelli P. Trends of smoking habits in northern Italy (1986-1990). The WHO MONICA project in area Brianza, Italy. MONICA area Brianza research group. Eur J Epidemiol. 1995; 11(3):251–8.
45. Bradley RH, Caldwell BM, Rock SL, Hamrick HM, Harris P. Home observation for measurement of the environment: development of a home inventory for use with families having children 6 to 10 years old. Contemp Educ Psychol. 1988;13(1):58–71.
46. Wechsler D. Wechsler Intelligence Scale for Children - Fourth Edition (WISC-IV). Italian version, Giunti Psychometrics, 2012. ed. Firenze: Pearson; 2003. 47. CANTAB. The world’s leading cognitive assessments. Cambridge
Neuropsychological Test Automated Battery. Ltd. CC ed 2015.
48. Raven JC. SPM– standard progressive matrices. Edizione italiana a cura di Giunti Organizzazioni Speciali; 2008.
49. Wood SN. Fast stable restricted maximum likelihood and marginal likelihood estimation of semiparametric generalized linear models. J R Stat Soc Ser B (Stat Methodol). 2011;73(1):3–36.
50. Team RDC. A language and environment for statistical computing. Vienna: R Foundation for Statistical Computing; 2013. Available from: http://www.R-project.org/
51. Schulz C, Angerer J, Ewers U, Heudorf U, Wilhelm M. Human biomonitoring Commission of the German Federal Environment a. revised and new reference values for environmental pollutants in urine or blood of children in Germany derived from the German environmental survey on children 2003-2006 (GerES IV). Int J Hyg Environ Health. 2009;212(6):637–47. 52. NHANES. Updated Tables. Fourth National Report on Human Exposure to
Environmental Chemicals: CDC National Health and Nutrition Examination Survey; 2017 Available from:https://www.cdc.gov/exposurereport/. 53. Davis MA, Mackenzie TA, Cottingham KL, Gilbert-Diamond D, Punshon T,
Karagas MR. Rice consumption and urinary arsenic concentrations in U.S. children. Environ Health Perspect. 2012;120(10):1418–24.
54. DFG. German DRF Deutsche Forschungsgemeinschaft. List of MAK and BAT Values 2009. Germany: Wiley-VCH; 2012.
55. Newcombe C, Raab A, Williams PN, Deacon C, Haris PI, Meharg AA, et al. Accumulation or production of arsenobetaine in humans? J Environ Monit. 2010;12(4):832–7.
56. Riederer AM, Belova A, George BJ, Anastas PT. Urinary cadmium in the 1999-2008 U.S. National Health and nutrition examination survey (NHANES). Environ Sci Technol. 2013;47(2):1137–47.
57. Schulz C, Wilhelm M, Heudorf U, Kolossa-Gehring M. Human biomonitoring Commission of the German Federal Environment a. update of the reference and HBM values derived by the German human biomonitoring commission. Int J Hyg Environ Health. 2011;215(1):26–35.
58. Carneiro MF, Moresco MB, Chagas GR, de Oliveira Souza VC, Rhoden CR, Barbosa F Jr. Assessment of trace elements in scalp hair of a young urban population in Brazil. Biol Trace Elem Res. 2011;143(2):815–24.
59. Benes B, Sladka J, Spevackova V, Smid J. Determination of normal concentration levels of Cd, Cr, Cu, Hg, Pb, Se and Zn in hair of the child population in the Czech Republic. Cent Eur J Public Health. 2003;11(4):184–6. 60. Smolders R, Den Hond E, Koppen G, Govarts E, Willems H, Casteleyn L, et al.
Interpreting biomarker data from the COPHES/DEMOCOPHES twin projects: using external exposure data to understand biomarker differences among countries. Environ Res. 2015;141:86–95.
61. Molina-Villalba I, Lacasana M, Rodriguez-Barranco M, Hernandez AF, Gonzalez-Alzaga B, Aguilar-Garduno C, et al. Biomonitoring of arsenic, cadmium, lead, manganese and mercury in urine and hair of children living near mining and industrial areas. Chemosphere. 2015;124:83–91. 62. Frery N, Vandentorren S, Etchevers A, Fillol C. Highlights of recent studies
and future plans for the French human biomonitoring (HBM) programme. Int J Hyg Environ Health. 2012;215(2):127–32.
63. Pino A, Chiarotti F, Calamandrei G, Gotti A, Karakitsios S, Handakas E, et al. Human biomonitoring data analysis for metals in an Italian adolescents cohort: an exposome approach. Environ Res. 2017;159:344–54. 64. Tatsuta N, Nakai K, Iwai-Shimada M, Suzuki T, Satoh H, Murata K. Total
mercury levels in hair of children aged 7years before and after the Great East Japan Earthquake. Sci Total Environ. 2017;596–597:207–11. 65. Pino A, Amato A, Alimonti A, Mattei D, Bocca B. Human biomonitoring for
metals in Italian urban adolescents: data from Latium region. Int J Hyg Environ Health. 2012;215(2):185–90.
66. Eastman RR, Jursa TP, Benedetti C, Lucchini RG, Smith DR. Hair as a biomarker of environmental manganese exposure. Environ Sci Technol. 2013;47(3):1629–37.
67. Jusko TA, Henderson CR, Lanphear BP, Cory-Slechta DA, Parsons PJ, Canfield RL. Blood lead concentrations < 10 microg/dL and child intelligence at 6 years of age. Environ Health Perspect. 2008;116(2):243–8.
68. Surkan PJ, Zhang A, Trachtenberg F, Daniel DB, McKinlay S, Bellinger DC. Neuropsychological function in children with blood lead levels <10 microg/ dL. Neurotoxicology. 2007;28(6):1170–7.
69. Lanphear BP, Hornung R, Khoury J, Yolton K, Baghurst P, Bellinger DC, et al. Low-level environmental lead exposure and children's intellectual function: an international pooled analysis. Environ Health Perspect. 2005;113(7):894–9. 70. Solon O, Riddell TJ, Quimbo SA, Butrick E, Aylward GP, Lou Bacate M, et al.
Associations between cognitive function, blood lead concentration, and nutrition among children in the Central Philippines. J Pediatr. 2008;152(2): 237–43.
71. Liu J, Li L, Wang Y, Yan C, Liu X. Impact of low blood lead concentrations on IQ and school performance in Chinese children. PLoS One. 2013;8(5): e65230.
72. Lee MJ, Chou MC, Chou WJ, Huang CW, Kuo HC, Lee SY, et al. Heavy metals’ effect on susceptibility to attention-deficit/hyperactivity disorder: implication of lead, cadmium, and antimony. Int J Environ Res Public Health. 2018;15(6). doi:https://doi.org/10.3390/ijerph15061221.
Publisher’s Note
Springer Nature remains neutral with regard to jurisdictional claims in published maps and institutional affiliations.